 MetaTrader 5
 Experts
 Indicatori
 librerie
 Utilità
 Widget
 Regole
Guarda i video tutorial del Market su YouTube
Come acquistare un Robot di Trading o un indicatore
Esegui il tuo EA
hosting virtuale
hosting virtuale
Prova un indicatore/robot di trading prima di acquistarlo
Vuoi guadagnare nel Market?
Come presentare un prodotto per venderlo con successo
Indicatori tecnici a pagamento per MetaTrader 4 - 59
 I segnali degli indicatori tecnici elencati di seguito hanno un ruolo cruciale nell'apertura e nella chiusura delle transazioni nella piattaforma MetaTrader 4. L'essenza degli indicatori è una trasformazione matematica del prezzo di un simbolo finanziario finalizzata a prevedere i cambiamenti di prezzo.

Indicator function As shown in the figure, choosing to buy or sell at the dotted line of the indicator, and following the trend with the Angle of the channel up and down, are equally effective in bands and trends It is best to use 1H for testing About update questions In order to be more suitable for market fluctuations, the company regularly updates the indicators Product cycle and trading time applicable to indicators Applicable mainstream currency pair EUR/USD GBP/USD NZD/USD AUD/US

Indicator function When the color of the indicator changes, it will send you a long short notice
It is best to use 1H for testing About update questions In order to be more suitable for market fluctuations, the company regularly updates the indicators Product cycle and trading time applicable to indicators Applicable mainstream currency pair EUR/USD GBP/USD NZD/USD AUD/USD USD/JPY USD/CAD USD/CHF Applicable mainstream cross currency pair EUR/JPY EUR/GBP EUR/CHF EUR/CAD EUR/NZD AUD/CAD AU

Indicator function Choose to buy or sell at the critical point of indicator zero It is best to use 1H for testing About update questions In order to be more suitable for market fluctuations, the company regularly updates the indicators Product cycle and trading time applicable to indicators Applicable mainstream currency pair EUR/USD GBP/USD NZD/USD AUD/USD USD/JPY USD/CAD USD/CHF Applicable mainstream cross currency pair EUR/JPY EUR/GBP EUR/CHF EUR/CAD EUR/NZD AUD/CAD AUD/NZD AUD/CHF AUD
This is the new version of the Algorithmic signals featuring a new algorithm. It is a blend of technical and candlestick analysis. Candlestick analysis are often ignored while creating technical strategies but this version has a feature to include that and make confirmations more strong. Usage:- Traders can use the signals for buying and selling assets or even blend their own favorite indicators with it.

Indicator function This index buys and sells according to the color, using time is one hour,Please run the test on a 30-minute cycle It is best to use 1H for testing About update questions In order to be more suitable for market fluctuations, the company regularly updates the indicators Product cycle and trading time applicable to indicators Applicable mainstream currency pair EUR/USD GBP/USD NZD/USD AUD/USD USD/JPY USD/CAD USD/CHF Applicable mainstream cross currency pair EUR/JPY EUR/GBP E

It will be the best tool for you to make a profit! Through unique algorithms You're going to see an amazing amount of right trading signals Make huge profits every day and realize more possibilities! Like the car no money to buy it, the love of the girls dare not to pursue?Or the credit card bill is not paid, the rent does not have the extra money to settle?Or are you fed up with being bossed around by your boss and Hope to get more people's respect?Can't afford to buy the things you want ? wa

Indicator function Buy and sell by indicator color It is best to use 1H for testing About update questions In order to be more suitable for market fluctuations, the company regularly updates the indicators Product cycle and trading time applicable to indicators Applicable mainstream currency pair EUR/USD GBP/USD NZD/USD AUD/USD USD/JPY USD/CAD USD/CHF Applicable mainstream cross currency pair EUR/JPY EUR/GBP EUR/CHF EUR/CAD EUR/NZD AUD/CAD AUD/NZD AUD/CHF AUD/JPY GBP/JPY GBP/CHF NZD/JPY App

Indicator function Moving averages cross a short-term buy and sell, moving averages cross a 50 horizontal line a long-term buy and sell It is best to use 1H for testing About update questions In order to be more suitable for market fluctuations, the company regularly updates the indicators Product cycle and trading time applicable to indicators Applicable mainstream currency pair EUR/USD GBP/USD NZD/USD AUD/USD USD/JPY USD/CAD USD/CHF Applicable mainstream cross currency pair EUR/JPY EUR/GB

Leave a review for this product, and receive another "Free" product that you choose. You can see my other products here: https://www.mql5.com/en/users/zakri/seller
Trend Detective is an advanced trend detection indicator which shows accurate entry points in direction of trend. It uses smart technology in order to detect entry points, trend changing points, and TP points. It also shows hit rate for current chart using selected parameters. Hit rate for this indicator on different charts can be 8
Think of an Experienced Traders’ Brain as a blueprint for a trading algorithm. Then the desire to keep charts as clutter free as possible. What you see below is a blueprint of Paul Bratby’s thought process but even he admits, he is getting too old to focus on all of these! • 9 Decision Points before Paul considers grading the trade a 3* trade
• Then another special Decision Point will make it a 4* trade
• Another for 5* trade
• And Finally, a total of 12 Decision Points being correct before he
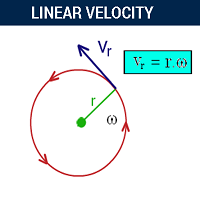
LinearVelocity Indicator
Velocity is Distance/Time where Distance is Close-Open basicly. Linear velocity; calculated with tick volume*Velocity in smoothed way. Red line shows LinearVelocity based of zero level in that way. And Magenta line is Moving avrages of LinearVelocity. Final Indicator helps you detecting trend in different timeframes. Default input parameters for M5 timeframe, and you can change them for different timeframes and different pairs. I wish you good profits.
The indicator represents 2 lines of different periods: one line is short-term (red line), the other is long-term (blue line). Each of the lines is a hard Moving Average, weighted by many parameters. Accordingly, you need to trade according to chart volatility. For convenience, the indicator has been added moving averages of the High, Low, Median ((High-Low) / 2) periods.
Input parameters:
IndicatorPeriod: several periods (general- general period, calculation for all periods; small- short-term
The indicator sets two bells at the planned levels. The upper bell is set above Ask price and lower bell is below Bid price. You can set both or one of them. When the level is exceeded, indicator emit a single sounds. Sound is emit with every arriving tick. In fast arrivals of Tick, the sounds is continuously. The bells are initially entered manually in the input window. They can be modified by moving the set of lines in chart. It is good practice top bell set slightly below valid level

Grey worm This indicator is a group of indicators combined
Volatility and saturation give us buying and selling and many more things
Use this indicator with your technical analysis or strategy
Do not use it alone and it will give you very good results
It is valid to work on all pairs, metals and instruments
If you have any question, I will be happy to answer it
Please do not forget to rate the good and the positive comment

Indicator function Select a trend based on the Angle above and below the indicator curve, and choose overbought and oversold when an action crosses the trend line It is best to use 1H for testing About update questions In order to be more suitable for market fluctuations, the company regularly updates the indicators Product cycle and trading time applicable to indicators Applicable mainstream currency pair EUR/USD GBP/USD NZD/USD AUD/USD USD/JPY USD/CAD USD/CHF Applicable mainstream cross c
TDI Signals generates buy and sell arrows based on a TDI(Traders Dynamic Index) algorithm. It looks for price breakouts, continuations and reversals. By default it runs in the trend mode but user is provided with the option to change that to reversal mode. Trader can use the mode which compliments his/her trading style.
Usage:- TDI Signals can be used as a stand alone indicator with context or even be added to strategies to make confirmations more strong. Volatility based stop loss, take pro

Indicator function Choose buy and sell at horizontal line 0 It is best to use 1H for testing About update questions In order to be more suitable for market fluctuations, the company regularly updates the indicators Product cycle and trading time applicable to indicators Applicable mainstream currency pair EUR/USD GBP/USD NZD/USD AUD/USD USD/JPY USD/CAD USD/CHF Applicable mainstream cross currency pair EUR/JPY EUR/GBP EUR/CHF EUR/CAD EUR/NZD AUD/CAD AUD/NZD AUD/CHF AUD/JPY GBP/JPY GBP/CHF NZ
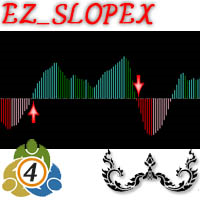
EZ Slope X is an Oscillator Indicator very easy to used just look at the Indicator and the base line (Zero line)
Trade Setup for Trend follow : - when the indicator is above 0 is gone Buy. - when the indicator is below 0 is gone Sell.
Trade Setup for Swing Trade : Bullish Market : - Open Buy when the indicator turn Light Green color. - Close Buy when the indicator turn Dark Green color. Bearish Market : - Open Sell when the indicator turn to Red color. - Close Sell when the indicator turn to

Indicator function Buy and sell at the 0.19 threshold.Notice that the level number is 0.19! It is best to use 1H for testing About update questions In order to be more suitable for market fluctuations, the company regularly updates the indicators Product cycle and trading time applicable to indicators Applicable mainstream currency pair EUR/USD GBP/USD NZD/USD AUD/USD USD/JPY USD/CAD USD/CHF Applicable mainstream cross currency pair EUR/JPY EUR/GBP EUR/CHF EUR/CAD EUR/NZD AUD/CAD AUD/NZD AU

Are you looking for a powerful tool to analyze currency strength and identify the best trading opportunities? Look no further than the Currency Strength Indicator. Our easy-to-use tool offers a wide range of features that will help you professionally define weak and strong currency pairs, so you can make informed trading decisions with ease. One of the most significant benefits of our indicator is the ability to select up to 10 currencies for monitoring. And the currencies are not limited to fi

Indicator function Choose to buy and sell according to the system prompts It is best to use 1H for testing About update questions In order to be more suitable for market fluctuations, the company regularly updates the indicators Product cycle and trading time applicable to indicators Applicable mainstream currency pair EUR/USD GBP/USD NZD/USD AUD/USD USD/JPY USD/CAD USD/CHF Applicable mainstream cross currency pair EUR/JPY EUR/GBP EUR/CHF EUR/CAD EUR/NZD AUD/CAD AUD/NZD AUD/CHF AUD/JPY GBP/

Indicator function Choose to go long or short when crossing the EMA or crossing the 0 line below It is best to use 1H for testing About update questions In order to be more suitable for market fluctuations, the company regularly updates the indicators Product cycle and trading time applicable to indicators Applicable mainstream currency pair EUR/USD GBP/USD NZD/USD AUD/USD USD/JPY USD/CAD USD/CHF Applicable mainstream cross currency pair EUR/JPY EUR/GBP EUR/CHF EUR/CAD EUR/NZD AUD/CAD AUD/N

Indicator function Please set the level line with a value of 0 and buy and sell at the level line of 0 It is best to use 1H for testing About update questions In order to be more suitable for market fluctuations, the company regularly updates the indicators Product cycle and trading time applicable to indicators Applicable mainstream currency pair EUR/USD GBP/USD NZD/USD AUD/USD USD/JPY USD/CAD USD/CHF Applicable mainstream cross currency pair EUR/JPY EUR/GBP EUR/CHF EUR/CAD EUR/NZD AUD/CAD

Indicator function Choose to buy and sell according to the system prompts It is best to use 1H for testing About update questions In order to be more suitable for market fluctuations, the company regularly updates the indicators Product cycle and trading time applicable to indicators Applicable mainstream currency pair EUR/USD GBP/USD NZD/USD AUD/USD USD/JPY USD/CAD USD/CHF Applicable mainstream cross currency pair EUR/JPY EUR/GBP EUR/CHF EUR/CAD EUR/NZD AUD/CAD AUD/NZD AUD/CHF AUD/JPY GBP/

Indicator function Choose to buy and sell where the EMA crosses
It is best to use 1H for testing About update questions In order to be more suitable for market fluctuations, the company regularly updates the indicators Product cycle and trading time applicable to indicators Applicable mainstream currency pair EUR/USD GBP/USD NZD/USD AUD/USD USD/JPY USD/CAD USD/CHF Applicable mainstream cross currency pair EUR/JPY EUR/GBP EUR/CHF EUR/CAD EUR/NZD AUD/CAD AUD/NZD AUD/CHF AUD/JPY GBP/JPY GBP/C

Indicator function Choose to buy and sell where the yellow EMA crosses zero It is best to use 1H for testing About update questions In order to be more suitable for market fluctuations, the company regularly updates the indicators Product cycle and trading time applicable to indicators Applicable mainstream currency pair EUR/USD GBP/USD NZD/USD AUD/USD USD/JPY USD/CAD USD/CHF Applicable mainstream cross currency pair EUR/JPY EUR/GBP EUR/CHF EUR/CAD EUR/NZD AUD/CAD AUD/NZD AUD/CHF AUD/JPY GB
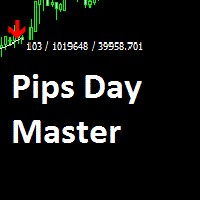
indicator for trading in the forex markets and others. Complete absence of redrawing.
recommendations and with default period. conservative trading method take profit 50 pips stop loss 80-100 pips closing deals by take profit - stop loss or by the opposite signal aggressive trading method take profit 100 pips stop loss 100 pips closing deals by take profit - stop loss or by the opposite signal the signal is sent to the current candle at the moment of its appearance there is a sound alert and p

Indicator function Choose to buy and sell where the yellow moving average crosses zero. Arrow for overbought oversold reference only The indicator is suitable for the best time period of 1H
About update questions In order to be more suitable for market fluctuations, the company regularly updates the indicators Product cycle and trading time applicable to indicators Applicable mainstream currency pair EUR/USD GBP/USD NZD/USD AUD/USD USD/JPY USD/CAD USD/CHF Applicable mainstream cross currency
Currencies Strength Meter Smooth Lines Currencies Strongest Weakest SMOOTH STRENGTH METER INDICATOR (SMOOTH LINE) it draws Currencies TREND Volatility Power / Strength lines : - Detects the 2 highly TRENDED Volatile pairs ( will be the Bold Lines ) - A very Helpful Indicator - It draws smooth lines for up to 20 currencies pairs representing Volatility strength and power - First it indicates the most powerful trended direction pairs : Strongest / Weaker - MAIN FUNCTION :i
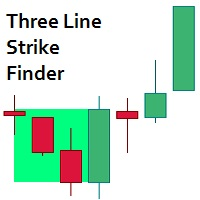
The three line strike pattern, which consists of three bullish or bearish candles, and a fourth candle that is larger than the previous three in the opposite direction, can be traded many ways. This indicator simply highlights those previous trades, and then pushes out targets in the direction of the last candle.
Advantages of three line strike The three line strike can be traded as part of a bullish and bearish engulfing pattern, 2 bar reversal set up and n-Bar rallies and declines.
How it w
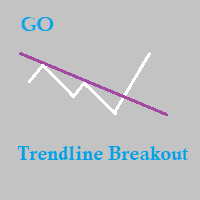
GO Trendline Breakout indicator is designed to find the breakouts of trendlines in the direction of the trend. Feel free to check out my other products here : https://www.mql5.com/en/users/gyila.oliver/seller#products
the indicator implements a unique trend detection algorithm, and finds the trendlines from swing highs/lows/ The indicator implements visual alerts and push notifications.
The indicator can be used on any currency pair / stocks/ indices and on any timeframe.
How to use the i
This indicator computes a channel around the price based on highs and lows of the previous bars (whose number is set by user). The indicator provides alerts when upper or lower channel bands are crossed by closing price. User can receive a standard alert on MT4 and/or a push notification on Metatrader app. User can configure the indicator through the following parameters: InpPeriod - number of previous bars UseAlert - if set to True, enables visual alert on the display UsePush - if set to Tr
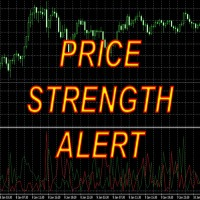
This indicator computes two lines representing the price bar strength. Close, high and low of each bar are compared with the highest high and lowest low of the last N bars, where N is a parameter set by user. Two lines are computed, a red one and a green one, with values between 0 and 100. High values of the red line means that close is very far from the bar high, while high value of the green line means price is very far from the bar low . The indicator provides alerts when red or green line a

Gold Pro MT4 is a trend indicator designed specifically for gold and can also be used on any symbol. The indicator does not redraw and does not lag.
Free Dashboard : monitor All pairs and timeframes here: https://www.mql5.com/en/market/product/60431 SETTINGS Factor 1: use to calculate different methods of drawing indicator line Factor 2: use to calculate different methods of drawing indicator line AlertByPopup - true/false popup alerts. AlertBySound - true/false

FXC iMACD-DivergencE MT4 Indicator
This is an advanced MACD indicator that finds trend-turn divergences on the current symbol. The indicator detects divergence between the MACD and the price movements as a strong trend-turn pattern.
Main features: Advanced divergence settings
Price based on Close, Open or High/Low prices Give Buy/Sell open signals PUSH notifications
E-mail sending Pop-up alert Customizeable Information panel Input parameters: MACD Fast-EMA: The Fast-EMA variable of the MACD indi
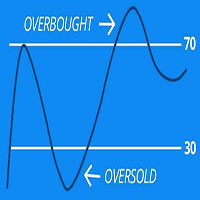
Scan all your favorite pairs with RSI, and get notified on your preferred time frames.
Settings are Customizable
Click to change time frame or open new pairs
Notification: Phone/Popup/Email The relative strength index (RSI) is a technical indicator used in the analysis of financial markets. It is intended to chart the current and historical strength or weakness of a pair/stock based on the closing prices of a recent trading period. The RSI is most typically used on a 14 period, measured on a

A reliable and profitable tool in the right hands For binary options with expiration time in one candle of the traded timeframe Money management recommended Martingale in 1 or 2 knees Example First deal 1 dollar If the deal loses Second trade $ 3 Profit 2 knee option The second trade loses Third deal $ 9 Profit. All the following transactions after the 3rd one you open at your own risk In the case of small deposits, it is recommended to use only 1 knee of Martingale Up arrow buy Down arrow sale

DMAX SIGNAL IS VERY POWERFUL TOOL TO HELP YOU ENTRY,ITS CAN DETECT OVERSOLD AND OVERBOUGHT IN FOREX MARKET. ITS CAN TRADE 24 FOREX PAIR IN MARKET, 80% ACCURATE RESULT. MANY TRADER FAIL BECAUSE OF ENTRY POINT AND EXIT POINT , SIGNAL OF DMAX WILL GIVE VERY GOOD SIGNAL TO LET YOU KNOW WHERE TO ENTRY AND EXIT. RISK MANAGEMENT IS VERY IMPORTANT IN TRADING FOREX, PLEASE DONT RISK OVER 5% PER TRADE IS FORE MARKET
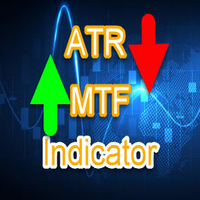
The Average True Range (ATR) is a tool to measure volatility. ATR MTF (Multi Time Frame) indicator provides all timeframe trends helps to identify in which kind of volatility environment the market .This indicator can be used with any Trading Systems for additional confirmation of trading entries or exits. It is a very helpful tool to calculate Targets and Stops according the current market conditions.

bull and bear filter helps you choose the most tradable currencies, saves most of you time,so you can focus on trading instead of filtering the tradable currencies exhaustedly. 1. It works in the main chart window, the red currency pair means it's bear market, green mean bull market, white means the currencies are not filtered,neither bull nor bear, they are invisible if the chart background is white. 2. the main chart timeframe has no impact on filtering, it's based on the variable you assign i

Namiri Trade Engine is an ALL in ONE trading system that combines price structure, volume pressure, market condition & risk management to give you the BEST opportunities for A+ trade setups with auto lot size
WAIT FOR YOUR A+ SETUP || ONLY TAKE YOUR A+ TRADE || RINSE REPEAT YOUR A+ MOVE
Chart Features
Panel - Shows the asset, market, price, pip, account, trade & profit|loss information Structure - Shows areas of support & resistance Risk Management - Shows risk analysis period of 100 bars, buy
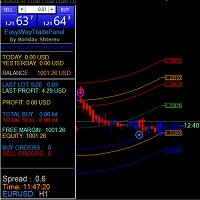
#EasyWayTradePanel indicator for #MetaTrader4 , is trade assistants for manual trading in any #currency in #FOREX , #CRYPTOCURRENCY as #Bitcoin , #Ethereum , #Lightcoin and more. Also is EasyWay to use for #COMMODITY as #Gold , #Silver , #Oil , #Gas ...... and #CFDs . When installed on the chart in your chosen time frame and trading tool, the indicator automatically draws the following custom indicators used in the EasyWayTradePanel trading strategy. 1) Zigzag_Extreme_Indicator, 2) Regression_C
GO Breakout and Retest is probably the best price action indicator you can currently find on the market. Designed for price action traders and not only, the indicator helps you spot retests after breakouts of supply / demand zones.
After purchase, leave a review, a comment or make a screenshot of your purchase and contact me to receive for free the Trade Entry Manager utility !
Please read the full description of the product in order to use the indicator properly !
Feel free to check out my

RSI ALARM - Indicatore RSI con Livelli Dinamici e Avvisi RSI ALARM è un indicatore di forza relativa potenziato per MetaTrader, progettato per i trader che desiderano catturare gli estremi di ipercomprato e ipervenduto. A differenza delle versioni standard, incorpora linee di livello dinamiche e interattive che puoi trascinare liberamente sul grafico per personalizzare le tue zone di attivazione in tempo reale, offrendo avvisi istantanei sulla piattaforma e sul tuo dispositivo mobile insieme a

Manuale utente: Sistema di livelli dinamici SORS L'indicatore SORS è uno strumento ad alta precisione progettato per proiettare i livelli chiave di supporto e resistenza in tempo reale. Utilizza la deviazione standard (volatilità endogena) per calcolare gli intervalli di espansione in base al prezzo di apertura dei cicli temporali critici. Il suo obiettivo è identificare aree di esaurimento o accelerazione, consentendo al trader di operare con una tabella di marcia matematica.
Guida ai paramet

When analyzing financial time series, researchers most often make a preliminary assumption that prices are distributed according to the normal (Gaussian) law. This approach is due to the fact that a large number of real processes can be simulated using the normal distribution. Moreover, the calculation of the parameters of this distribution presents no great difficulties. However, when applied to financial markets, normal distribution does not always work. The returns on financial instruments of

DIVERGENCE OSW (For Metatrader 4) This indicator works on divergences and has the following functions: Generate an alert when a divergence occurs. Create lines by calculating the Stoploss and Takeprofit according to projection waves of inverse waves. Create an arrow indicating the possible direction of the market. The signals sent by the indicator are given when the candle ends. The Trader must evaluate each divergence to take entries. Settings: Activation and deactivation of alerts. Alert inte

This Indicator uses Center of Gravity (COG) Indicator to find you the best trades.
It is a reversal based Swing Indicator which contains an Arrows Indicator. That you can buy here from Metatrader Market.
Check out this blog post for detailed How to Use Guide and links to free scanner: https://www.mql5.com/en/blogs/post/758262
Scanner needs this arrows indicator in same directory to run
Copy scanner ex4 in same folder as your Arrows Indicator: MQL4/Indicators/Market/ All extra indicators and

PRICE Direction Predictor Indicator (LOW BUY PRICE 4 Limited time) This Indicator provides Buy/Sell Signal based on calculations on Higher frame (main Trend) and Lower frame(Entry signals) * You should select the higher and lower frame for indicator calculations * You select the Trend line colors as you prefer * Enable or disable Alerts! Trend lines UP/Down are drawn when a trend is detected Wait for small arrows for entry : *Normally an UP arrow in an UP Trend is a BUY signal : ---you Close
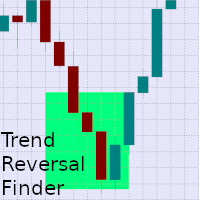
Listed in his faous book "Trading chart patterns like the pros", Suri Duddrella outlines the N-bar rally and decline reversal pattern, which simply states that when stocks make a new high or new low, momentum players will push this stock down or up until eventually they run out of steam. This indicator will look back a certain number of bars to find a continuous uninterrupted rally or decline. Once found, the pattern will look forwards to find the first bar that closes, within a certain range,

Signal trend indicator.
Detects the direction of the trend and is coloured accordingly.
Has built in audible and visual alerts when trends change.
Can send notifications to your phone or email.
Allows Trend and Counter-Trend trading.
Works on all timeframes, all currency pairs, metals, indices and cryptocurrencies.
Can be used with binary options.
Distinctive features No re-drawing; Simple and clear settings; Four types of alerts; Works on all timeframes and all trading tools; Suitable
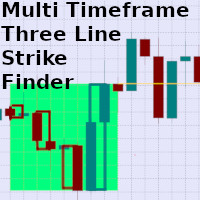
A huge overhaul and improvement on the highly successful Three Line Strike Finder https://www.mql5.com/en/market/product/60396?source=Site+Profile+Seller This fantastic tool will scan your selected timeframes, and display new three line strike patterns as they appear. No more having to flip through different timeframes to check if a new three line strike pattern has emerged. The supported timeframes are, the current timeframe, 15 minute, 30 minute, 1 hour, 4 hour and Daily, all of which can be

RSI Levels generates buy and sell arrows based on RSI analysis. Signals are based on extreme levels breakouts and can be further filtered by a volatility metric. Trader can use the mode which compliments his/her trading style. Features:- Parameters for signal optimization and alerts. Usage:- RSI Levels can be used as a stand alone indicator with context or even be added to strategies to make confirmations more strong. Volatility based stop loss, take profit & position sizing can be very helpf

Supporto e Resistenza Automatici OSW - Livelli Chiave Automatici Automatic Support and Resistance OSW è un indicatore tecnico automatizzato progettato per identificare e tracciare istantaneamente i livelli di Supporto e Resistenza più rilevanti sul tuo grafico. Calcolando in modo intelligente i massimi e i minimi dei timeframe superiori (H1, Giornaliero, Settimanale e Mensile), elimina la soggettività nel segnare le zone chiave di liquidità, consentendo al trader di focalizzare l'attenzione sul
Tired of looking at indicator cluttered charts? Are you a trend trader? I have just the solution for you. Trend Boss.
This indicator allows you to choose some of the most popular trend identifiers such as CCI(Supertrend) or Ichimoku and pair them with some of the most popular entries such as Kijun/Tenkan cross or MACD zero cross. You can now keep your charts clean by hiding all those oscillators and moving averages. Only arrows will be displayed depending on your entry criteria.
Trend filters

The use of indicators is extremely simple and does not contain future functions.
The use of indicators is divided into the following simple parts:
1. The indicator is blue (upward trend) -> only buy orders
2. The indicator is pink (downtrend) -> only sell orders
3. The indicator is white (consolidation trend) -> only wait and see without send orders
4. The price is above the indicator -> Only buy orders can be made
5. The price is below the indicator -> only sell orders
To sum up:
1.

This indicator needs to be used in conjunction with the " Souline Honma Surf " indicator to achieve a higher winning rate.
The use of indicators is extremely simple and does not contain future functions.
The use of Souline honma wave indicators is divided into the following simple parts:
1. The indicator is blue (upward trend) -> only buy orders
2. The indicator is pink (down trend) -> only sell orders
The use of the Souline Honma Surf indicator is divided into the following parts:
1. T

FOREX KISS is an indicator that picks out reversal/turning points , it is a combination of levels , clusters and volumes , works on all time frame and all instruments. While doing the paper works which took me 5 years, my aim was to build something that will give me consistent profit all over again while keeping it simple and stupid. My hope that this indicator will bring you confidence and precision.

I modelli di regressione descrivono la relazione tra le variabili adattando una linea ai dati osservati. I modelli di regressione lineare utilizzano una linea retta, mentre i modelli di regressione logistica e non lineare utilizzano una linea curva. La regressione consente di stimare come cambia una variabile dipendente quando cambiano le variabili indipendenti.
La regressione lineare semplice viene utilizzata per stimare la relazione tra due variabili quantitative.
Questo indicatore calcola

Trend formation channel is a set of lines. The two central lines of the indicator represent moving averages of the specified type and period, they also form a small channel. The large channel is formed - the central lines of the indicator plus / minus the standard deviation estimate, multiplied by the coefficient selected by the user. The basic rule for plotting is that about 5% of prices should be outside these lines, and 95% - inside. If the price crosses the upper or lower line too often, th

We are an analytics company that believe in solving complicated problems with simple solutions using data. To minimize the complexities of trading, we have created a range of trading advisory products from the essence of our proprietary STAR System to enhance trading aptitude and to guide users into becoming proficient traders.
Our innovative products capitalizes on 3 core functions – Big Data, Artificial Intelligence, and Technical Expertise and it is with this core, we reshape the world o
Trading in the direction of a strong trend reduces risk and increases profit potential. In general the average directional index (ADX) is used to determine when the price is trending strongly. In many cases, it is the ultimate trend indicator! After all, the trend may be your friend, but it sure helps to know who your friends are.
ADX is used to quantify trend strength. ADX calculations are based on a moving average of price range expansion over a given period of time. The default setting is

Fibonacci retracements can be used to draw support lines, identify resistance levels, place stop-loss orders and set target prices. The Advanced Automatic Fibonacci retracements draws automatically all the levels. You have a lot of options to choose. For exemple you can use the tracements of another time frame (MTF) in the current chart, you can also choose between the closest level or less close to draw the retracements. You can also add 2 levels of your choice. You can add levels extensions o
What is a Pivot?
A pivot is a significant price level known in advance which traders view as important and may make trading decisions around that level. As a technical indicator, a pivot price is similar to a resistance or support level. If the pivot level is exceeded, the price is expected to continue in that direction. Or the price could reverse at or near that level.
What does a Pivot Tell You?
There are pivots and pivot points. These terms may mean different things to different people.
A candlestick pattern indicator for MetaTrader that shows you which patterns are worth trading on your symbol. It marks 24 Japanese candlestick patterns and writes on the chart how many pips price moved after every signal. A panel in the corner of the chart turns those results into a record: total signals, wins, success rate and average pips per signal, measured against the target you set. You see what each pattern did on your symbol and timeframe before you take the next one. What you get 24 ca

The StatZigZag indicator looks like a regular ZigZag , but is built on the basis of completely different algorithms. The StatZigZag indicator is a broken line built from segments of regression lines of different lengths, the beginning of each of which comes from the end of the previous segment. Each regression segment is built until the variance or spread of price around it begins to exceed a certain critical value, after which the construction of this segment ends and the constr

Трендовый стрелочный индикатор. Для анализа использует несколько скользящих средних на разных таймфреймах и соотносит их с важными уровнями цены. Не перерисовывает стрелку, т.к. использует для расчета фиксированное количество исторических данных.
Пример работы индикатора приведен на скриншотах.
Лучше работает на трендовых участках рынка и показывает подтвержденное изменение направления цены. Не требует оптимизации.

The IndicateMe indicator has been specially created to remove as much noise as possible from the signals it gives. The indicator has been combined with several other well-known indicators. Indicators that have been used: "Moving average, stocastic indicator, relative strenght index, moving".
All indicators that are used can be adjusted by yourself. The default settings are set to the values I like to use. Easily set alerts to always stay informed of the indicator's signals.
Important: this
Trading in the direction of a strong trend reduces risk and increases profit potential. In general the average directional index (ADX) is used to determine when the price is trending strongly. In many cases, it is the ultimate trend indicator! After all, the trend may be your friend, but it sure helps to know who your friends are.
ADX is used to quantify trend strength. ADX calculations are based on a moving average of price range expansion over a given period of time. The default setting is
The LordAdvancedPivot Indicator is an indicator for META TRADER 4, with the function of analyzing the main daily channels of the currency pair, known as RESISTANCE, SUPPORT and PIVOT (center), to determine the levels at which market sentiment can change from "bullish" "to" low ".
Pivot points can be points that correspond to trend lines, Fibonacci levels, moving averages, previous highs / lows or closings and many more indicators, depending on the trader's philosophy.
LordAdvancedPivot has 7
Il MetaTrader Market è l'unico negozio online dove è possibile scaricare la versione demo gratuita di un robot di trading che consente di effettuare test e ottimizzazioni utilizzando dati statistici.
Leggi la descrizione dell'applicazione e le recensioni di altri clienti, scaricala direttamente sul tuo terminale e prova un robot di trading prima di acquistarlo. Solo sul MetaTrader Market è possibile testare un'applicazione in modo assolutamente gratuito.

Ti stai perdendo delle opportunità di trading:
- App di trading gratuite
- Oltre 8.000 segnali per il copy trading
- Notizie economiche per esplorare i mercati finanziari
Registrazione
Accedi
Accetti la politica del sito e le condizioni d’uso
Se non hai un account, registrati