Guarda i video tutorial del Market su YouTube
Come acquistare un Robot di Trading o un indicatore
Esegui il tuo EA
hosting virtuale
hosting virtuale
Prova un indicatore/robot di trading prima di acquistarlo
Vuoi guadagnare nel Market?
Come presentare un prodotto per venderlo con successo
Indicatori tecnici per MetaTrader 4 - 114
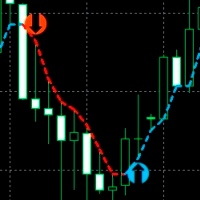
An indicator for accurately determining price reversal points on all timeframes and all currency pairs. With the help of technical analysis of the market and mathematical diagnostic models, this indicator determines the price reversal points and the current trend direction with great efficiency. The indicator displays this information on the chart in the form of arrows and lines. The arrows show the trend reversal points and the lines show the current trend direction. INDICATOR trades in real ti
This indicator is based on the same famous fractal indicator with a slight difference:
MetaTrader version 5 click here
Advantages:
Works on all instruments and time series,
Does not redraw its results,
Comparison depth is adjustable,
Works well with any popular strategy,
Adjust the power of fractals
Input settings:
Number of comparisons - The number of candles that each side selects for comparison.
Marker distance from the candlestick
You can contact u
This indicator is based on ParabolicSAR. This indicator does not change the trend easily and does not change the trend until it receives a clause and approval. This indicator can be used for trail stop or trend detection.
MT5 Version
benefits:
Works on all instruments and time series,
Does not redraw its results,
Comparison depth is adjustable,
Works well with any popular strategy,
The power of the areas is adjustable,
We assure you that we welcome any
The Market Sessions Indicator for MT5 helps you predict market turnarounds by detecting major supply and demand areas. These pivot points tend to occur after a new session has started and the previous one is still open. It is also used to gauge how many points or pips the market moves on average during a session. This helps us to place better our take profits and stop losses. The indicator works on all forex pairs, gold, silver, commodities, stocks, indices and any other instrument that you

The Market Sessions Indicator for MT5 helps you predict market turnarounds by detecting major supply and demand areas. These pivot points tend to occur after a new session has started and the previous one is still open. It is also used to gauge how many points or pips the market moves on average during a session. This helps us to place better our take profits and stop losses. The indicator works on all forex pairs, gold, silver, commodities, stocks, indices and any other instrument that your

The Stochastic Dashboard is multi currencies and multi timeframes dashboards. It shows the Stochastic direction for the chosen pairs/timeframes. For the Stochastic lovers and manual trader this indicator is a most indicator which can be used to determine the market direction for the pair(s) you are trading. Set it to one chart only and monitor from one place all the charts you want.

Price pivot point indicator. The indicator shows with points on the chart the places where the price can turn in the opposite direction. When the indicator draws a red dot, it means that the price can turn its movement down. When the indicator draws a blue dot, then the price can turn its move up. This indicator can be used for both manual trading and automated trading by integrating it into your robot. To do this, the indicator has data exchange buffers.
Recommended currency pairs: XAUUSD EUR
PAX Simple Trend Signals for MT4
Самый простой и лёгкий в работе индикатор для торговли по сигналам разворота тренда. Зелёными и красными линиями на ценовом графике отображаются направления тренда — растущий и падающий соответственно. Стрелка вначале линии тренда сигнализирует о развороте тренда.
Если на трендовой линии появилась стрелка такого же цвета — это сигнал на открытие нового ордера. Если на трендовой линии появилась стрелка противоположного цвета — это сигнал на закрытия всех ордеро

A professional trading indicator with double-entry options. Valuable Smooth Channel Lines on the separated window, Trend Lines both on the main window, and separated window and entry arrows. Good for trading scalping in the lower timeframes. Even also it can work and provide signals in the higher timeframes for longer-term trading periods. INDICATOR SETTINGS: 1. Signal Mode. There are 2 options: Default and Compact. If Default, it will provide 3 different arrow codes on the main window. This o
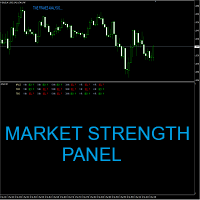
Apollo Market Strength Panel è un indicatore multi-timeframe che può essere utile per i trader di forex e opzioni binarie. Il pannello rappresenta le condizioni di mercato su diversi intervalli di tempo da M1 fino a H4. L'indicatore fornisce informazioni su tre importanti aspetti del mercato. Sono Tendenza, Forza e Impulso. Se tutti e 3 questi componenti si allineano, l'indicatore ti fornirà un segnale ACQUISTA o VENDITA a seconda della direzione del mercato. L'indicatore traccia i segnali diret
Advanced Trend System è un indicatore innovativo che utilizza un algoritmo proprietario che consente di trovare potenziali punti di inversione di tendenza con un'alta probabilità e ricevere segnali per entrare nel mercato all'inizio di una formazione di tendenza. L'indicatore seguirà le attuali condizioni di mercato e solo quando tutte le strategie interne saranno concordate e saranno in confluenza al 100% l'una con l'altra, l'indicatore fornirà un segnale di acquisto o vendita. L'indicatore è
MT5 Version A versatile tool
You do not need any other tools with this tool.
You can enable or disable all indicators.
Their values are adjustable.
In the first line you will see a summary of your account status.
p: The amount of your profit or loss
BP: The amount of your daily profit based on the balance
EP: Equity daily earnings
WP: Your weekly profit
MP: Your monthly profit
The next line shows each of the time frames you selected.
Chikou: The Chikou process
KT: The trend of the K and T li

MetaBands uses powerful and unique algorithms to draw channels and detect trends so that it can provide traders with potential points for entering and exiting trades. It’s a channel indicator plus a powerful trend indicator. It includes different types of channels which can be merged to create new channels simply by using the input parameters. MetaBands uses all types of alerts to notify users about market events. Features Supports most of the channel algorithms Powerful trend detection algorith

Istogramma Ingressi Trend: Individua i Reversal e Ottimizza le Tue Entrate L' Istogramma Ingressi Trend è un potente indicatore di allarme progettato per aiutarti a rilevare quando un trend o un movimento di prezzo sta raggiungendo la fine del suo ciclo di vita ed è in procinto di invertirsi . Ti avverte quando la struttura del mercato sta cambiando, il che di solito accade quando è probabile che si verifichi un'inversione o un forte calo. Questo indicatore monitora meticolosamente i breakout e

Overview: With so much noise and distraction in the markets I wanted to create clarity for traders to have a simple, efficient, and fun trading experience. This is why I created Pipsurfer. Pipsurfer is an trend following indicator that visually shows you important Institutional Smart Money levels in the market and helps you to trace Market Structure in the markets. Most traders find it difficult to visually see trading elements such as trend, structure and momentum which are key for understandin

40% off. Original price: $50 Advanced Bollinger Bands Scanner is a multi symbol multi timeframe Bollinger bands dashboard that monitors and analyzes the Bollinger Bands indicator from one chart. This panel monitors the Bollinger bands indicator in up to 28 configurable instruments and 9 timeframes for price overbought/oversold, price consolidation (Bollinger bands squeeze), and consolidation breakout (squeeze break) with a deep scan feature to scan all market watch symbols (up to 1000 instrume

Indicatore ciclico per il trading e la previsione della direzione del mercato. Mostra il comportamento ciclico del prezzo sotto forma di oscillatore.
Fornisce segnali per l'apertura delle operazioni quando c'è un rimbalzo dai limiti superiore e inferiore dell'oscillatore. Sotto forma di istogramma, mostra la forza attenuata del trend.
Completerà qualsiasi strategia di trading, dallo scalping all'intraday. L'indicatore non viene ridisegnato. Adatto per l'uso su tutti i simboli/strumenti. Gli

Master Point is an indicator set that includes the most powerful and necessary tools for a trader, giving that very edge in the markets to be successful. An indicator that has an elegant and complete system that works very well in all markets (Forex, Crypto, Stocks, Indices) helps to find the best reversal points. It has tools such as trend reversal detection, pivot points, divergences, currency strength and 'candle strength'. All this makes the indicator a complete tool that does not require a
Apollo Binary Options Indicator è un indicatore di segnale per il trading di opzioni binarie. Il segnale arriva all'apertura della candela corrente ed è valido fino alla sua chiusura. Il segnale è accompagnato da una freccia e da un messaggio di segnalazione direttamente sulla tua carta. Il tempo di scadenza dell'opzione consigliato è di una candela. Cioè, se il grafico è H1, il tempo di scadenza sarà di 1 ora. Se il grafico è M5, il tempo di scadenza dell'opzione sarà di 5 minuti. Ma in effetti

Horizontal tick volumes (HTV) Horizontal tick volumes - an easy and convenient indicator of a horizontal market profile in a user-selected time. Produces a visual image of strong trading levels by maximum peaks past volumes and trading direction by color (sell or buy), and also allows you to detect smaller trading levels by differentiating past volumes. In the "Optimal" mode, when displayed on chart periods up to and including "M30", the data of one-minute bars are used, on H1 and H4 - five-minu

Всем привет. Представляю Вашему вниманию Индикатор TRUE ATR для mt4 Так же есть данный индикатор для mt5 https://www.mql5.com/ru/market/product/82319 Данный индикатор работает на всех рынках. TRUE ATR высчитывает среднестатистическое движение инструмента за 1 день и показывает сколько в инструменте осталось энергии внутри дня. В отличие от классического индикатора АТР которые без разбора учитывает все бары(свечи), TRUE ATR при расчете среднестатистического движения инструмента исполь

IGRIDCOIN.COM PRESENT SIGNALS FROM THE OUTER LIMITS! IgridCoin Space Signals is a unique 4 in 1 reversal trend indentation bot 100% non-repainting multi-timeframe indicator that can be used on all symbols/instruments: forex, commodities, cryptocurrencies, indices, stocks. “Igrid space signals” it will determine the current trend and at what point a reverse will happen at its early stages, gathering information and data from up to 4 special indicators, which are: Average Directional Movement Ind

PROFITABLE TRADER is an interesting name for this indicator... And all because it is for a true trader who values his time. It has a built-in Alert and parameters that will make your work easier. Open settings will allow you to set the indicator to any cryptocurrency or just currency. It's better to test and then draw a conclusion .. screenshots will show everything.. good bidding my friend.

This indicator is named so for a reason, because it will show the reverse side of the market.
It has several math indicators built in that are tuned to show the best signals for currency pairs!
Ideally proved to be in work on the M5-M15 no more and no less!
Only at the same time it shows up to 86.5% of correct signals!
The settings include the colors of the arrows, the alert, and the same parameters so that you can reconfigure the indicator and trade on cryptocurrency and raw materials!
If

An excellent indicator for those who like fast binary options trading!
It works great on m1-m5 timeframes!
The periods are customizable, so you can even set up for cryptocurrency, and trade on weekends!
You can also customize the color of the arrows!
Works on all timeframes!
But as stated above, it's better on m1 - m5!
Whatever you forget about the signal, it has an alert!
Test and try this indicator! If I have questions write, I will gladly listen to suggestions and errors!

L'indicatore Promining Trade Signal completerà qualsiasi strategia e può anche essere utilizzato come strumento indipendente. Benefici Tempo consigliato M30 Facile da usare; non sovraccarica la grafica con informazioni non necessarie. La possibilità di utilizzare come filtro per qualsiasi strategia. L'indicatore non cambia colore dopo la chiusura della candela. Funziona su azioni, indici, petrolio, oro e su tutti i tempi. Ha la funzione di notifiche push e avvisi sonori. Avviso - abilita/disabil

Hello, traders! Welcome to the introduction of Market Meeter ( MT4 )
This is the Meta Trader 4 version of the "Multi Timeframe Analyzer". Click here to Get MT5 version <<---
What is this indicator? Simply put, this indicator analyzes the market across eight different timeframes , from lower to higher, and predicts the next price direction along with an estimated continuation time. It does this by using volume, volatility, and price patterns in its calculations. Let's dive

Pipsurfer Dashboard is a multi-currency multi-timeframe dashboard designed to alert you to where the action is happening in the forex markets. The software trades a trend based price action and market structure strategy. Assets Supported: All Forex Metals Indices Major Crypto
Major Input Settings: Timeframe Filters - Choose which timeframe you want the Pipsurfer Dashboard to signal you on. Pair Selection - Choose To Follow All Major Pairs And Crosses or have a custom list of your choice Alert

" Scalping saham " is a unique, turnkey scalping trading system. It shows the trader when and where to open and close trades. Scalping trading is one of the most effective, but at the same time, the most complex trading systems. Therefore, if you don’t have your own strategy yet, you’d better take a ready-made scalping strategy and work with it. The scalping strategy of this indicator is to determine the direction of the trend with high accuracy, then determine the price reversal points and giv
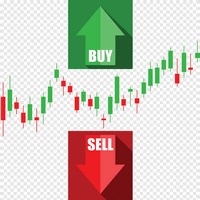
Questo indicatore utilizza massimi e minimi locali delle serie di prezzi. Dopo aver evidenziato gli estremi, i loro valori vengono smussati. Grazie a ciò, vengono costruiti due canali: esterno e interno. Il canale interno mostra i limiti se il movimento del prezzo segue rigorosamente un andamento lineare. Il canale esterno mostra i confini per il movimento dei prezzi con un andamento logaritmico. Dopo aver calcolato i canali, l'indicatore analizza il movimento del prezzo reale e offre consigli

L'indicatore TickCounter conta i tick avanti e indietro su ogni nuova barra.
Il calcolo inizia dal momento in cui l'indicatore viene posizionato sul grafico.
Le barre dell'istogramma rappresentano: Barre gialle - numero totale di tick; Barre blu - tick UP; Barre rosse - segni di spunta GIÙ. Se la barra blu non è visibile, ci sono più segni di spunta verso il basso e la barra rossa viene visualizzata sopra quella blu (il livello rosso è sopra quello blu). MT5 version: https://www.mql5.com/en/
SL Curruncy impulse flow of this intraday Asian London New York Sessions strength.SL Curruncy impulse indicator best for intraday scalper. market powerful move time you can catch best symbol. because you'll know which currencies are best to trade at that moment. Buy strong currencies and sell weak currencies Suggested timeframes to trading : M1 - M5 - M15 - M30 -H1 You can however just change SL Curruncy impulse to check in the settings. Bear in mind that scanning very low timeframes. How d

Inficator MT4 : HiLo Objective : Find Support and Resistance zone
How to set up Indicator HiLo : 1. Indicators type multi time frame are MN1 W1 D1 H4. 2. Customize for use MN1 only or W1 only or D1 only or H4 only or open all. 3. We use MN1 and W1 for set to Key level. 4. For Close price or Open price to high price set for Resistance zone. 5. For Close price or Open price to Low price set for Support zone.
How to trade for success : Entry point : Buy / Long position 1. Price bid hit the f

Indicator MT4 : RSI MA is Moving average of strength index
Objective : Find entry price for the good trade
How to set up indicators RSI MA : 1. RSI period 14. 2. MA you can set calculate price and method price. 3. MA period 9. 4. Arrow setting : 6 types. 5. Alert setting : Next bar or Instant bar. 6. Choose display for 1 or 2 calculation by formula.
How to trade for success : Entry point : Buy / Long position 1. When arrow up direction show 2. TP : RSI OVB
Entry point : Sell / Short position

The Chop Exploder indicator is a custom indicator that has a long run, tight chop, short chop, and band colour. This indicator has MT4 alert notification,mobile notification, and email notification. The default indexing of all arrays and indicator buffers is left to right. The index of the first element is always equal to zero. Thus, the very first element of an array or indicator buffer with index 0 is by default on the extreme left position, while the last element is on the extreme right posit

Good dial indicator "Pigment"
Pointer indicator "Pigment"
This product is great for binary options.
Showed itself well on M5 M15 timeframes.
Multicurrency also works well in news releases.
Does not draw and the signal appears on the current candle
Blue arrow buy
red arrow sell
You can also set the signal frequency to your liking:
In the settings, simply change the Period, the default is Period 3.
The R[2] Forex Indicator is a complete Forex Trading System working on major forex pairs on 15 Minutes time frame, and it draws: Low Dot / High Dot to spot potential turning points Buy Arrows and Sell Arrows to help you enter the trades with the perfect timing A two colors dotted line to show the trend in action and the target for reversal signals
I invite you to watch my Videos on YouTube where I show the R[2] Strategy and how I personally trade with it, and als
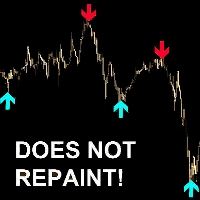
"Avadhut sathe" is an indicator for scalping. Shows the trader with arrows on the chart the price reversal points. Best of all "Avadhut sathe" trades on M1, M5, M15 timeframes. Recommended currency pairs: GBPUSD, EURUSD, GOLD, SILVER, BTCUSD, AUDUSD, USDJPY, EURJPY, USDCHF, USDCAD, EURCHF. The "Avadhut sathe" indicator has many modes of operation, on which the accuracy of the signals depends. In most modes, the "Avadhut sathe" indicator does not redraw its signals. The "Avadhut sathe" indicator
The R[2] Gold Indicator is a complete Trading System working on GOLD (XAUUSD) on 5 Minutes time frame, and it draws: Low Dot / High Dot to spot potential turning points Buy Arrows and Sell Arrows to help you enter the trades with the perfect timing A two colors dotted line to show the trend in action and the target for reversal signals
I invite you to watch my Videos on YouTube where I show the R[2] Strategy and how I personally trade with it, and also to join my
MOVING AVERAGE ON OFF BUTTON as the name suggest you can disappear and reappear up to 5 moving average with a single click. This can save a lot of time and energy for the traders. you can change the color, period and shift of the moving average as you wish you can move the on off button where ever you want you can also change to simple moving average, exponential moving average and much more types of moving averages to know more about the the indicator and how to use it watch the video linked b
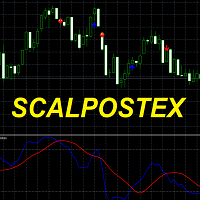
Scalpostex is a ready-made trading system that shows the trader the points and directions for opening orders. The trading system consists of 17 market analysis modules. Scalpostex analyzes the market using indicators, candlestick patterns and resistance/support lines. Using the method of complex market analysis, this indicator is able to predict price movements with high accuracy. How to trade with this indicator (recommendations): We recommend opening trades in the direction of the arrow that
The Price Elevator indicator is developed to help you figure out the general long-term trend of the market. If the price is above the Green separator line, this is a clear indication the bulls are in control. Similarly, the bears are in control if the price continues to trend below the red separator line. Download Price Elevator MT5
Trend Re-entry In this case you would plan your buy entries above the green dotted box (make sure to set the Buy / Sell Retracement Floor=30). The SL should be
For more tools https://www.mql5.com/en/users/mbedzimz1/seller#!category=2
A huge number of traders use the VolumeProfile/MarketProfile analysis method. And I think there is no need to explain such concepts as POC and VAH/VAL. However, the standard VolumeProfile representation has a drawback - we only see the current picture of the market. We see the "convexity" of the volume distribution within the period. But we don't see the main thing - the "migration" of the POC level during the price

Scalping Points XL is a scalping indicator from the "Scalping Points" series. This indicator is designed to show the trader the price reversal points. The indicator has many settings and different modes of operation. Does not redraw its values. Depending on the setting mode, it can draw signals both at the very beginning of the appearance of a candlestick and at its close. The principle of operation of this indicator is to analyze the market for volatile price changes and show the trader signal

Questo indicatore utilizza i cosiddetti numeri "malvagi" come coefficienti di peso. Il loro opposto sono i numeri "odiosi", presentati anche in questo indicatore. La divisione dei numeri in queste due classi è associata al peso di Hamming, che è determinato dal numero di unità nella notazione binaria di un determinato numero. Utilizzando questi numeri come fattori di ponderazione si ottiene un indicatore di tendenza. Inoltre, i numeri odiosi forniscono un indicatore più sensibile e i numeri mal
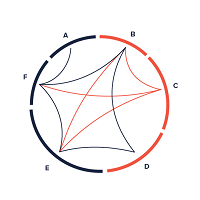
You can use the indicator as the main one to determine the trend. The indicator can work both for entry points and The Chord Trend indicator works well on longer trend sections. In flat it is recommended to use filters of your choice. It can accompany the position with a stop, it is recommended to set the stop at a fixed distance from the point formed by the indicator. If you combine the use of the indicator as an input and accompanying a position, then to accompany the stop it is necessary tha
The indicator uses its own market analysis algorithm that recursively goes through bar-level price movement information such as open, close and shadow prices. With this indicator, you can find the most likely trend reversal points. A simple but effective system for determining the forex trend. From the screenshots you can see for yourself the accuracy of this tool. Works on all currency pairs (cryptocurrencies, raw materials, stocks). The alert system (alert, email notifications) will help you

The purpose of the inidcator is to identify the reversal point.
The blue arrow is buy signal and the yellow star is its stop loss. The red arrow is sell signal and the yellow star is its stop loss. Alert feature: if there is a signal, the indicator will send alerts of popup window,email or mobile push. Inputs: Popup Window Alert: it is false in default Email Alert : it is false in default Mobile Push Alert: it is false in default. MetaTrader 5 Version: Reversal Point Please note that the singal

Progettato per essere utilizzato da solo, non sono necessari altri indicatori. Un grafico specifico mostra il profitto e l'eventuale drawdown in base ai dati storici.
Come funziona Scalper Pro Line utilizza un indicatore di tendenza interno combinato con un sistema di azione sui prezzi. All'avvio, il sistema sta analizzando le prime 10000 barre della cronologia per trovare le impostazioni migliori. Quindi queste impostazioni vengono applicate all'intera cronologia e utilizzate in tempo reale;
Built-in RSI indicator has an error in the algorithm. I spotted the error while working on a modified RSI where i needed the original algorithm with special input I started with the official formula and were having different curves from the built-in indicator. after thinking I had made a mistake in the algorithm, I realized the orginal indicator is wrong by looking at the code.
So here is the real RSI, computed from the original formula, so you know it's the real indicator.
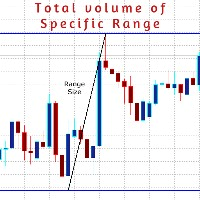
AboaishaRV_Calculator is an info indicator.
It manages to calculate the range and total volume between any 2 points on the chart.
To use it just install the indicator and draw a trend line between point X and point Y and it will show you the difference in the price and the total volume traded inside this range. Indicator inputs: DataColor >> the color of the info range size and volume size of the range. LinesColor >> the color of the range border lines if they are used. FontSize LinesWidth Range

" MACD crossover " is a new version of the oscillator indicator. " MACD crossover " draws a red or blue line on the chart. When the line is blue, it means that the MACD indicator is above zero. If the line on the chart is red, it means that the MACD indicator is below zero. Thus, this indicator helps traders determine the MACD position visually on the chart. This information will be especially useful when trading scalping. You can combine this indicator and trend indicators on the chart. If thi

"Bitcoin indicator" is a ready-made mechanical trading system for Bitcoin. The system is implemented as an indicator that shows the trader on the chart the price reversal points and the current trend direction. This information is enough to effectively trade in the market. The "Bitcoin indicator" consists of a complex analytical block that constantly analyzes the market and shows the trader where the trend is heading. The indicator also shows with dots on the chart, the price reversal points. S
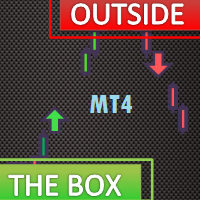
The Outside The Box (OTB) is a complete trading system that provides the user with immense trading ability by highlighting on the chart areas where the trader should prepare to Re-enter the trend after pullbacks (Pullback trading strategy) Take partial/complete profit(Profit taking strategy), and Trade breakouts (Stock breakout strategy) - We have updated the indicator to show/hide Micro breakout areas around the major breakouts (Micro Breakouts). The above is supported by an alert system
Этот индикатор - очередная разновидность ЗигЗага, за исключением, он не рисует текущую линию, которая может перерисоваться.
Этот индикатор, если нарисовал конечную точку, по закрытому бару, то больше ее не изменяет - это означает смену направления и следующая точка будет другого цвета. Может быть применен как для определения основного движения, при использовании увеличенных параметров, так и непосредственно для входа с минимальным риском.Очень хорошо показывает все волны. Работает с любым инстру

Early Trends finds trends early, when price is still squeezed inside price action, which is the best time to spot a trend. When the price action makes higher highs or lower lows within the first bars back, while no HH or LL has been triggered on higher period bars back, then a trend is potentially beginning You can also take signals only in the direction of the trend, with the trend filter.
Many parameters : Number of Bars Displayed Number of Bars Back HHLL Number of Bars Back Multiplier Period

Witch Hat for Binary Options is an indicator for binary options based on analysis of Bollinger Bands and RSI, using a modulated strategy with indicator settings using complex filters. This indicator never repaints, it has an almost accurate answer for you to make the entries.
There are two ways for you to analyze your entry, when an arrow appears you have more than 90% chance of hits, and the other way is the lines that it automatically draws and its trend line.
It has surprisingly strong sup

Hma Vvm Hull è un indicatore professionale per lavorare in qualsiasi mercato, è particolarmente efficace quando si fa trading di coppie di valute, mostra le prime tendenze per cambiare la tendenza. L'indicatore ha molte impostazioni che ti consentono di usarlo con successo con vari metodi di trading e strategie di trading. È possibile installare più indicatori con parametri diversi su un grafico. Una varietà di avvisi personalizzabili consente al trader di controllare sempre la situazione del m

Questo indicatore riceve i dati di tick dal terminale e quindi ne calcola la media con tre medie mobili. Questo ti permetterà di cogliere la tendenza anche all'interno della candela M1. I parametri di scorrimento possono essere regolati manualmente. È inoltre possibile specificare la profondità di disegno dell'indicatore.
Affinché l'indicatore inizi a funzionare, posizionalo sul grafico e lascialo funzionare per diversi minuti: per il normale funzionamento, è necessario raccogliere una serie d

The indicator automatically sets trendlines on the really important points directly on the chart. Timeframe, color and style of the lines can be adjusted. Notification of a breakout above or below the line via a smartphone is possible.
Input Parameters TimeFrame : Choose timeframe Formation : Choose swing, Shoulder head shoulder or long term formation Alerts : true = alert is on SendEmail : Send message to email address
SendNotifications : Send message to smartphone or tablet
AlertAtClose : A

"Strategia di trading scalping" - l'indicatore è stato creato per il trading utilizzando il sistema di scalping. "Strategia di trading Scalping" mostra sul grafico con una freccia dove andrà il prezzo ora. Dopo che l'indicatore ha disegnato una freccia, il prezzo andrà nella direzione della freccia di almeno 20 punti. Questo è sufficiente per fare trading in modo efficace. La "strategia di trading scalping" non ridisegna i suoi segnali. L'indicatore ha molte diverse modalità di funzionamento. P
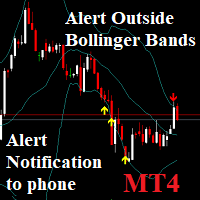
Notifications outside of Bollinger Bands: Send phone Notification and window alerts when price breaks out of Bollinger bands Low & High. You can set the value Alert, Notification. And On OFF Alert on Terminal, Notification on Smartphone. Notifications - Client Terminal Settings - MetaTrader 4 Help
How to Setup MT4/MT5 Mobile Alerts Right to Your Phone (forexschoolonline.com)
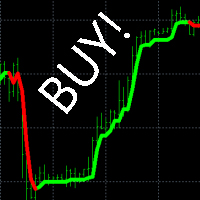
"Buy Sell Alert" - an indicator that shows the trader where the trend is going and when to open a deal. If the indicator draws a green line on the chart, we open a buy order. If the indicator draws a red line on the chart, we open a sell order.
Benefits of the indicator: latency percentage less than 3% signal accuracy over 96% does not redraw its values to build a trading strategy, it is enough to use this one indicator. very easy to set up works on all currency pairs and all times Description
Очень точный индикатор, с его помощью очень легко определять барные паттерны.
Это очередная разновидность ЗигЗага, за исключением, он не рисует текущую линию, которая может перерисоваться,если нарисовал конечную точку, по закрытому бару, то больше ее не изменяет - это означает смену направления и следующая точка будет другого цвета. Может быть применен как для определения основного движения, при использовании увеличенных параметров, так и непосредственно для входа с минимальным риском. Очень х
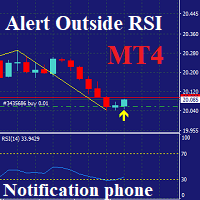
Notifications outside of RSI: only MT4 Send phone Notification and window alerts when price Over RSI: Default: Over Buy RSI=70 & Over Sell RSI=30. You can set the value Alert, Notification, Over Buy, Over Sell. And On OFF Alert on Terminal, Notification on Smartphone. Notifications - Client Terminal Settings - MetaTrader 4 Help
How to Setup MT4/MT5 Mobile Alerts Right to Your Phone (forexschoolonline.com)

L'indicatore traccia frecce verso l’alto e verso il basso su ogni oscillazione di prezzo rilevata dall’indicatore Zigzag classico. Quando Zigzag forma un nuovo minimo, viene visualizzata una freccia verde. Allo stesso modo, viene mostrata una freccia rossa quando Zigzag forma un nuovo massimo.
Caratteristiche
Rispetto allo ZigZag classico, segna i punti di swing in modo più efficace. Aiuta a identificare in anticipo i pattern grafici in formazione. Include uno scanner multi-timeframe che mostra

Questo indicatore mostra il regime rialzista/ribassista del mercato utilizzando il numero di barre che si muovono sopra e sotto le zone di ipercomprato/ipersurvenduto dell'RSI. L'istogramma verde rappresenta la forza dei rialzisti, mentre quello rosso rappresenta la forza dei ribassisti.
Caratteristiche
Può essere utilizzato per aprire nuove operazioni o per confermare operazioni basate su altre strategie o indicatori. Include uno scanner multi-timeframe che analizza la forza dei rialzisti e de
The indicator measures the buying and selling force between the buyers and sellers in the form of a histogram/oscillator by using a BOP equation:
BOP = Moving Average of [close – open)/(high – low)]
Igor Levshin first introduced the Balance of power in the August 2001 issue of Technical Analysis of Stocks & Commodities magazine.
Features
Quickly find the buying and selling pressure among the traders. It comes with simple inputs and an interface. All Metatrader alerts included.
Applications
SSL è l'acronimo di Semaphore Signal Level. È composto da due medie mobili applicate rispettivamente ai massimi e ai minimi delle candele, formando un canale che segue l'andamento del prezzo. Segnale di acquisto: Quando il prezzo chiude al di sopra della media mobile superiore. Segnale di vendita: Quando il prezzo chiude al di sotto della media mobile inferiore.
Caratteristiche Include uno scanner multi-timeframe che rileva nuovi segnali su tutti i timeframe. Implementazione semplice e diretta

Questa è una versione modificata e migliorata dell'HMA classico, sviluppato originariamente da Alan Hull nel 2005. Utilizza tre medie mobili ponderate per ridurre il ritardo tipico delle MA tradizionali. Entrata Long: Quando l'HMA cambia da rosso a blu con pendenza verso l'alto. Entrata Short: Quando l'HMA cambia da blu a rosso con pendenza verso il basso.
Caratteristiche Scanner multi-timeframe incluso per rilevare nuovi segnali su tutti i time frame. L'HMA riduce significativamente i ritard
Il MetaTrader Market è il posto migliore per vendere robot di trading e indicatori tecnici.
Basta solo sviluppare un'applicazione per la piattaforma MetaTrader con un design accattivante e una buona descrizione. Ti spiegheremo come pubblicare il tuo prodotto sul Market per metterlo a disposizione di milioni di utenti MetaTrader.
Ti stai perdendo delle opportunità di trading:
- App di trading gratuite
- Oltre 8.000 segnali per il copy trading
- Notizie economiche per esplorare i mercati finanziari
Registrazione
Accedi
Se non hai un account, registrati
Consenti l'uso dei cookie per accedere al sito MQL5.com.
Abilita le impostazioni necessarie nel browser, altrimenti non sarà possibile accedere.