Guarda come scaricare robot di trading gratuitamente
Ci trovi su Twitter!
Unisciti alla nostra fan page
Unisciti alla nostra fan page
Ti è piaciuto lo script? Provalo nel Terminale MetaTrader 5
- Visualizzazioni:
- 114
- Valutazioni:
- Pubblicato:
-
Hai bisogno di un robot o indicatore basato su questo codice? Ordinalo su Freelance Vai a Freelance
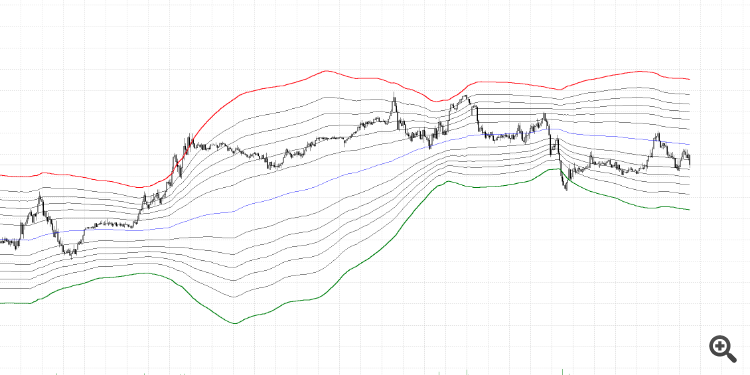
Questo indicatore Fibonacci Bollinger Bands è una conversione da Pine Script (di Rashad) al linguaggio MQL5. Combina la potenza delle Bande di Bollinger con i livelli di Fibonacci per aiutare i trader a identificare efficacemente le zone di supporto e resistenza dinamiche.
Caratteristiche:
Calcola automaticamente i livelli di Fibonacci sulle Bande di Bollinger.
Fornisce una prospettiva unica per le operazioni di breakout e inversione.
Completamente compatibile con MetaTrader 5.
Perfetto per i trader alla ricerca di strumenti di analisi tecnica avanzati. Scaricatelo e provatelo oggi stesso!
Ecco il codice dello script di pino:
study(shorttitle="FBB", title="Fibonacci Bollinger Bands", overlay=true)
length = input(200, minval=1)
src = input(hlc3, title="Source")
mult = input(3.0, minval=0.001, maxval=50)
basis = vwma(src, length)
dev = mult * stdev(src, length)
upper_1= basis + (0.236*dev)
upper_2= basis + (0.382*dev)
upper_3= basis + (0.5*dev)
upper_4= basis + (0.618*dev)
upper_5= basis + (0.764*dev)
upper_6= basis + (1*dev)
lower_1= basis - (0.236*dev)
lower_2= basis - (0.382*dev)
lower_3= basis - (0.5*dev)
lower_4= basis - (0.618*dev)
lower_5= basis - (0.764*dev)
lower_6= basis - (1*dev)
plot(basis, color=fuchsia, linewidth=2)
p1 = plot(upper_1, color=white, linewidth=1, title="0.236")
p2 = plot(upper_2, color=white, linewidth=1, title="0.382")
p3 = plot(upper_3, color=white, linewidth=1, title="0.5")
p4 = plot(upper_4, color=white, linewidth=1, title="0.618")
p5 = plot(upper_5, color=white, linewidth=1, title="0.764")
p6 = plot(upper_6, color=red, linewidth=2, title="1")
p13 = plot(lower_1, color=white, linewidth=1, title="0.236")
p14 = plot(lower_2, color=white, linewidth=1, title="0.382")
p15 = plot(lower_3, color=white, linewidth=1, title="0.5")
p16 = plot(lower_4, color=white, linewidth=1, title="0.618")
p17 = plot(lower_5, color=white, linewidth=1, title="0.764")
p18 = plot(lower_6, color=green, linewidth=2, title="1")
Tradotto dall’inglese da MetaQuotes Ltd.
Codice originale https://www.mql5.com/en/code/53959
 XRVI
XRVI
Indice di Vigore Relativo con algoritmi selezionabili di RVI e media delle linee di segnale.
 ExCandele2
L'indicatore ExCandles-v2 indica le combinazioni di candele con frecce sul grafico.
 CloseAgent
Strumento di chiusura ottimale con Bande di Bollinger e RSI.
 PowerTrend
Questo indicatore determina la potenza e la direzione del trend.
