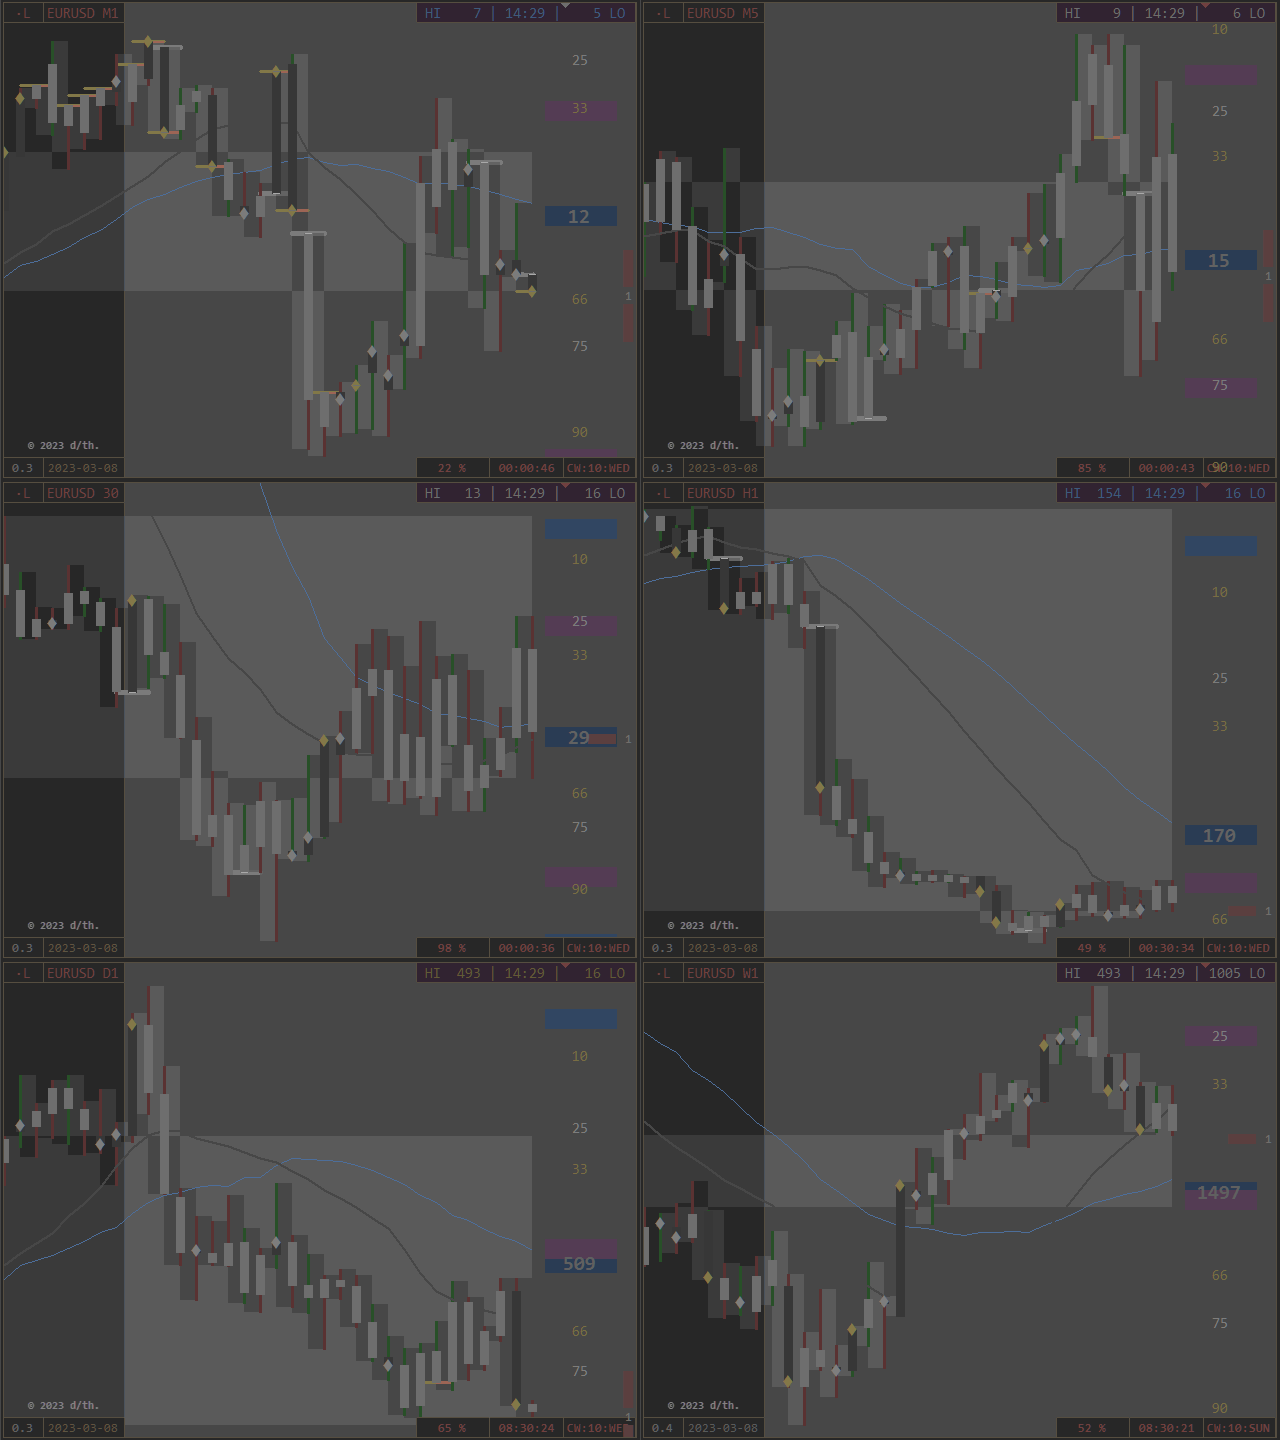
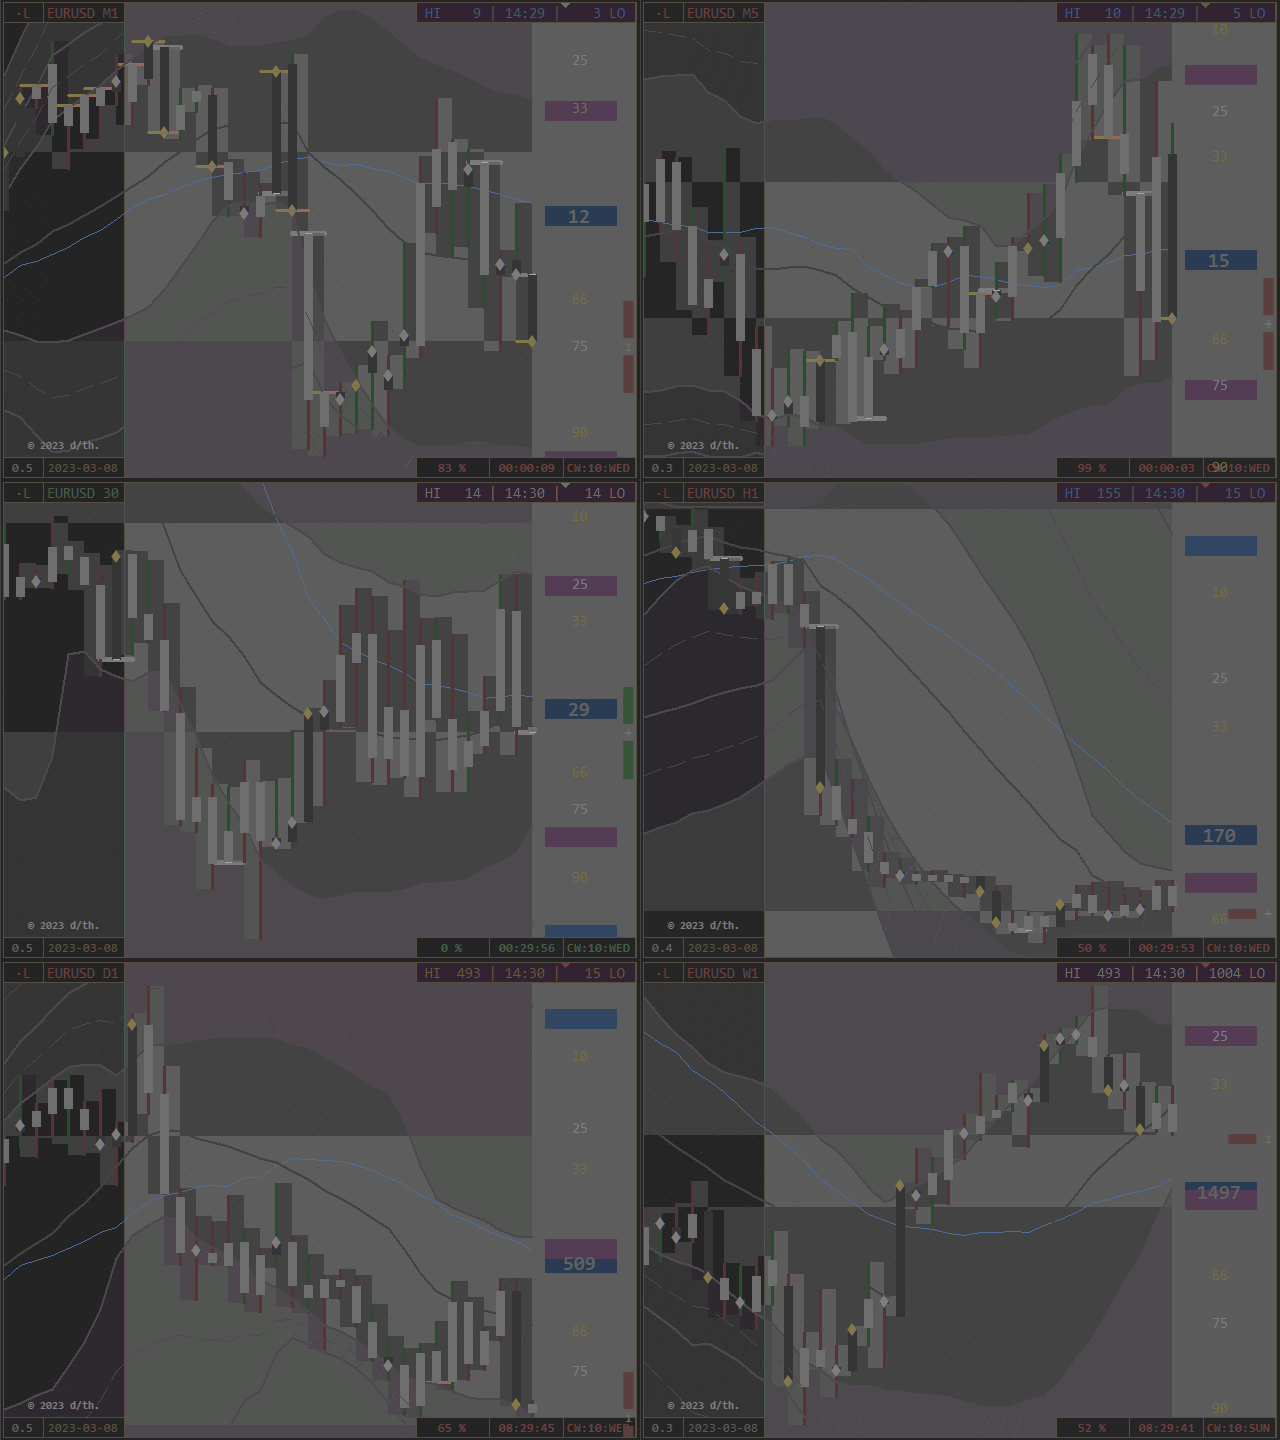
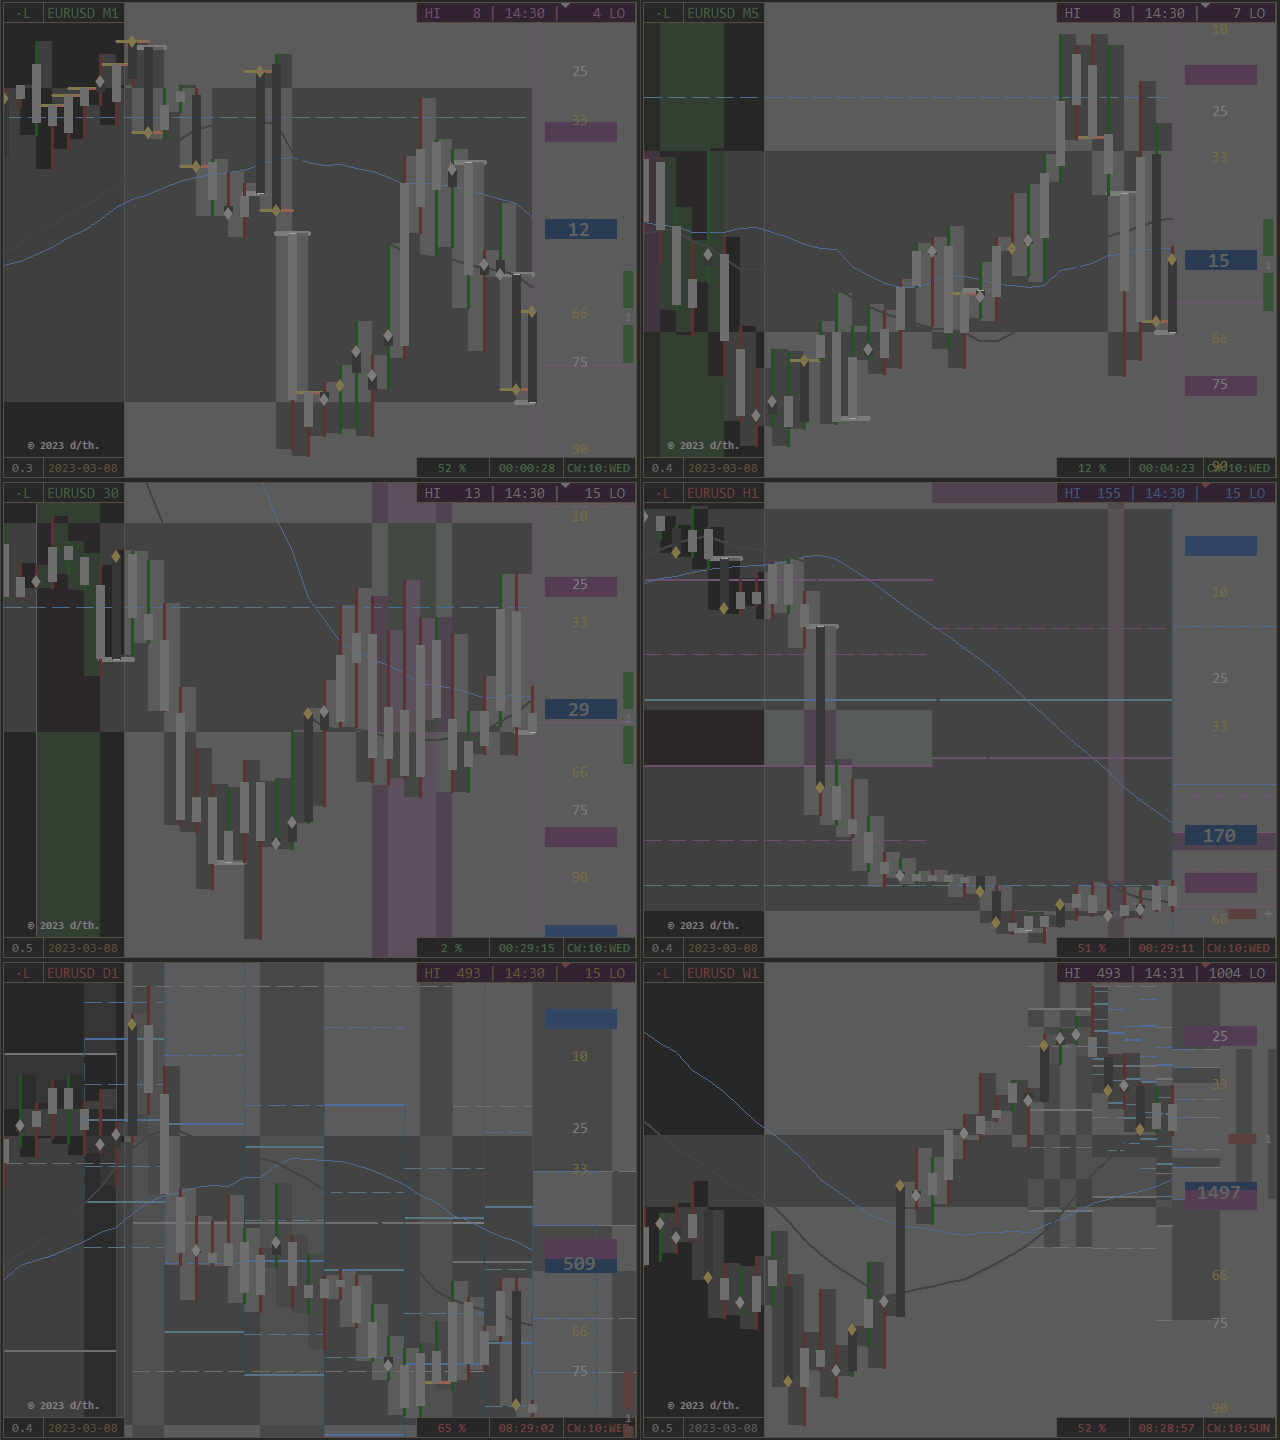
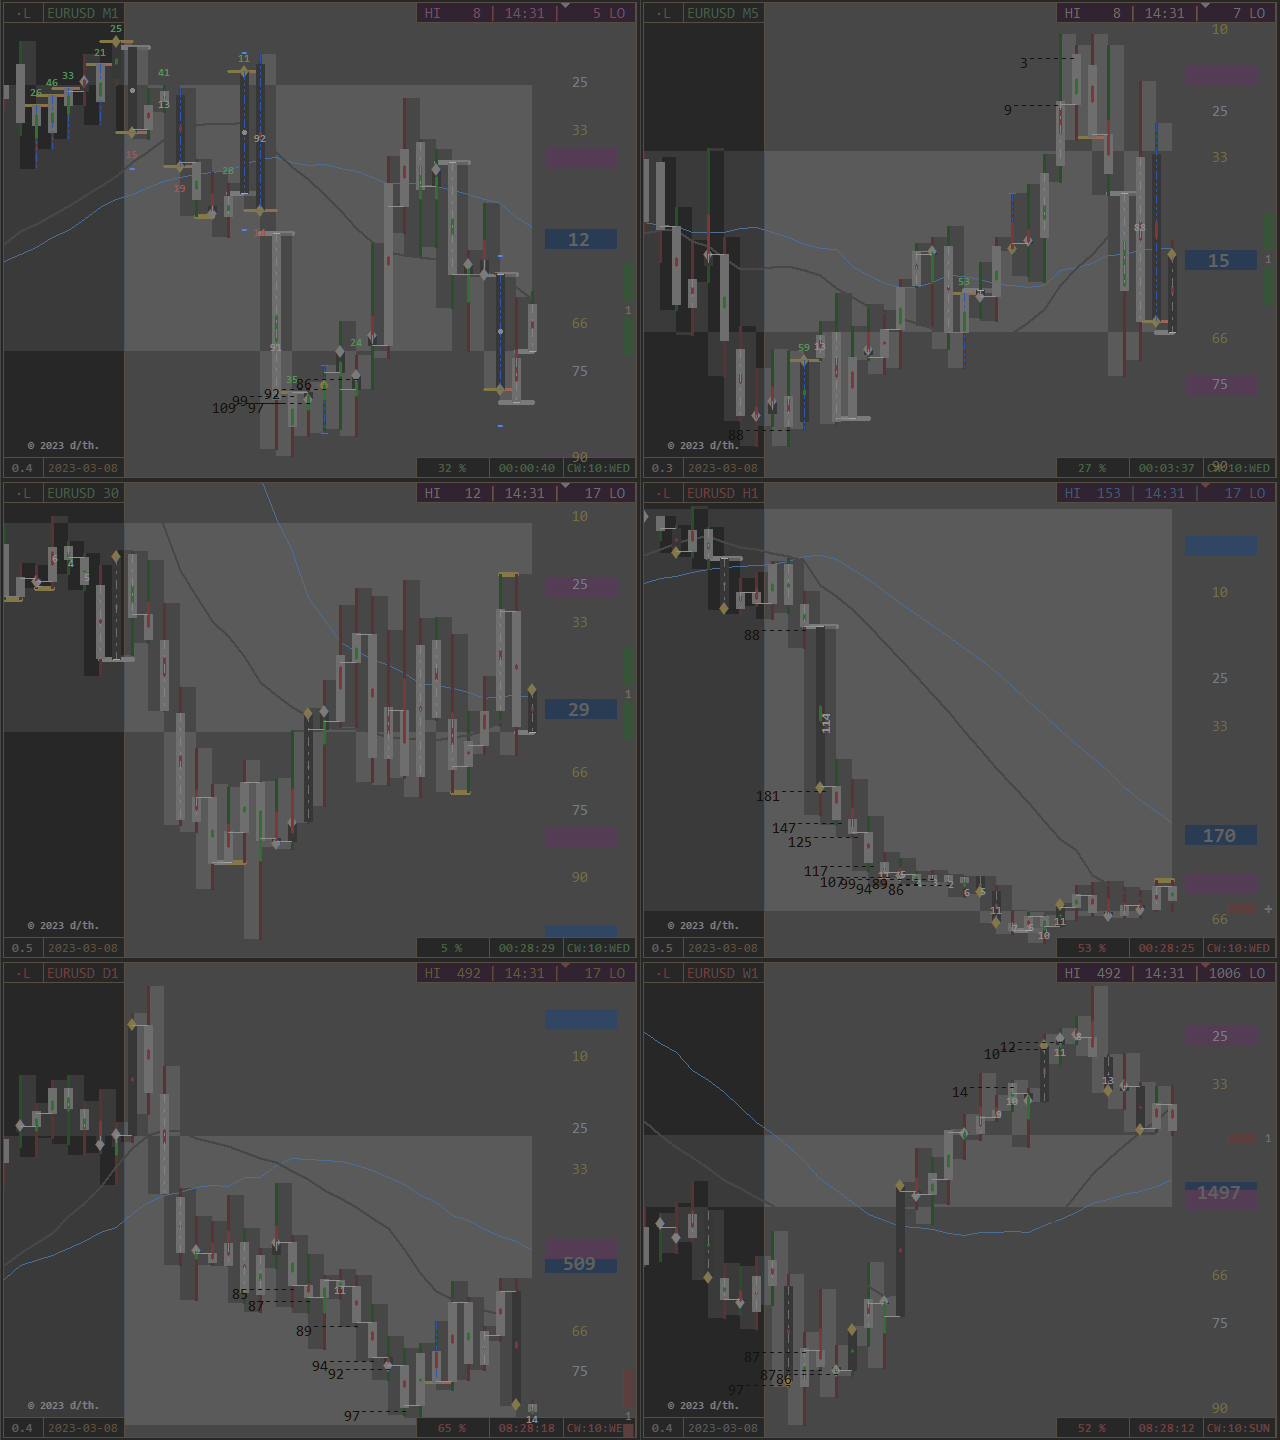
• Aperçu
  • Avis (2)
  • Commentaires
  • Nouveautés

PointZero

5

Concept

Market arranges in Time upcoming Phases according to the present Results of its Interest.

Directing Modulations are an Interaction of immanent Periods, which show in Reference

  • to Time cyclic Activity and
  • to Price leveling Activity.

PointZero is a projecting Price Mask of this Concept of Time and Price and

  • categorizing developed Price Movements related to their own Range: how far moved ?
  • indicating their Status by marking special Events: when which Action ?
  • setting the Situation in a functional Relation to the presented Support/ Resistance - Motive: miss/ hit/ pass ?


synthesize and project

Arrange with its underlying, grounding Components

  • Time Price Channel
  • Triple Pivot

and its conditional indicating Period Event Notation a situational Coordinate System.


Content

Time Price Channel

The D1/ W1/ MN - Channel consists of Shells around the ranging Center, which reflect the

periodic Alterations by its Separation in High-/Low-Bands and central Moving Averages.


Period Event Notation

Positions, Expansions and Distances are measured against the own Range,

as also against the Channelrange, of which a Period the Body and (Part of) the Move is.

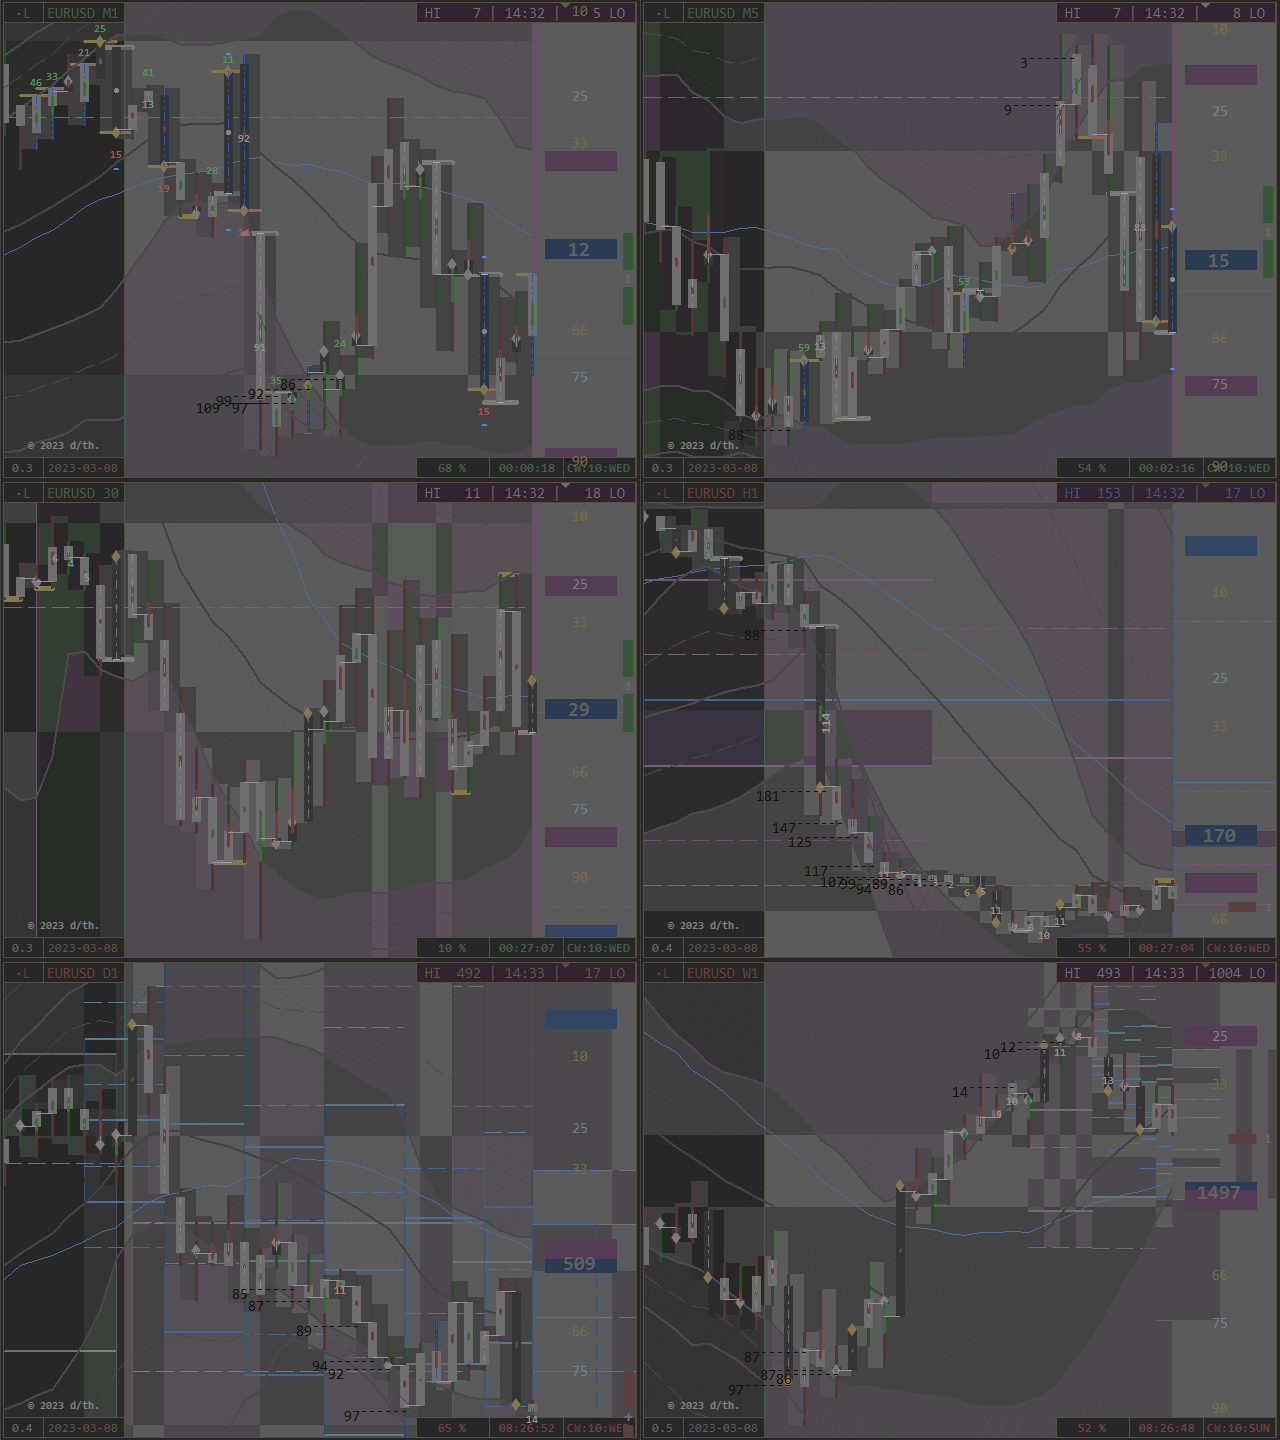
Special Events are displayed:

  • Close/ Open at High/ Low/ Center (colored Notes)
  • Break of weekly Channelbands (as Range Percentage)
  • Move 0 - 100 % of Range: Open to Close = High to Low (blue dotted Trend)
  • Move Proportions (white Values)
  • Offset of Move - Center against Range - Center (central Colortrend)
  • Parity of actual OHLC and previous OHLC (white Trend on Period and Offset Arrows on Scale)
  • Parity of up and down - Wick (blue Stars)
  • limiting Tick Values (Fraction Hits, green/ red)


Pivot Period Ports

D1/ W1/ MN - Pivots create besides their Portlevels a colored Background, indicating cyclic and leveling Phases.


Layers:

  • Projectors, Ranges and Scales (set PointZeros in Relation to their own and to the actual Channelrange)
  • Mirroring of Movements as Bars and Trendlines
  • Coloring of Bands/ Periods
  • Periods on/ off
  • geometrical Chartstructure with Universal Mask


Additional Benefits:

  • a positioning Autofocus
  • a Logbook as directional Protocol
  • a systemic Clock informs about periodic Phases (Pivot and Realtime)
  • a Screenshot Function (Button on Chart and as automatic Interval)
  • a detailed Definition of Objects and Functions by the Descriptive Mode (as Tool Tips)
  • an adjustable Price Column and automatic Chartfitting


Contemplate its Concentrate

The Signal Density is related to Markets actual Phase, chosen Timeframe/ Security and Components.

PointZero generates as resulting Composition a defined Setting of Support and Resistance:

No Matter which Hemisphere: [ Open = Support | Resistance = Close ]


Both look like the Other.

The MindMask resolves the active Status.


A Picture is worth a thousand Words.

Indicative : Colorized : Universal


Please find all necessary Informations to this Product in its Compendium.

Below as Orientation the Extract of the individual Indicator-Adjustments.


Indicator PointZero

Think global - Act local


[VALUE] =

  • Boolean: Button Position on Chart
  • Cn: Corner n0 to 3 (left upper to right lower)
  • Variabledefault Value


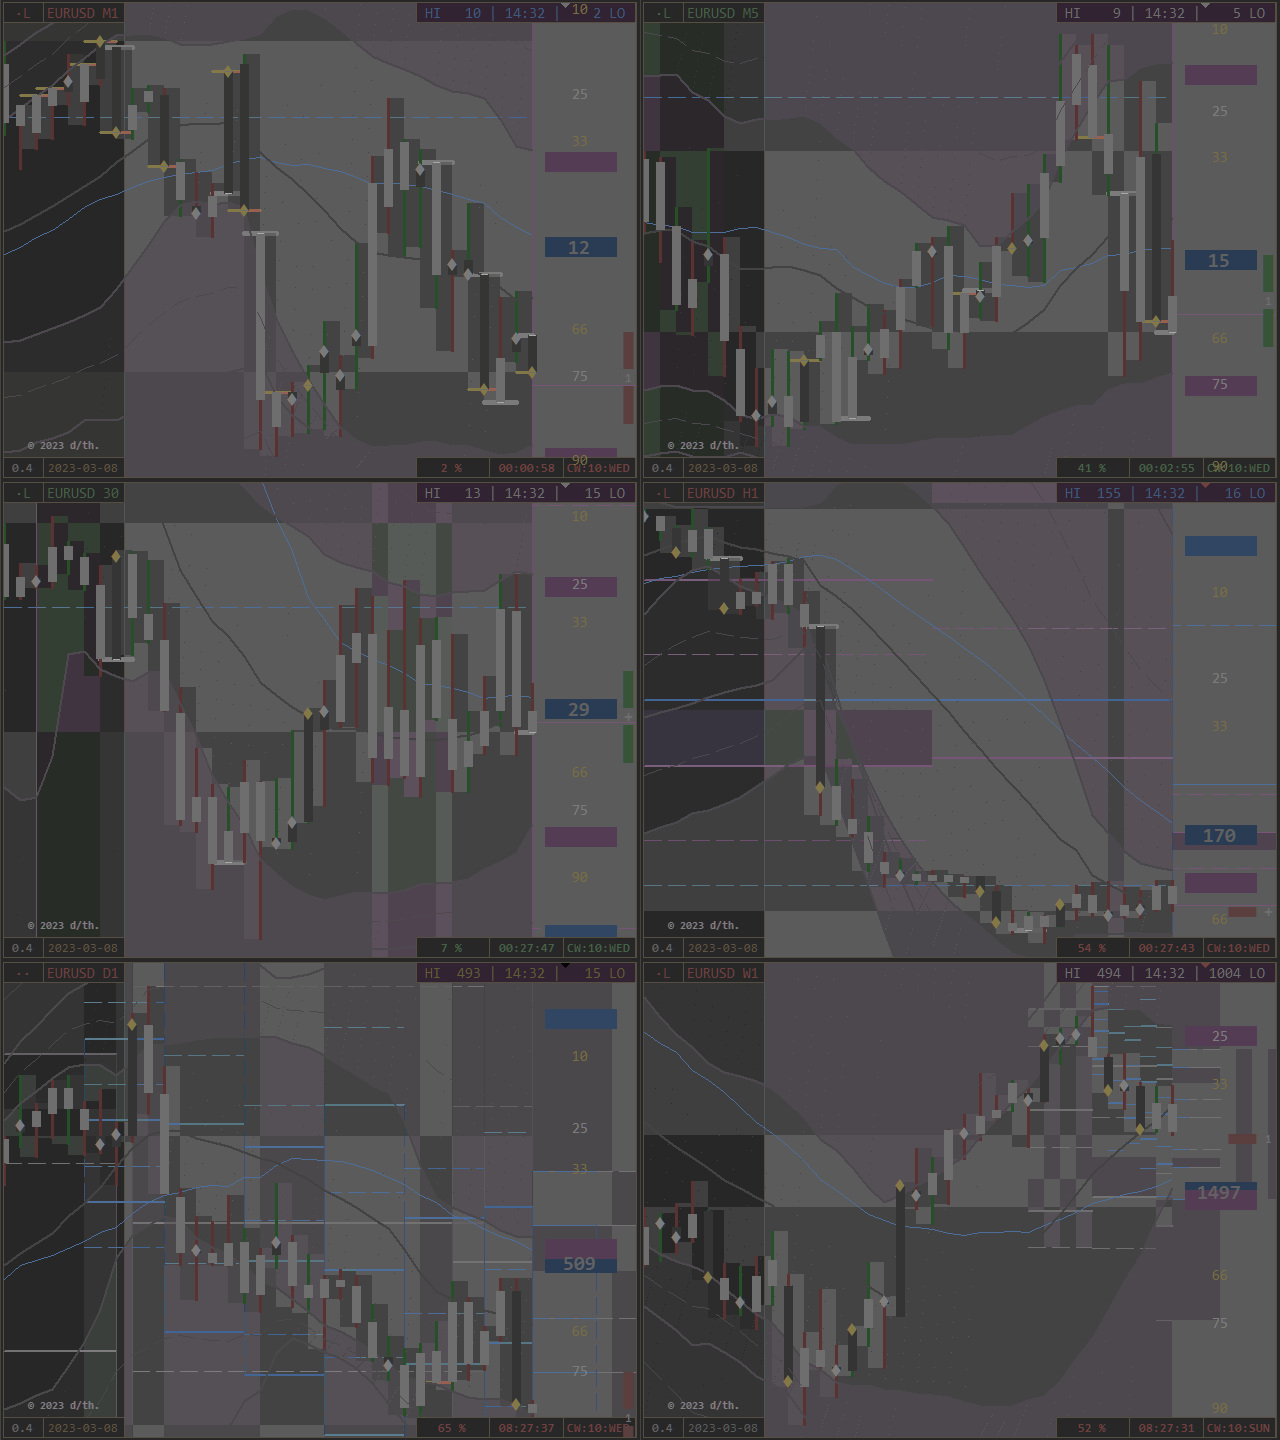
The default View of the Chart consists of following Components and is read like follows:

Move: Trace dark-gray/ Trend bright-gray

works as moving Range and ranging Move.

central MA: daily gray, weekly blue

Range Color by Open: Offset to prior Close/ Open/ Center (conditional)*

Note*: no separate Center-Color, the Open is passed by/of both Directions.

Close Color by Move: Offset to prior Open (= actual)

  • directional on: Null = white/ Full = orange
  • navigational off: up = green/ down = red
  • PointZeros off: noted by a white Haircross,

Toggle Close Signal via Countdown-Button.

Every Period works by its own Range-Shadow with the variable Chart-Coloring.

Identify their Phase by Coloring the Ranges with Button in Corner 3 most right (CW:WD)

Visual of centered Range-Creation and -Filling:
The Chart generates a (mostly central) gray Zone as Spread between

the highest Low and the lowest High of the visible Chart-Periods.


[5.1] Bools (on/ off) 

Code = Logic = Notation of Ordination


[5.1A] Fundament

Body of Chart


The first Options are the framing calculatoric Fundament of any Indicator Processing.

The visual Conjunction of both Mask-Complements delivers accidentially extra Room

for additional Buttons in the Sub-Chart, to have direct Access to these three Core-Options.

Bands and Pivots define the periodic Arrangement,

on which the Pen notes its designing Movements.

The Colors of Channel and Pivots cooperate = they are softened or amplified

and process accordingly to the Color Theory an indicating Background Tone.

The overlaying Period Event Notation is called by variable Conditions and

visualizes the Tracing/ Trending of Bull and Bear in their Habitates/ Hemispheres.


Time Price Channel [SUB]

To identify its Construction fully, colorize its dimmed Trendlines by Countdown-Button [C3]

(or preadjust via Colored Bands in Options).

  • hemispheric = 2 x 50% Coloring Ranges, depicted as colored Shells
  • gray D1, blue W1 Center = 0
  • Shells divided by Center-Trend
  • asymmetric Appearance due to separate Calculations 
  • of High and Low - Bands and central Moving Averages
    • Definition of Moving Average
    • variable Price Line 
    • Price of Time = external Argument
    • Definition of Channel-Band
    • constant Time Line 
    • (ime of Price = internal Argument

3-lettered Abbrevations on Price-Column:

  • Timeframe: MN = M, W1 = W, D1 = D
  • + Position HILO
  • e.g. WLO = Low of W1 - Channel (blue)


Period Event Notation [SUB]

special Contemplation of conditionally called absolute and/or relative Events:

  • Gator: 0-100 = Zero + Full Move
    • blue dashdot Centertrend on Period
    • notes new Phases (Caution)
  • Range/Move - High/Low (RH/ RL / MH / ML)
    • white move-connecting Trendline on Period
    • notes Stator/ Rotor - Function by Open Position of Period
  • Offset Move-Center against Range-Center 
    • colored Centertrend: green = North, red = South (directional)
    • notes potential/ tendencial Phase Shifts
  • periodic Centers in superordinated Range
    • white Value on Period if Close = 50% and < 15% or > 85% in D1-Range
    • notes near to Edge - Horizons in D1-Channel
  • Values beside Periods (connected with Dashes to Close)
    • if Close beyond W1 - Bands
    • note relative Barriers for overshooting Level-Phases
  • Tick Fraction Hits, as green and red Values
    • calculatoric Base is the Relation of Period Expansion and Volume
    • note expansional Edges of Time/ Price/ Tick
  • bright blue Double Points (Stars)
    • equivalent balanced/ central Position of Move in its Range
    • note Periods, which have an equal Size of their "Wicks"


Pivot Period Ports [SUB]

Enjoy freestyle Combinatory for 3 main + 1 sub Pivot ((MN/ W1/ D1) + H4).

universal Standard:

Pivots are processed Period-Gates and describe a superordinated Sequence of Market.
Equipped with cyclic and leveling Zones (colored Background), which note

  • by Time the first, central and last 10% of the Cycle Range 
  • (Visibility timeframe-dependent, adjust accordingly if necessary)
  • by Price the 66-75% of North and South Level-Range 
  • (Visibility chartscale-dependent, use implemented Autofocus if needed)
3-lettered Abbrevations on Price-Column:
  • Timeframe: MN = M, W1 = W, D1 = D, (H4 = H)
  • + Direction (N, S)
  • + Level (1, 2, 3)
  • or Pivot (PP)
  • e.g. MN1 = Monthly Pivot (white) Level 1 in Northern Hemisphere
Due to the inequal Hours of a Real-Time Week related to respective Weekdays

(last two Hours of Friday are processed on Sunday)

  • additional and isolated Sunday-Pivot.


Functions

Being develops from Within.

Equal Interest is generic.


The next five Options are Instruments for an extended Chart-Appearance and flexible Functionality:

[PRICE] Auto Focus:

Visual Flexibility, automatic

  • toggle by Click on the Price-Column (most right)
  • calculates the Chart-Dimensions related to the actual Move-Development
    • creates Room on active Hemisphere
    • more Range if Trend/ more Move if Trace
    • Sensitivity indicates upcoming Activity (Work on Tipping-Points)
  • situative fluid Chart Impression (Scalation of developing Range = relative)


[SCALE] 2 x Period (Range + Move):

Visual Flexibility, manual

Isolate Range and Move by Click-through:

  • toggle by Click on the Scale-Column (2nd right)
  • first Click = minus Move, shows blank Period-Range
  • second Click = toggles Range and Move, shows blank Period-Moves
  • third Click = all back

Not intended for Live-Use and, to avoid Mis-Clicks not accessible of the Chart, but via Options-Menu:
switch Periods completely off with both Options false => complete free view.

All Layers stay functional.


[PROJECTOR - TOPProtocol Role:

Data Divisioning, Sentence

The Protocol of periodical Events can be set to Autostart for sufficient wide charts.

Chart-Auto-Scroll has to be active.

According to the Chart-Concept it is divided in componental Columns of TOHLCV,
inclusive full Legend via Tooltip.

From left to right:

  • Period Time/special Occurrences
  • positioning Range Open Side
  • central periodic Function (two Roles)
  • navigating Move Close Side
  • Period Volume/special Occurrences
  • switch on/ off (completely) on Chart via Projector - Button
  • leave with staying Panel as Placeholder by direct Click on the List
The Placeholder-Panel is generally accessible by direct Click on it (most left Column).
It is in flat Markets potentially supportive for the Resolution, because MT-Scale-Calculations

are situatively adjusted by Reduction of Periods (optional in Conjunction with Autofocus).


[REFLECTOR - BOTUniversal Mask:

Data Divisioning, Sequence

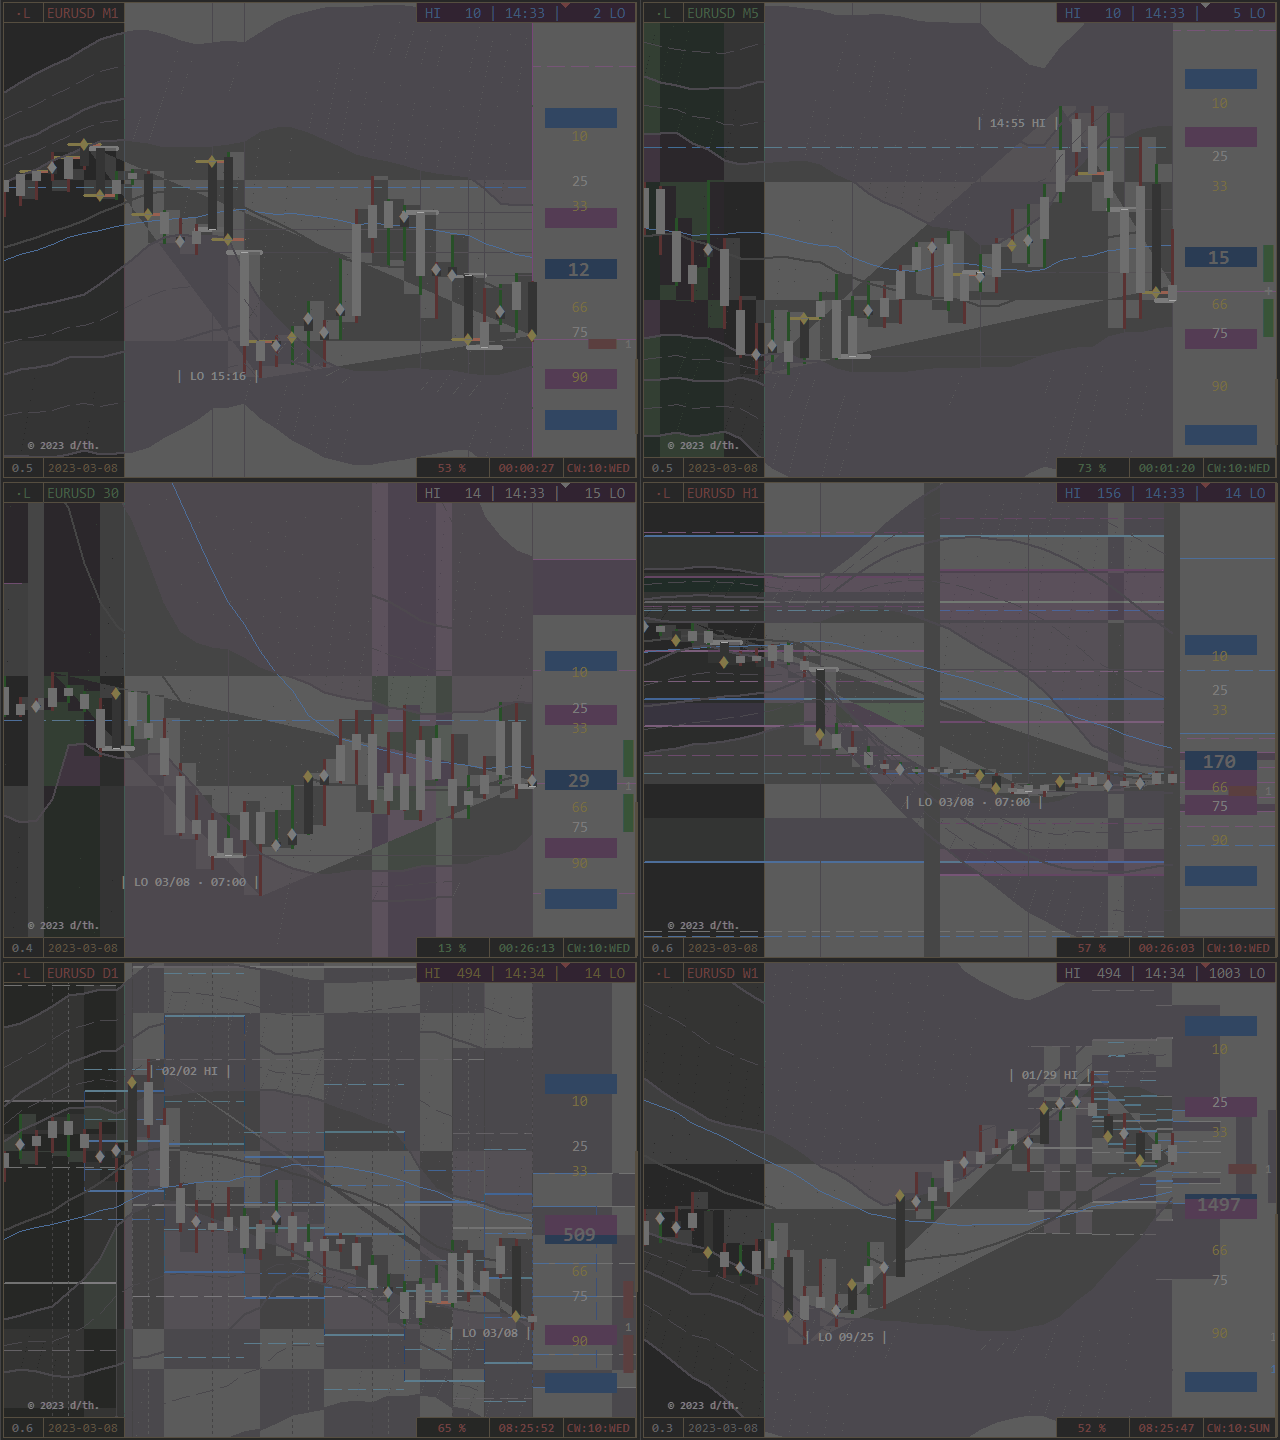
  • Open/ Close at High/ Low/ Center (Notes/ Dashes/ Crosshairs)
  • Open/ Close - Grid, PointZero Support-Resistance Graduation
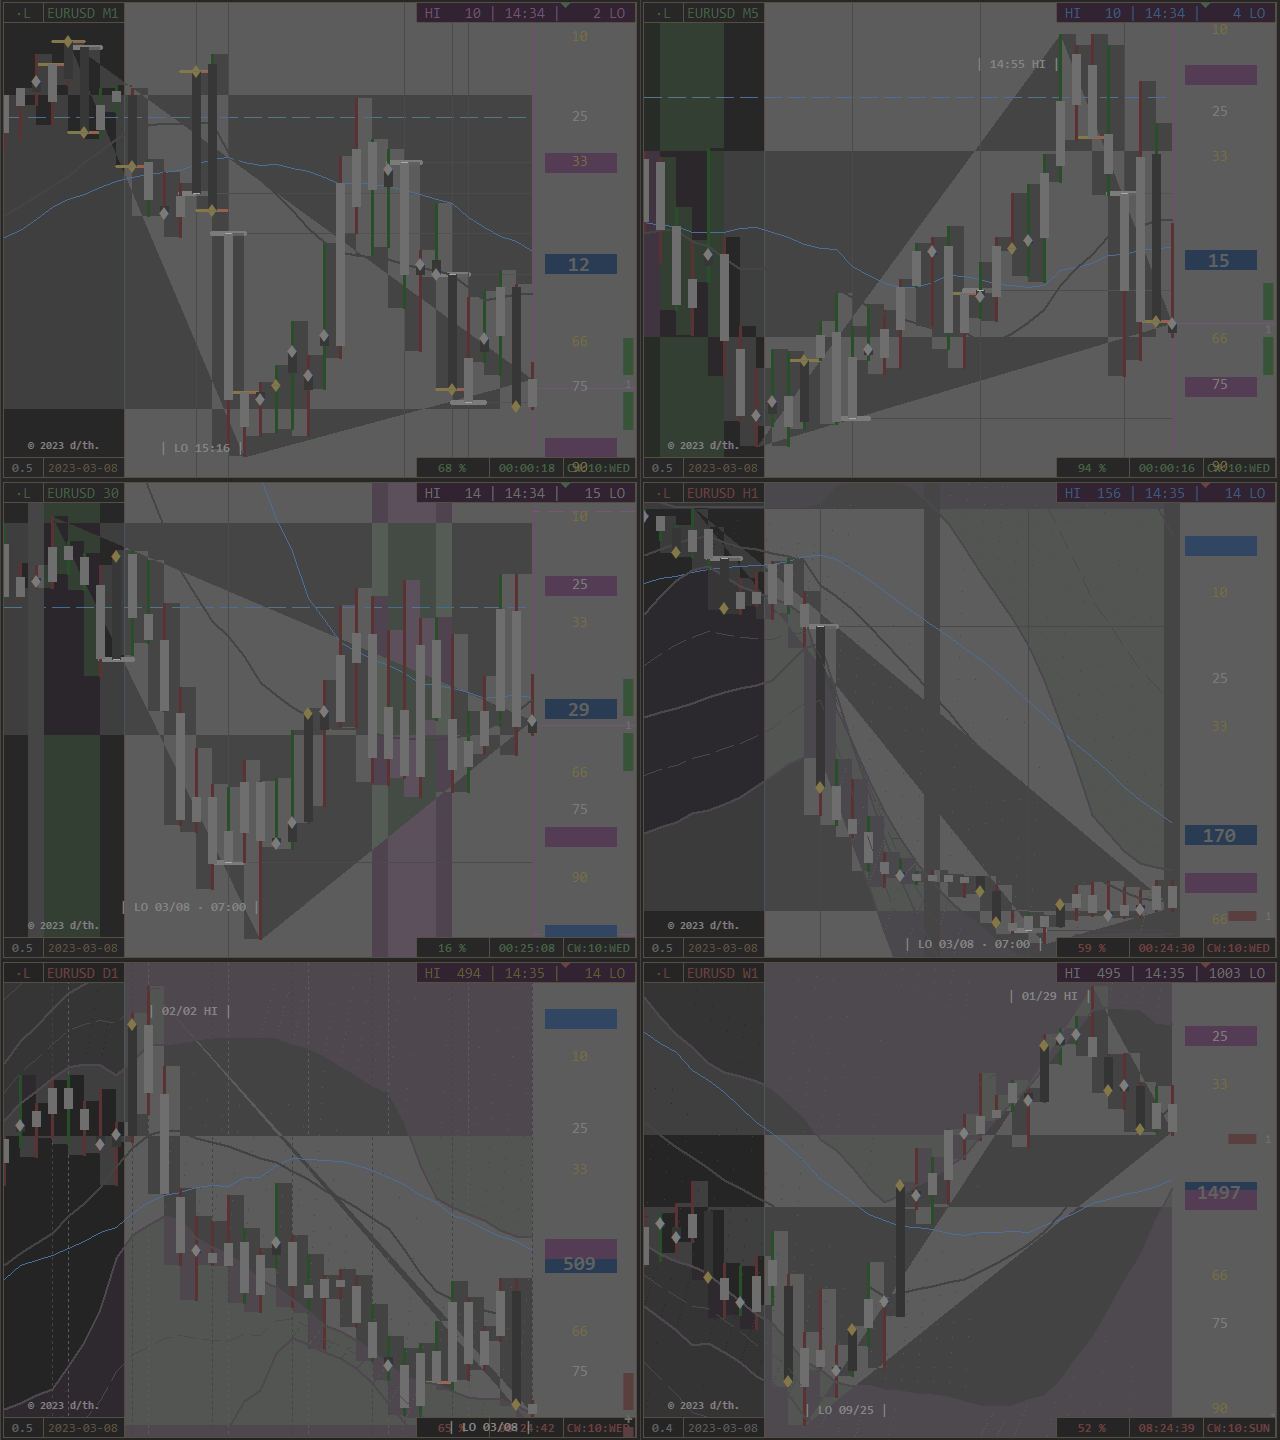
  • High/ Low/ Bid - Cone of Light (Chart Phase Scope)
  • High/ Low - Chart-Time of visible Periods (white, on Chart: timeframe-sensitive)
  • High/ Low - Chart-Price of visible Periods (white, on Price-Column: CHI = Chart High, CLO = Chart Low)

Indication of weekly Realtime-Transition Wednesday and Thursday

    • Odin = Ministrant/ Mantle/ collects = Close of Phase
    • Thor = Kloeckner/ Hammer/ strikes = Open of Phase

appears on Timeframes > M5 as underlying Histogram-Ray (chart-traversal)

  • if Zero = Close at Open/ High/ Low/ Center: white dash, notes Edges and Centers of Phases


Following Layers are Product of a special Contemplation

of the inner and outer Relations of Open and Close.

Move-Info

DisplayPosition + Direction + Function + Phase

[TOP] Echo Bars:

  • mirrored Bars, directional colored according to their respective Period-Direction,
  • adds an inverted Visual of Movements and forms functional Helix.

[BOT] Echo Trend:

  • mirrored Open- and Close-Trendlines, white = Open and orange = Close,
  • notes separately the leading Component of a Period as Heartbeat-Trend.


Layers

projective Reflection = reflective Projection


The Card Deck:

2 Buttons Corner 0TL

most top-left:
Order-Tool
  • first Letter = Pivot, second Letter = RealTime
  • DisplayC = Cycle/ L = Level/ Dot if not

Symbol - Button:

Clock

  • Market is clocked realtime to the real World by own Interest via cyclic and leveling Events.
  • Button Top right Corner 1 (Screenshot-Button) shows VOL (Volume/ Volatility)
  • Phases MN = M/ W1 = W/ D1 = D
The actual Time-Phase correlates with actual valid Price- and Volume-Phases 
and defines the timely Range of the pricely Movement. 
Price confirms this defining Call as designed Reflection.
Equal Colors cooperate through all Dimensions.


1 Button Corner 1TR

  • Clock Display
  • Screenshot, saved as GIF in \\DataFolder\MQL\Files\


2 Buttons Corner 2BL

Spread-Button (first, left) extends Button Row:

Activate four additional informational Buttons beside Protocol/ Interactive Mask,

which give access to the separate Chart Projectors. 

Note:

The following Layers are Product of the Projection of PointZeros to the actual processed Range and Move.

According to the Separation in Cycles and Levels, the direct

  • Projections as Light Cones are separately accessible.

Ranges and Scales are functional combined, and both are

  • by time: white/ blue and
  • by price: green/ red colored.

All have their conditional Appearance according to

  • Timeframe/ Security and Presence of Conditions 
in common.

Thus, Event-Density and -Impact

  • according to relative Distribution and Correlation of present Potentials!

Because of this, they are directly accessible by Chart-Button, or via Options automatically activated.

Choose of limitless Adjustability for Templates!

Due to their steady Interaction with the present Period they develop

and work actively (if enabled), until the PointZero leaves the Chart.


    From left to right:
    Time-Price-Button:
      DisplayServer-Time + Bid
      FunctionPointZero - Level Scaling
      • TOP Level Ranges
      • absolute and relative Plot of High/ Low - Ranges of respective PointZeros, 
        • Color navigational/ positional
      • BOT Phase Scales
      • absolute Division of respective PointZero - Range, 
        • overlying Variable notes TOHLCV - Position of next directive Call


      TPP / PPT - Button:

        Display: Productivity

        VPP = Volume per Period:
        Protocol List/ Center on TimeBand
        absolute (= Frequency)
        Impulse / Period
        Sensitivity 15%

          TPP = Ticks per Pip:

          • relative (= Alteration)
          • Impulse / Pip
          • Sensitivity 33%

            PPT = Pips per Tick:

            • total (= Oscillation)
            • Pip / Impulse
            • Sensitivity 50%

              Please further Informations to external Productivity in Section [7.0].


              FunctionPointZero - Projector (Beams)

              • on Top = Cycle
              • on Bottom = Level


                Both Projectors are setting their own Range Position in Relation to the actual Range Position,

                depending on their individual cyclic/ leveling Function.

                They work according to their Function and related to the individual Chart-Situation 
                as 
                ranging Barriers (Resistance) or 
                moving Tractors (Support).
                  Their Update-Frequency is by Tick, that means: they adjust in Cooperation with the 
                  actual Development, as long as their Period is on the Chart visible (if enabled).

                  Date-Button (second, right)
                    • Toggles the Period-Scale and 
                    • navigating Arrows RH/ MH/ ML/ RL, noting their Offset to their prior Position.
                    • Periods: Support white - Resistance orange


                      3 Buttons Corner 3 = BR

                      Colorize Channel Bands and Period Ranges to identify their Classification/ Function:

                      • Step = violet = D1 
                      • Lift = blue = W1
                      • Null = white = MN
                      • Full = orange = H4

                      left: [Period-Percentage] = colored Periods

                      note the classified State of Period-Moves

                      right: [CalendarWeek:WeekDay] = colored Channel-Bands
                      note the classified State of Period-Ranges = Channel-Shells/ Levels
                      center: [Countdown] = Close Signal

                      initially not shown, here on/off


                      Adjustments of general Nature:

                      • The Descriptive Mode is useful for Orientation or Confirmation (of not finally settled Experience).
                      • Extend the Pivot by H4 for smaller Timeframe Analysis.
                      • The MT4-Scales are a "fundamental Adjustment". I cannot resolve them..


                      Integer/ Double

                      constant variable = variable constant

                      The Icing:

                      • Protocol Role0 = Func (Function) / 1 = Bube (BullBear)
                      • Offset Price: position Price by whitchever Intent
                      • Shorten Digits: 6 Digits can be shorten to the preferred Length

                      • Screenshot 
                        • Interval: 0 = off
                        • Integer above 0 = Interval in Minutes
                        • adjust in Height and Width
                        • saved as GIF in \\DataFolder\MQL\Files\


                      Please find all necessary Informations to this Product in its Compendium in its respective RadioPhase - Blog.


                      logiclaboratory studio
                      © 2018-2023 /thiejden.


                      Avis 2
                      Daniel
                      875
                      Daniel 2023.07.26 17:01 
                       

                      Ich schaue mir beide Indis von dir mal an, Optik und Ausführung perfekt, mal schauen wie ichdamit zurecht komme. Erstmal vielen dank für die Indis und die Arbeit.

                      Jamie Daniel Thompson
                      263
                      Jamie Daniel Thompson 2023.06.22 14:43 
                       

                      Extremely useful and incredible tool! I don't understand how this doesn't have 5 star reviews yet! It has totally changed the accuracy of my entries! Thanks to the author!

                      Produits recommandés
                      Wise Men Indicator demo
                      Bohdan Kasyanenko
                      3.67 (3)
                      The indicator displays signals according to the strategy of Bill Williams on the chart. Demo version of the indicator has the same features as the paid, except that it can work only on a demo account . Signal "First Wise Man" is formed when there is a divergent bar with angulation.  Bullish divergent bar - with lower minimum and closing price in the upper half. Bearish divergent bar - higher maximum and the closing price at the bottom half. Angulation is formed when all three lines of Alligat
                      FREE
                      Introducing the Consecutive Green/Red Candle Alert Indicator for MT4 - Your Trend Spotting Companion! Are you ready to take your trading to the next level? We present the Consecutive Green/Red Candle Alert Indicator, a powerful tool designed to help you spot trends and potential reversals with ease. Whether you're a new trader looking for clarity in the market or an experienced pro seeking additional confirmation, this indicator is your trusted companion. Key Features of the Consecutive Green/Re
                      FREE
                      SensorMap
                      Juergen Thielen
                      5 (1)
                      Concept Market arranges in Time upcoming Phases according to the present Results of its Interest. Directing Modulations are an Interaction of immanent Periods, which show in Reference to Time cyclic Activity and to Price leveling Activity. SensorMap is a reflecting Volume Mask of this Concept of Time and Price and apportioning developed Price Movements in an equalized 100 % - Range: how far moved ? indicating their Status by marking special Events: when which Action ? setting the Situation in
                      FREE
                      Free automatic Fibonacci is an indicator that automatically plots a Fibonacci retracement based on the number of bars you select on the BarsToScan setting in the indicator. The Fibonacci is automatically updated in real time as new highest and lowest values appears amongst the selected bars. You can select which level values to be displayed in the indicator settings. You can also select the color of the levels thus enabling the trader to be able to attach the indicator several times with differe
                      FREE
                      TrendPlus
                      Sivakumar Subbaiya
                      4.21 (14)
                      Trend Plus   Trendplus  Indicator   Time Frame: Suitable for any time frame.  Purpose: Trend Prediction. Blue and red candle indicate the buy and sell call respectively. Buy: When the blue candle is formed buy call is initiated. close the buy trades when the next red candle will formed.   Sell: When the Red candle is formed Sell call is initiated. close the Sell trades when the next blue candle will formed.   Happy trade!!
                      FREE
                      SuperMac Free
                      Agus Wahyu Pratomo
                      4 (1)
                      FREE VERSION ONLY USE LOT SIZE 0.01 TO UNLOCK IT GO HERE  https://www.mql5.com/en/market/product/61498 SuperMac EA is a trading robot  for the trading on forex and trades  Scalping  Strategy and Tren Follower. This is a Trend Following system that trades in all session.   It use Multi Complex Algorithm to determine tren behaviour.  EA optimized on EURUSD, GBPUSD and NZDUSD (Use together) but can be use on other pair  Use PAIR can use 3 pairs (recommended to maximize profit) at the same tim
                      FREE
                      The   OHLC indicator   shows the current and historical values of High, Low, Open, Close and Mid for a specific time period. It can plot the current values or the values from the previous session. The indicator's range can be calculated from a daily, weekly, monthly, or user-specified session. Levels High  of the current or previous session. Low  of the current or previous session. Open  of current or previous session. Close  of the current or previous session. Midpoint  of the current or pre
                      FREE
                      This indicator is a perfect tool able to compare which brokers have the lower latency. It shows us immediately which brokers are slower or faster. When you see the dot icon on the line, it means this broker is the faster one and the red line (Broker_A) is the slower one. See the example on the screenshot. How It Works? This indicator shares the prices information to and from the "shared" common data folder. It compares all the prices. The price is based on average by (Ask + Bid) / 2. There are
                      FREE
                      UPD1 Rsi Dots Dashboard
                      Vitaliy Kuznetsov
                      5 (1)
                      L'indicateur affiche les signaux basés sur l'oscillateur RSI terminal sur le graphique. Il est possible de filtrer les signaux répétés. Ici, l'oscillateur est utilisé pour rechercher un signal inverse. Il est recommandé comme point d'entrée dans les stratégies swing et le trading à partir de niveaux. Un tableau de bord multidevises est disponible. Avec lui, vous pouvez facilement basculer entre les graphiques. Dans les discussions sur les produits, vous pouvez suggérer un algorithme dans le
                      FREE
                      PZ The Zone
                      PZ TRADING SLU
                      4.25 (4)
                      This indicator displays buy or sell signals according to Bill Williams' definition of the Trading Zone. [ Installation Guide | Update Guide | Troubleshooting | FAQ | All Products ] Easy to use and understand Avoid trading flat markets Deterministic indicator with clear rules The indicator is non-repainting It implements alerts of all kinds It has straightforward trading implications. A blue arrow is a buy signal A red arrow is a sell signal According to Bill Williams trading in the zone helps to
                      FREE
                      Follow The Line
                      Oliver Gideon Amofa Appiah
                      4 (13)
                      FOLLOW THE LINE GET THE FULL VERSION HERE: https://www.mql5.com/en/market/product/36024 This indicator obeys the popular maxim that: "THE TREND IS YOUR FRIEND" It paints a GREEN line for BUY and also paints a RED line for SELL.  It gives alarms and alerts of all kinds. IT DOES NOT REPAINT and can be used for all currency pairs and timeframes. Yes, as easy and simple as that. Even a newbie can use it to make great and reliable trades. NB: For best results, get my other premium indicators for more
                      FREE
                      SuperTrend V
                      Muhammad Hassaan
                      5 (1)
                      *This is TradingView indicator converted to mql4* The SuperTrend V indicator is a popular technical analysis tool used to identify trends and potential trend reversals in financial markets. It is based on the concept of the SuperTrend indicator but incorporates additional features and variations. The SuperTrend V indicator uses a combination of price action and volatility to determine the trend direction and generate trading signals. Here are the key components and features of the indicator:
                      FREE
                      FFx MACD
                      Eric Venturi-Bloxs
                      4.38 (8)
                      The purpose of this new version of the MT4 standard indicator provided in your platform is to display in a sub-window multiple timeframes of the same indicator. See the example shown in the picture below. But the display isn’t like a simple MTF indicator. This is the real display of the indicator on its timeframe. Here's the options available in the FFx indicator: Select the timeframes to be displayed (M1 to Monthly) Define the width (number of bars) for each timeframe box Alert pop up/sound/ema
                      FREE
                      Email Drawdown Alert
                      Roman Starostin
                      5 (15)
                      Free informative Indicator-helper. It'll be usefull for traders who trade many symbols or using grid systems (Averaging or Martingale). Indicator counts drawdown as percent and currency separate. It has a number of settings: Count deposite drawdown according equity value and send e-mail or notifications to user if DD more than set; Sending e-mail when max open orders reached; Shows price and remaining pips amount before MarginCall on current chart and Account generally; Display summary trade lot
                      FREE
                      Are you tired of drawing trendlines every time you're analyzing charts? Or perhaps you would like more consistency in your technical analysis. Then this is for you. This indicator will draw trend lines automatically when dropped on a chart. How it works Works similar to standard deviation channel found on mt4 and mt5. It has 2 parameters: 1. Starting Bar 2. Number of bars for calculation The   starting bar   is the bar which drawing of the trend lines will begin, while the   number of bars for c
                      FREE
                      OrderBlock TS Roman
                      Vladislav Vlastovskii
                      4 (7)
                      Индикатор строит блоки заказов (БЗ) по торговой системе (ТС) Романа. Поиск блоков осуществляется одновременно на двух таймфремах: текущем и старшем (определяемым в настройках). Для оптимизации и игнорирования устаревших блоков в настройках задается ограничение количества дней в пределах которых осуществляется поиск блоков. Блоки строятся по правилам ТС состоящем из трех шагов: какую свечу вынесли (что?); какой свечой вынесли (чем?); правило отрисовки (как?).
                      FREE
                      Download the free version   here. Divergence Divergence refers to when the price of a currency pair moves in one direction while the trend indicator is moving in the opposite direction. With divergence, there can be positive and negative signals. Divergences in Forex trading are quite common signals of technical analysis. These are basic early Forex signals indicating the trend reversal and filter false signals. Application of this indicator It is usually not easy to detect divergences by the t
                      FREE
                      Le Capteur de Tendance : La Stratégie du Capteur de Tendance avec Indicateur d'Alerte est un outil d'analyse technique polyvalent qui aide les traders à identifier les tendances du marché et les points d'entrée et de sortie potentiels. Elle présente une stratégie dynamique de Capteur de Tendance, s'adaptant aux conditions du marché pour une représentation visuelle claire de la direction de la tendance. Les traders peuvent personnaliser les paramètres selon leurs préférences et leur tolérance
                      FREE
                      This scanner shows the trend values of the well known indicator SuperTrend for up to 30 instruments and 8 time frames. You can get alerts via MT4, Email and Push-Notification as soon as the direction of the trend changes. This is the FREE version of the indicator: SuperTrend Scanner The free version works only on EURUSD and GBPUSD! Important Information How you can maximize the potential of the scanner, please read here: www.mql5.com/en/blogs/post/718074 With the following FREE indicator you
                      FREE
                      Ppr PA
                      Yury Emeliyanov
                      4 (1)
                      "Ppr PA" is a unique technical indicator created to identify "PPR" patterns on the currency charts of the MT4 trading platform. These patterns can indicate possible reversals or continuation of the trend, providing traders with valuable signals to enter the market. Features: Automatic PPR Detection:   The indicator automatically identifies and marks PPR patterns with arrows on the chart. Visual Signals:   Green and red arrows indicate the optimal points for buying and selling, respectively. A
                      FREE
                      Trend arrow Indicator
                      NGUYEN NGHIEM DUY
                      3.23 (13)
                      Trend arrow Indicator is an arrow Indicator used as an assistant tool for your trading strategy. The indicator analyzes the standard deviation of bar close for a given period and generates a buy or sell signals if the deviation increases. It good to combo with Martingale EA to follow Trend and Sellect Buy Only/Sell Only for EA work Semi-Automatic. You can use this  Indicator with any EAs in my Products.
                      FREE
                      Extremum Reverse Bar
                      Yurij Izyumov
                      3.55 (11)
                      This indicator has been created for finding the probable reversal points of the symbol price. A small candlestick reversal pattern is used it its operation in conjunction with a filter of extremums. The indicator is not redrawn! If the extremum filter is disabled, the indicator shows all points that have a pattern. If the extremum filter is enabled, the condition works – if the history Previous bars 1 candles back contains higher candles and they are farther than the Previous bars 2 candle, such
                      FREE
                      Pivot Mean Oscillator
                      Marco Calabrese
                      4 (1)
                      Pivot Mean Oscillator (PMO) is a unbounded zero-centered oscillator that provides a quick and normalized measure of divergence between two spreads. Detailed description of the mathematical formulation along with some comments and experiments can be found in this article .  Trading aspects This version of PMO is tuned on spreads relative to Close and Open price signals against their cumulative moving average (CMA). Positive PMO(m,n) values means that last (normalized) m Close prices are higher
                      FREE
                      Signals and Alerts for Accelerator/Decelerator indicator based on these MQL5 posts: Accelerator Oscillator and Signals of the Indicator Accelerator Oscillator . Note : this tool is based on the code of Accelerator indicator developed by MetaQuotes Software Corp. Features The signals are triggered at   closing   of last bar/opening of a new bar; Any kind of alerts can be enabled: Dialog Box, Email message, SMS notifications for smartphones and tablets, and Sound alerts; Customizable arrows. By
                      FREE
                      Magic Macd Cross
                      Christophe Godart
                      3 (1)
                      This classic "old school" MAGIC MACD indicator gives you the cross of the parameters you set. Standart setting is (12,26,9) . The arrows give you a possible change of trend. Be careful and do not use this indicator as a single signal source. FREE version  Please feel free to check out our other REX indicator series. We do have other free indicators.     "OLD BUT GOLD"
                      FREE
                      Sm Ichimoku Scanner
                      Steeve Christian Martol
                      5 (6)
                      Multi Time Frame Indicator acts as a Scanner based on the Ichimoku Trading System. The outcome is displayed on a board. This helps you to make "at a glance" a mental picture of the System without having to open the chart. Up to 10 Currencies can be watched. Scanned elements And Legend "KUMO Futur" - Green : The Kumo Futur is Bullish. "KUMO Futur" - Red : The Kumo Futur is Bearish. "PRICE Cross KJ" - Green : The Price is Above the Kijun Sen.  "PRICE Cross KJ" - Red : The Price is Below the Kijun
                      FREE
                      This trial scanner works with the other "Smart Market Structure Opportunity Scanner", and is basically an extension of that scanner with added features to find more accurate entry opportunities for day trading or refined swing trading.  The most important added features are:  1) The ADRs ( Average Daily Range ) for the last 5 days would have color and  +/- sign that shows the direction of each days ADR     move.  2) I added RSI values for each of the trading timeframes ( 1min, 5min, 15min, 30min
                      FREE
                      A professional tool for trading - the divergence indicator between the RSI and the price, which allows you to receive a signal about a trend reversal in a timely manner or catch price pullback movements (depending on the settings). The indicator settings allow you to adjust the strength of the divergence due to the angle of the RSI peaks and the percentage change in price, which makes it possible to fine-tune the signal strength. The indicator code is optimized and is tested very quickly as par
                      FREE
                      ZigZag Fibo Retracement
                      Dang Khoa Nguyen
                      5 (1)
                      ZigZag Fibo Retracement Indicator Optimize Your Trading Strategy! Are you seeking to optimize your trading strategy in the financial markets? Explore the unique features of the ZigZag Fibo Retracement Indicator, a powerful tool designed to help you identify potential support and resistance levels based on the combination of ZigZag patterns and Fibonacci ratios. Integration of ZigZag Patterns and Fibonacci: The ZigZag Fibo Retracement Indicator combines the effectiveness of ZigZag patterns, helpi
                      FREE
                      Les acheteurs de ce produit ont également acheté
                      Gann Made Easy
                      Oleg Rodin
                      4.96 (46)
                      Gann Made Easy est un système de trading Forex professionnel et facile à utiliser qui est basé sur les meilleurs principes de trading en utilisant la théorie de mr. WD Gann. L'indicateur fournit des signaux d'ACHAT et de VENTE précis, y compris les niveaux Stop Loss et Take Profit. Vous pouvez échanger même en déplacement en utilisant les notifications PUSH. S'il vous plaît contactez-moi après l'achat! Je partagerai avec vous mes astuces de trading et d'excellents indicateurs bonus gratuitement!
                      Atomic Analyst
                      Issam Kassas
                      5 (1)
                      Tout d'abord, il convient de souligner que cet indicateur de trading n'est ni repainting, ni redrawing et ne présente aucun délai, ce qui le rend idéal à la fois pour le trading manuel et automatisé. L'Analyste Atomique est un indicateur d'action sur les prix PA qui utilise la force et le momentum du prix pour trouver un meilleur avantage sur le marché. Équipé de filtres avancés qui aident à éliminer les bruits et les faux signaux, et à augmenter le potentiel de trading. En utilisant plusieur
                      Gold Stuff
                      Vasiliy Strukov
                      4.89 (250)
                      Gold Stuff est un indicateur de tendance conçu spécifiquement pour l'or et peut également être utilisé sur n'importe quel instrument financier. L'indicateur ne se redessine pas et ne traîne pas. Délai recommandé H1. Au niveau de l'indicateur de travail, l'Expert Advisor EA Gold Stuff est entièrement automatique. Vous pouvez le trouver sur mon profil. Contactez-moi immédiatement après l'achat pour obtenir les réglages et un bonus personnel !   RÉGLAGES Dessiner la flèche - on off. dessin
                      Scalper Vault
                      Oleg Rodin
                      5 (27)
                      Scalper Vault est un système de scalpage professionnel qui vous fournit tout ce dont vous avez besoin pour un scalpage réussi. Cet indicateur est un système de trading complet qui peut être utilisé par les traders de forex et d'options binaires. Le délai recommandé est M5. Le système vous fournit des signaux fléchés précis dans le sens de la tendance. Il vous fournit également des signaux supérieurs et inférieurs et des niveaux de marché Gann. Les indicateurs fournissent tous les types d'alertes
                      ACTUELLEMENT 26% DE RÉDUCTION La meilleure solution pour tout débutant ou trader expert ! Cet indicateur est un outil de trading unique, de haute qualité et abordable car nous avons incorporé un certain nombre de caractéristiques exclusives et une nouvelle formule. Avec seulement UN graphique, vous pouvez lire la force de la devise pour 28 paires Forex ! Imaginez comment votre trading va s'améliorer parce que vous êtes capable de repérer le point de déclenchement exact d'une nouvelle tendan
                      Trend Screener
                      STE S.S.COMPANY
                      4.83 (86)
                      Indicateur de tendance, solution unique révolutionnaire pour le trading et le filtrage des tendances avec toutes les fonctionnalités de tendance importantes intégrées dans un seul outil ! Il s'agit d'un indicateur multi-période et multi-devises 100 % non repeint qui peut être utilisé sur tous les symboles/instruments : forex, matières premières, crypto-monnaies, indices et actions. Trend Screener est un indicateur de suivi de tendance efficace qui fournit des signaux de tendance fléchés avec des
                      Actuellement 20% de réduction ! La meilleure solution pour tout débutant ou trader expert ! Ce logiciel de tableau de bord fonctionne sur 28 paires de devises. Il est basé sur 2 de nos principaux indicateurs (Advanced Currency Strength 28 et Advanced Currency Impulse). Il donne un excellent aperçu de l'ensemble du marché Forex. Il montre les valeurs de l'Advanced Currency Strength, la vitesse de mouvement des devises et les signaux pour 28 paires de devises dans tous les (9) délais. Imagine
                      Tout d'abord, il convient de souligner que cet outil de trading est un indicateur non repeint, non redessiné et non retardé, ce qui le rend idéal pour le trading professionnel. L'indicateur Smart Price Action Concepts est un outil très puissant à la fois pour les nouveaux et les traders expérimentés. Il regroupe plus de 20 indicateurs utiles en un seul, combinant des idées de trading avancées telles que l'analyse du trader Inner Circle et les stratégies de trading Smart Money Concepts. Cet in
                      TPSproTREND PrO
                      Roman Podpora
                      5 (15)
                      TPSpro TRENDPRO  - is a trend indicator that automatically analyzes the market and provides information about the trend and each of its changes, as well as giving signals for entering trades without redrawing! The indicator uses each candle, analyzing them separately. referring to different impulses - up or down impulse. Exact entry points into transactions for currencies, crypto, metals, stocks, indices!  -  Version MT5               DETAILED DESCRIPTION        /       TRADING SETUPS           
                      Scalper Inside PRO
                      Alexey Minkov
                      4.75 (55)
                      SALE NOW! Limited Time Offer! An exclusive indicator that utilizes an innovative algorithm to swiftly and accurately determine the market trend. The indicator automatically calculates opening, closing, and profit levels, providing detailed trading statistics. With these features, you can choose the most appropriate trading instrument for the current market conditions. Additionally, you can easily integrate your own arrow indicators into Scalper Inside Pro to quickly evaluate their statistics and
                      Présentation       Quantum Trend Sniper Indicator   , l'indicateur révolutionnaire MQL5 qui transforme la façon dont vous identifiez et négociez les inversions de tendance ! Développé par une équipe de traders expérimentés avec une expérience commerciale de plus de 13 ans,       Indicateur Quantum Trend Sniper       est conçu pour propulser votre parcours de trading vers de nouveaux sommets grâce à sa manière innovante d'identifier les inversions de tendance avec une précision extrêmement élevée
                      Le profit de la structure du marché change à mesure que le prix s'inverse et recule. L'indicateur d'alerte d'inversion de la structure du marché identifie le moment où une tendance ou un mouvement de prix approche de l'épuisement et est prêt à s'inverser. Il vous avertit des changements dans la structure du marché qui se produisent généralement lorsqu'un renversement ou un recul majeur est sur le point de se produire. L'indicateur identifie initialement les cassures et la dynamique des prix,
                      Découvrez le secret pour réussir le trading Forex avec notre indicateur MT4 personnalisé! Vous êtes-vous déjà demandé comment réussir sur le marché du Forex, gagnant régulièrement des bénéfices tout en minimisant les risques? Voici la réponse que vous avez recherchée! Permettez-nous d'introduire notre indicateur MT4 propriétaire qui révolutionnera votre approche du trading. Polyvalence unique Notre indicateur est spécialement conçu pour les utilisateurs qui préfèrent les formations de bou
                      Quantum Breakout Indicator PRO
                      Bogdan Ion Puscasu
                      4.96 (26)
                      Présentation       Quantum Breakout PRO   , l'indicateur révolutionnaire MQL5 qui transforme la façon dont vous négociez les zones d'évasion ! Développé par une équipe de traders expérimentés avec une expérience de trading de plus de 13 ans,   Quantum Breakout PRO   est conçu pour propulser votre parcours de trading vers de nouveaux sommets grâce à sa stratégie de zone de discussion innovante et dynamique. Quantum Breakout Indicator vous donnera des flèches de signalisation sur les zones d
                      Advanced Supply Demand
                      Bernhard Schweigert
                      4.92 (310)
                      CURRENTLY 26% OFF !! Best Solution for any Newbie or Expert Trader! This indicator is a unique, high quality and affordable trading tool because we have incorporated a number of proprietary features and a new formula. With this update, you will be able to show double timeframe zones. You will not only be able to show a higher TF but to show both, the chart TF, PLUS the higher TF: SHOWING NESTED ZONES. All Supply Demand traders will love it. :) Important Information Revealed Maximize the potenti
                      ALERTE D'ACHAT ET DE VENTE MULTIDEVISES et MULTITIMEFRAME. AUTO TRAILING STOP ET RÉCOMPENSE DE RISQUE TAKEPROFIT ! L'INDICATEUR SCANNE ET ANALISE LE MARCHÉ POUR QUE VOUS N'AVEZ RIEN À FAIRE ! NÉGOCIEZ TOUTES VOS DEVISES SUR UN GRAPHIQUE !   Après l'achat veuillez laisser un commentaire, contactez-moi et je vous enverrai l'assistant commercial EA. L'indicateur utilise plusieurs oscillateurs et filtres associés pour trouver les meilleurs points d'entrée CONFIRMÉS afin que vous n'ayez pas à
                      TPSpro RFI Levels
                      Roman Podpora
                      5 (13)
                      A key element in trading is zones or levels from which decisions to buy or sell a trading instrument are made. Despite attempts by major players to conceal their presence in the market, they inevitably leave traces. Our task was to learn how to identify these traces and interpret them correctly. Reversal First Impulse levels (RFI)   -  Version MT5                INSTRUCTIONS                 RUS                 ENG                                       R ecommended to use with an indicator   -  
                      Présentation de l'indicateur miraculeux Forex : Libérez la puissance du trading précis En avez-vous assez de chercher le meilleur indicateur Forex qui fournisse réellement des résultats exceptionnels sur tous les délais ? Ne cherchez plus ! L'indicateur miraculeux Forex est là pour révolutionner votre expérience de trading et propulser vos gains vers de nouveaux sommets. Basé sur une technologie de pointe et des années de développement minutieux, l'indicateur miraculeux Forex se positionne comme
                      Entry Points Pro
                      Yury Orlov
                      4.7 (225)
                      Indicateur supérieur pour MT4 fournissant des signaux précis pour entrer dans un trade sans repeindre ! Il peut être appliqué à tous les actifs financiers : forex, cryptocurrencies, métaux, actions, indices.  La version MT5 est ici Il fournira des signaux de trading assez précis et vous dira quand il est préférable d'ouvrir un trade et de le fermer. Regardez la vidéo (6:22) avec un exemple de traitement d'un seul signal qui a rapporté à l'indicateur ! La plupart des traders améliorent l
                      Break and Retest
                      Mohamed Hassan
                      5 (2)
                      Break & Retest is unstoppable when combined with our other divergence indicator. After purchase, send us a message and you could get this  2nd indicator  for  FREE  as a  BONUS! ‍You can visually backtest Break & Retest to see how it behaved in the past!    Manual guide:   Click here $59  for the first 25 copies ( 4  left)! Next price is $120 .  After many months of hard work and dedication, we are extremely proud to present you our  Break and Retest price action indicator crea
                      TrendMaestro
                      Stefano Frisetti
                      5 (2)
                      note: this indicator is for METATRADER4, if you want the version for METATRADER5 this is the link: TRENDMAESTRO recognizes a new TREND in the bud, he never makes mistakes. The certainty of identifying a new TREND is priceless. DESCRIPTION TRENDMAESTRO identifies a new TREND in the bud, this indicator examines the volatility, volumes and momentum to identify the moment in which there is an explosion of one or more of these data and therefore the moment in which prices have strong probability of f
                      FX Power MT4 NG
                      Daniel Stein
                      5 (8)
                      Obtenez votre mise à jour quotidienne du marché avec des détails et des captures d'écran via notre Morning Briefing ici sur mql5 et sur Telegram ! FX Power MT4 NG est la nouvelle génération de notre très populaire indicateur de force des devises, FX Power. Et qu'est-ce que ce compteur de force de nouvelle génération offre ? Tout ce que vous avez aimé de l'original FX Power PLUS Analyse de la force de l'OR/XAU Des résultats de calcul encore plus précis Périodes d'analyse configurables individuel
                      Trend Forecasting
                      Mohamed Hassan
                      5 (15)
                      Cet indicateur est très puissant lorsqu'il est combiné avec notre autre indicateur appelé Katana. Après l'achat, envoyez-nous un message et vous pourrez obtenir Katana GRATUITEMENT en BONUS  ! Le prix augmentera bientôt à 149$ ! Ne manquez pas le prix courant à 65$ ! L'indicateur de prévision de tendance est un outil très unique et simple qui est capable de prédire les mouvements futurs des prix en fonction des signaux générés par MACD. Cela vous aide à avoir une estimation des domaines dans
                      Price Action Entry Alerts
                      Stephen Sanjeeve Sahayam
                      5 (3)
                      Cet indicateur examine chaque barre pour la pression d'achat ou de vente et identifie 4 types de modèles de bougies avec le volume le plus élevé. Ces bougies sont ensuite filtrées à l'aide de plusieurs filtres linéaires pour afficher les signaux d'achat ou de vente. Les signaux fonctionnent mieux, en conjonction avec une direction temporelle plus élevée et lorsqu'ils sont négociés pendant les heures de volume élevé. Tous les filtres sont personnalisables et fonctionnent indépendamment. Peut aff
                      ACTUELLEMENT 31% DE RÉDUCTION ! ! La meilleure solution pour tout débutant ou Expert Trader ! Cet indicateur est un outil de trading unique, de haute qualité et abordable car nous avons incorporé un certain nombre de caractéristiques exclusives et une formule secrète. Avec seulement UN graphique, il donne des alertes pour les 28 paires de devises. Imaginez comment votre trading s'améliorera parce que vous serez capable de repérer le point de déclenchement exact d'une nouvelle tendance ou d'
                      TrendDecoder Premium
                      Christophe, Pa Trouillas
                      5 (3)
                      Identifiez les ranges et les prochaines tendances fortes   |  Obtenez les premiers signaux et la force des tendances   |  Obtenez des TP clairs et RR favorable   |  Repérer les niveaux Fibo que le prix va tester Indicateur qui ne retrace pas, non retardé - idéal pour le trading manuel et automatisé - adapté à tous les actifs et à toutes les unités de temps Pour une durée limitée >>   -50% de réduction Après votre achat,   contactez-moi sur ce canal  pour obtenir les réglages recommandés. Version
                      Currency Strength Wizard est un indicateur très puissant qui vous offre une solution tout-en-un pour un trading réussi. L'indicateur calcule la puissance de telle ou telle paire de devises en utilisant les données de toutes les devises sur plusieurs périodes. Ces données sont représentées sous la forme d'un indice de devise facile à utiliser et de lignes électriques de devise que vous pouvez utiliser pour voir la puissance de telle ou telle devise. Tout ce dont vous avez besoin est d'attacher l'
                      L'indicateur d'inversion ADR vous montre en un coup d'œil où le prix se négocie actuellement par rapport à sa fourchette quotidienne moyenne normale. Vous recevrez des alertes instantanées par pop-up, e-mail ou push lorsque le prix dépasse sa fourchette moyenne et les niveaux supérieurs de votre choix afin que vous puissiez sauter rapidement dans les reculs et les inversions. L'indicateur trace des lignes horizontales sur le graphique aux extrêmes de la fourchette quotidienne moyenne ainsi que
                      FX Volume
                      Daniel Stein
                      4.6 (35)
                      Obtenez votre mise à jour quotidienne du marché avec des détails et des captures d'écran via notre Morning Briefing ici sur mql5 et sur Telegram ! FX Volume est le PREMIER et SEUL indicateur de volume qui fournit un VRAI aperçu du sentiment du marché du point de vue d'un courtier. Il fournit des informations impressionnantes sur la façon dont les acteurs institutionnels du marché, comme les courtiers, sont positionnés sur le marché des changes, bien plus rapidement que les rapports COT. Voir c
                      Tout d'abord, il convient de souligner que ce système de trading est un indicateur non repainting, non redrawing et non lagging, ce qui le rend idéal pour le trading professionnel. Le "Système de Trading de Support et Résistance Intelligent" est un indicateur avancé conçu pour les traders novices et expérimentés. Il permet aux traders de bénéficier de précision et de confiance sur le marché du forex. Ce système complet combine plus de 7 stratégies, 10 indicateurs et diverses approches de trad
                      Plus de l'auteur
                      SensorMap
                      Juergen Thielen
                      5 (1)
                      Concept Market arranges in Time upcoming Phases according to the present Results of its Interest. Directing Modulations are an Interaction of immanent Periods, which show in Reference to Time cyclic Activity and to Price leveling Activity. SensorMap is a reflecting Volume Mask of this Concept of Time and Price and apportioning developed Price Movements in an equalized 100 % - Range: how far moved ? indicating their Status by marking special Events: when which Action ? setting the Situation in
                      FREE
                      Filtrer:
                      Daniel
                      875
                      Daniel 2023.07.26 17:01 
                       

                      Ich schaue mir beide Indis von dir mal an, Optik und Ausführung perfekt, mal schauen wie ichdamit zurecht komme. Erstmal vielen dank für die Indis und die Arbeit.

                      Jamie Daniel Thompson
                      263
                      Jamie Daniel Thompson 2023.06.22 14:43 
                       

                      Extremely useful and incredible tool! I don't understand how this doesn't have 5 star reviews yet! It has totally changed the accuracy of my entries! Thanks to the author!

                      Répondre à l'avis
                      Version 3.7 2023.04.16
                      Integration of the TickEvent News-Addon, no further Changes
                      Version 3.6 2023.04.10
                      final Pixelwork on the Phase-Propeller, no further Changes.
                      Version 3.5 2023.03.14
                      extended by Single-Pivot Option
                      Version 3.4 2023.03.12
                      Taken out redundant Pivot-Adjustment (H4) and extended by Time-Adjustment Server-Terminal
                      Version 3.3 2023.03.09
                      aligned/ defined/ extended/ finalized/ homologized/ completed
                      Version 3.2 2022.12.20
                      The Bull-Bear-Propeller received an indicational update and prints now the Propeller-Status instead of the actual period-direction..
                      Version 3.1 2022.12.19
                      PØINTZERØ SENSØRMAP is now splitted in two separate partial indicators, independent of each other working, standalone functional, fully enfolding their power by combination.

                      PØINTZERØ >+< PRØJECTØR: oscillating absolute Pricechart relating the functional categories (main)
                      SENSØRMAP <+> REFLECTØR: equalized relative Timechart alternating the categorized functions (sub)

                      If you want to have a Visual of the complete PØINTZERØ SENSØRMAP, please save a SENSØRMAP-Template as Tester-Template (tester.tpl) in templates-folder.
                      Of course you should load the indicator in advance ;-)

                      Merry christmas world!
                      Version 3.0 2022.11.26
                      major update v 3.0
                      Version 2.9 2022.11.21
                      faster and better than planned.. observation is the only functioning technique!
                      Version 2.8 2022.11.17
                      if I wouldn't love what I do, I wouldn't do what I do.. PIV-color-setup now functional.. H4 reimplemented - no daytrading without it.. now with a clear conscience..
                      Version 2.7 2022.11.17
                      functionality of Navi-News-Panel adjusted and sudden period-counting-typo corrected.. patience always gets rewarded..
                      Version 2.6 2022.11.17
                      with this last update for this year everything is brought into the right light. compose and develop markets image as variable as market is driven. HAIRCROSS and enabled TOOL answer most of initial/ orientational questions. I wish nice holidays!
                      Version 2.5 2022.11.17
                      PEN-rotor_stator now Trendline instead of txt-object //dismissed PIV<D1 // optimized PEN-Trace-Trend-Logic: Trace= dark/ Trend= bright : this way realistic price-action-mirroring // dismissed obsolete variables , some household and freshing cosmetics - imaging sharper every update..//
                      Version 2.4 2022.11.16
                      the spread-level-warn-display had to be corrected..
                      Version 2.3 2022.11.16
                      final touches and cosmetics..
                      Version 2.2 2022.11.14
                      simplified visual, any effort is dedicated to optimized functionality..
                      Version 2.1 2022.11.13
                      poets on coding serials..interst stands in front of discovery.
                      Version 2.0 2022.11.09
                      adjusted the speed-display to directional colors, now makes sense ;-)
                      Version 1.9 2022.11.09
                      some further internal optimizations..
                      Version 1.8 2022.11.07
                      update to new MT4 Terminal-version 4.00 build 1363 03 Nov 2022, it comes with several internal optimizations..
                      Version 1.7 2022.11.03
                      color correction corner 3, apart from that conflict-free presentation today..
                      Version 1.6 2022.11.03
                      minor graphical definitions - mismatches cleared - no further irregularities discovered.. stable and vivid.. here go
                      Version 1.5 2022.11.01
                      the value of a calibration one can measure in signals, which accomplish to pass revision tests by being such rare that any revision would take days..
                      Version 1.4 2022.11.01
                      there is always potential to optimize.. redundants cleared..
                      Version 1.3 2022.10.30
                      with one last minor graphical correction this now awaits to become discovered by you
                      Version 1.2 2022.10.30
                      the winter-time-change cheated the last update - corrected + goddie for wintertime :-)
                      Version 1.1 2022.10.30
                      Functional Implematation of the Rotor-Stator-Function via Bull and Bear, obsolete code cleaned and graphics and visuals defined