UR VolumeTrend MT5
- Indicateurs
- Krzysztof Jan Debski
- Version: 3.0
- Mise à jour: 22 juillet 2022
- Activations: 5
Tendance volume UR
UR VolumeTrend est l'indicateur de volume le plus clair montrant la tendance en cours en termes de volume. Fonctionne parfaitement avec d'autres indicateurs, tout comme UR TrendExhaustion pour signaler les hauts et les bas locaux.
Limité à seulement 2 paramètres - plus les valeurs sont élevées, plus les tendances seront longues.
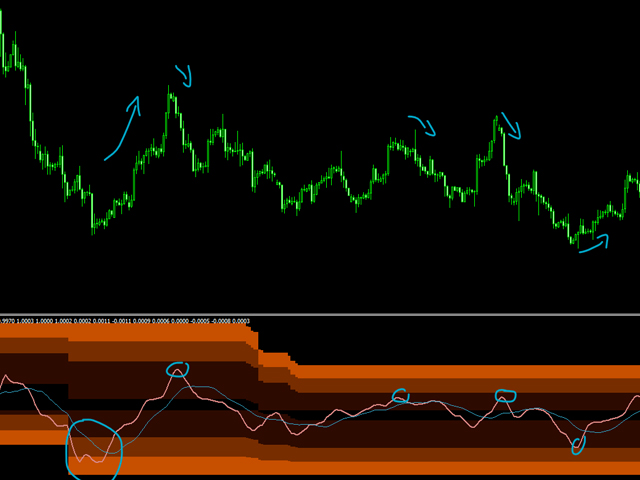
Les extrêmes de gradient montrent des épuisements possibles du volume pour attraper un renversement potentiel.
Deux lignes - La tendance du volume et C'est moyen.
Le meilleur avantage : Facile et adapté à tous les atouts.
Il y a un chat spécial par télégramme sur lequel vous pouvez rester au courant des mises à jour des outils et également envoyer une demande si vous pensez qu'il manque quelque chose !
Pourquoi UR VolumeTrend ?
Tous conviendront que le volume est la clé pour saisir les tendances. Cet oscillateur est une somme de tous mes outils de volume compressés en un seul indicateur facile à utiliser. Il affiche le volume positif/négatif d'une manière conviviale. L'interface derrière montre si le volume est éventuellement épuisé par rapport au passé - ou s'il va pousser à de nouveaux niveaux.
Comment utiliser UR VolumeTrend ?
Voir la description ci-dessous pour en savoir plus :
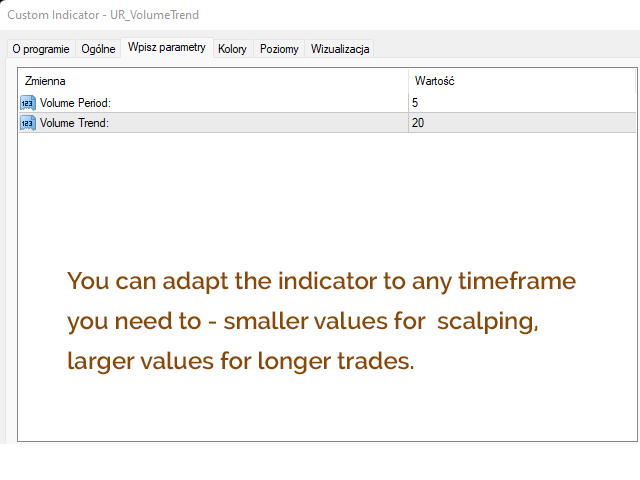
PARAMÈTRES
Période de volume : plus la valeur est élevée, plus les grandes tendances seront tentées
Tendance du volume : cette ligne supplémentaire affiche les entrées d'annulation potentielles basées uniquement sur le volume
AFFICHER
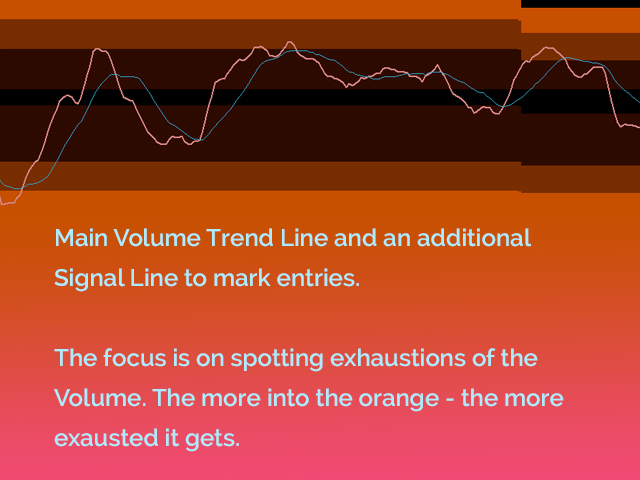
Interface dégradée : affiche les niveaux extrêmes basés sur le passé.
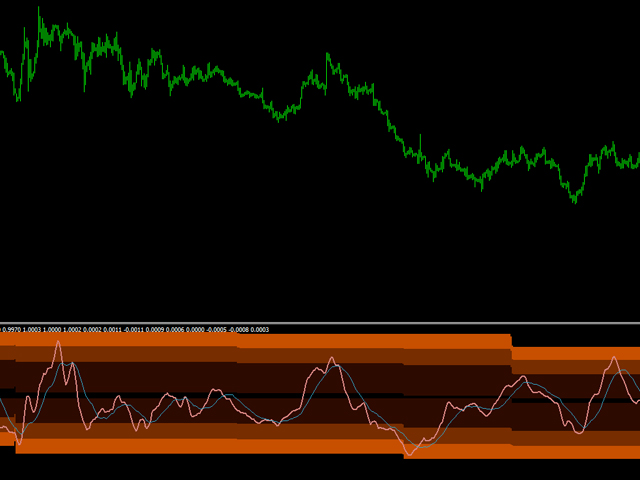
Ligne principale du volume : Indique si le volume est haussier *au-dessus de 0* ou baissier *en-dessous de 0* et la force du volume. Planer autour de 0 signifie que le marché n'a pas de volume.
Ligne de tendance du volume : affiche une moyenne du volume pour avoir une image plus claire des entrées et des inversions potentielles.
AJOUT
Tous mes outils fonctionnent mieux lorsqu'ils sont assemblés. Cela signifie que la précision des points d'entrée est bien meilleure si elle est utilisée avec UR TrendExhaustion, UR DivergenceSpotter ou/et UR HighsAndLows.