UR VolumeTrend MT5
- Indicatori
- Krzysztof Jan Debski
- Versione: 3.0
- Aggiornato: 22 luglio 2022
- Attivazioni: 5
UR VolumeTrend
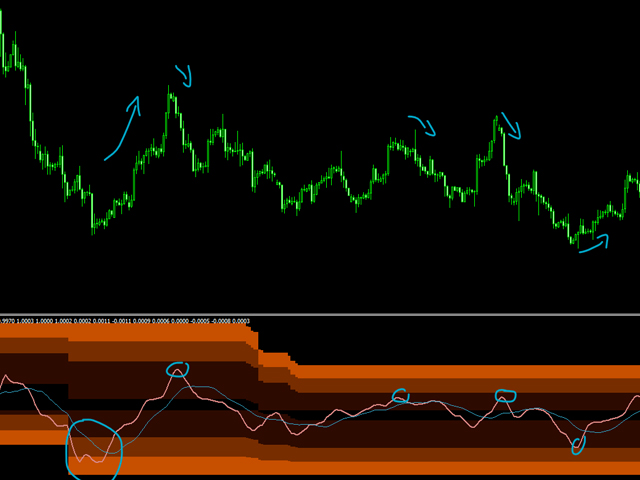
UR VolumeTrend è l'indicatore di volume più chiaro che mostra la tendenza in corso in termini di volume. Funziona perfettamente con altri indicatori proprio come UR TrendExhaustion per segnalare massimi e minimi locali.
Limitato a soli 2 parametri: più alti sono i valori, più lunghe saranno le tendenze che mostrerà.
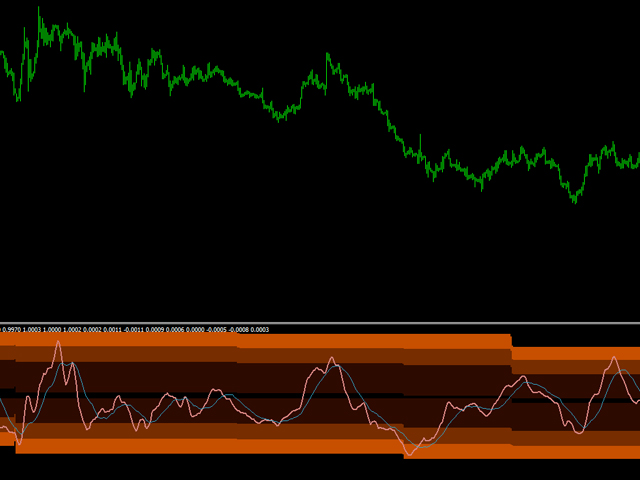
Gli estremi del gradiente mostrano possibili esaurimenti di volume per catturare una potenziale inversione.
Due righe: l'andamento del volume e la media.
Il miglior vantaggio: facile e adattato a tutte le risorse.
C'è una speciale chat di Telegram su cui puoi rimanere aggiornato sugli aggiornamenti degli strumenti e anche inviare richieste se ritieni che manchi qualcosa!
Perché UR VolumeTrend?
Tutti saranno d'accordo Il volume è la chiave per cogliere le tendenze. Questo oscillatore è una somma di tutti i miei strumenti di volume compressi in un indicatore facile da usare. Mostra il volume positivo/negativo in modo intuitivo. L'interfaccia dietro mostra se il volume si sta forse esaurendo rispetto al passato o se si spingerà a nuovi livelli.
Come usare UR VolumeTrend?
Vedi la descrizione qui sotto per avere più familiarità con esso:
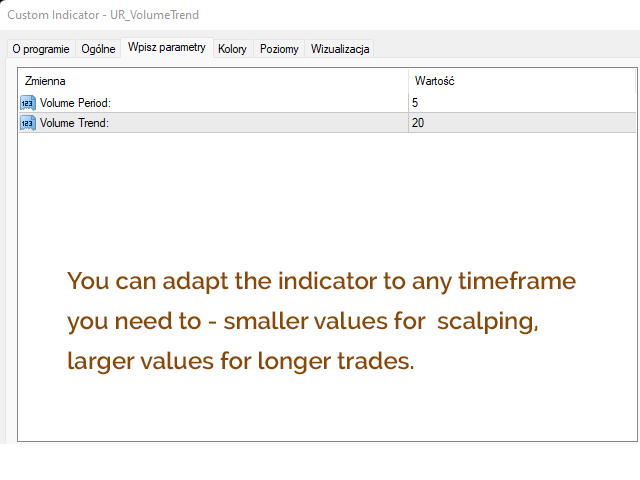
IMPOSTAZIONI
Periodo di volume: maggiore è il valore, maggiori saranno le tendenze che cercherà di catturare
Trend del volume: questa riga aggiuntiva mostra le voci di storno potenziali basate esclusivamente sul volume
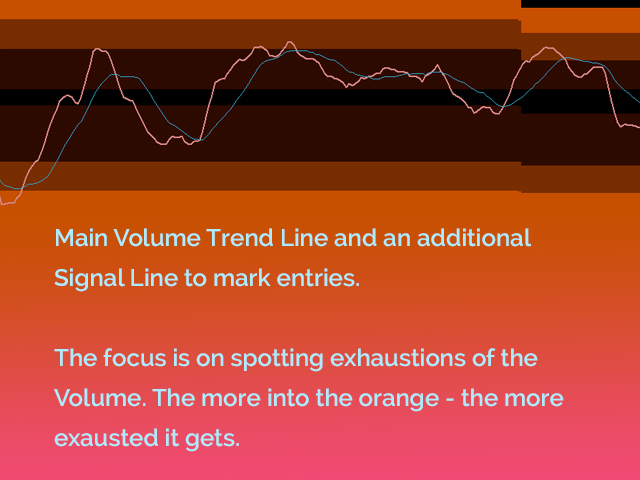
SCHERMO
Interfaccia gradiente: mostra i livelli estremi basati sul passato.
Linea principale del volume: mostra se il volume è rialzista *sopra 0* o ribassista *sotto 0* e quanto forte diventa il volume. Passare intorno allo 0 significa che il mercato non ha volume.
Linea di tendenza del volume: mostra una media del volume per avere un quadro più chiaro di potenziali entrate e inversioni.
AGGIUNTA
Tutti i miei strumenti funzionano meglio una volta assemblati. Ciò significa che la precisione dei punti di ingresso è decisamente migliore se utilizzata con UR TrendExhaustion, UR DivergenceSpotter o/e UR HighsAndLows.
ło