Abiroid Halftrend Scanner
- Indicateurs
-
Abir Pathak
 I create MT4 and MT5 indicators. They are mainly arrows and scanner indicators and also some essential utilities.
I'm hoping they will make your trading easier and make you profitable.
You can join my Telegram channel to keep track of all products I post. - Version: 1.7
- Mise à jour: 13 octobre 2024
- Activations: 20
Read detailed description and Get Free Demo and extra indicators:
https://www.mql5.com/en/blogs/post/758610Features:
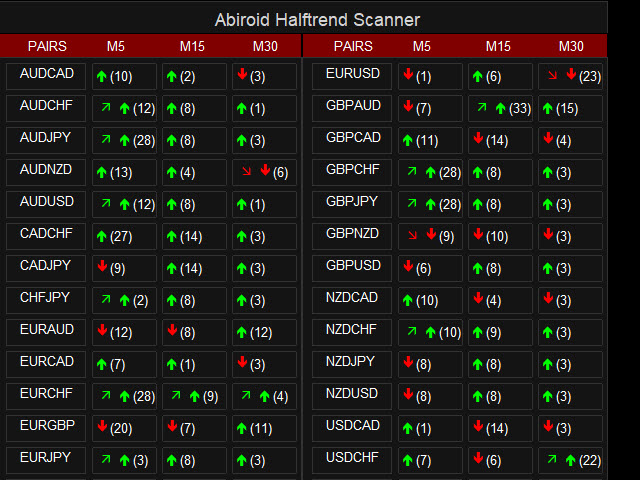
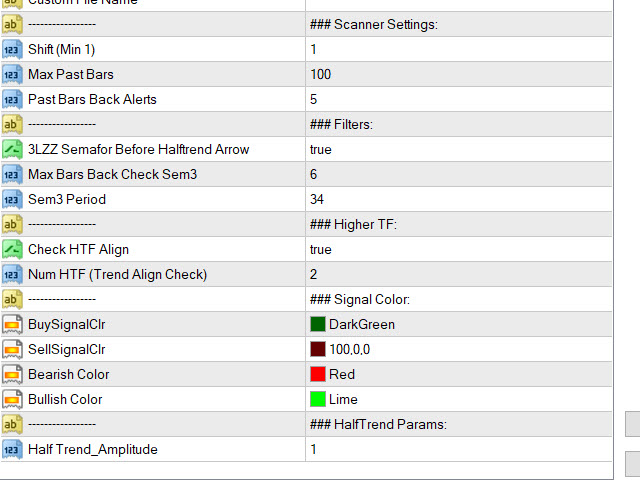
- Halftrend Arrow Scan: Scan Max Past Bars for Halftrend arrows. Show how many bars back the arrow occurred in a bracket
- Past Bars Back Alerts: Num of bars back for which scanner will send alerts
- Halftrend HTF Align: Scan Higher timeframes for Trend Direction of Halftrend Indicator and if trends align show a slanting Green/Red Arrow for Up/Down trend
- Semafor 3 Check: Few bars before Halftrend arrow to validate reversal
Simplistic and easy to use Halftrend scanner.
Please note, that this is not a full trading system. It will help you get initial Halftrend signals. And higher timeframe trend alignment.
And it’s to be used with your existing Halftrend strategies.
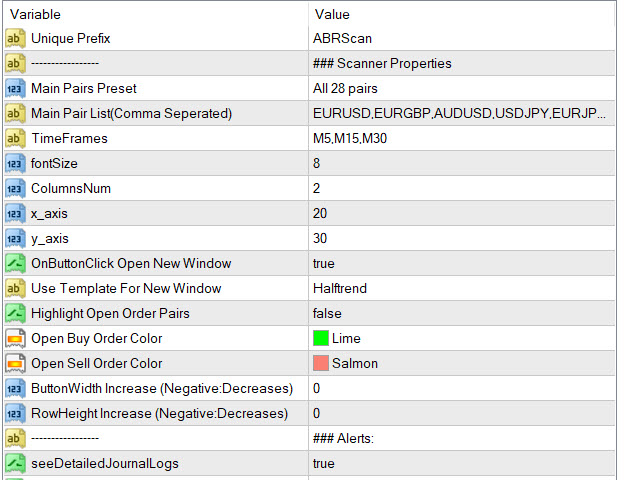
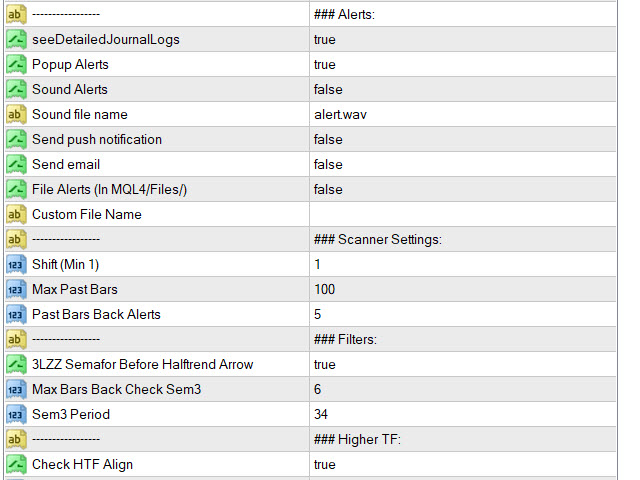
Check HTF Align: Keep true, if you want to check Higher timeframe’s Halftrend direction
Num HTF: Number of Higher timeframes to check for trend alignment with current timeframe.
Suppose current TF is M15 and “Num HTF” is 2. And current Halftrend direction is Bullish. It will check M30 and H1 for Bullish Trend as well. And show a slanting Up Green Arrow if Bullish.
Slanting Down Red arrow is for Bearish Alignment.
Halftrend and Price Cross Check:
If you need to know how long back did price cross Halftrend line (HT-Line). Or if price is still in same direction as trend. And by how many points, then this check will be useful.
By default price crossing HT-Line alerts are off. You can also Show/Hide the Price and HT-Line Distance, Cross Arrows and bars in brackets.
Check HTF Align: Keep true, if you want to check Higher timeframe’s Halftrend direction
Alert only if HTF Align: If true show Halftrend Arrow alerts, only when all selected number of HTF are aligned in same direction
So, if up arrow occurs in current timeframe (say M15), and num of HTF check is 2. Then trend should be upwards in M30 and H1. Only then halftrend arrow alert will be shown.
Num HTF: Number of Higher timeframes to check for trend alignment with current timeframe.
Suppose current TF is M15 and “Num HTF” is 2. And current Halftrend direction is Bullish. It will check M30 and H1 for Bullish Trend as well. And show a slanting Up Green Arrow if Bullish.
Slanting Down Red arrow is for Bearish Alignment.
Filter: 3LZZ Semafor Before Halftrend Arrow:
If true, it will check for a semafor 3 occurring right before halftrend arrow (within Max Bars).
Even if you set “Max Bars Back Check Sem3” to a higher value like 20, make sure that price is still near the Sem3 price, and is on it’s support/resistance.
By the time halftrend arrow occurs.
Halftrend Amplitude: Set to higher value to get halftrend arrows further apart and to get much longer trends.
Shift: Start scanning for halftrend from “Shift” bar to “Max Past Bars“. Shift is 1 by default. But if you are not interested in new signals 1 bar back, then keep Shift to higher value.
Don’t use 0, since halftrend might repaint while forming on current bar. Min possible value is 1.
Past Bars Back Alerts: Number of bars for which previous alerts are also sent. Suppose it is 5. And when you load scanner, it will also give alerts if Halftrend arrow had occurred 5 bars back.
Also Blocks will light up Red/Green if a signal was there within past 5 bars.


Good indicator, I'm satisfied, thanks Abir!