• Aperçu
  • Avis (1)
  • Commentaires (4)
  • Nouveautés

TheStrat Monitor MT5

5

Si vous n'avez pas encore entendu parler de la stratégie de trading Strat , allez sur Google maintenant. Je vous promets que ce ne sera pas une perte de temps et que vous apprendrez probablement de nouvelles astuces, que vous l'utilisiez ou non.

OK, alors maintenant que vous savez ce qu'est TheStrat, vous pourrez comprendre ce que cet indicateur peut faire pour vous.

Principales caractéristiques

En bref, l'indicateur :

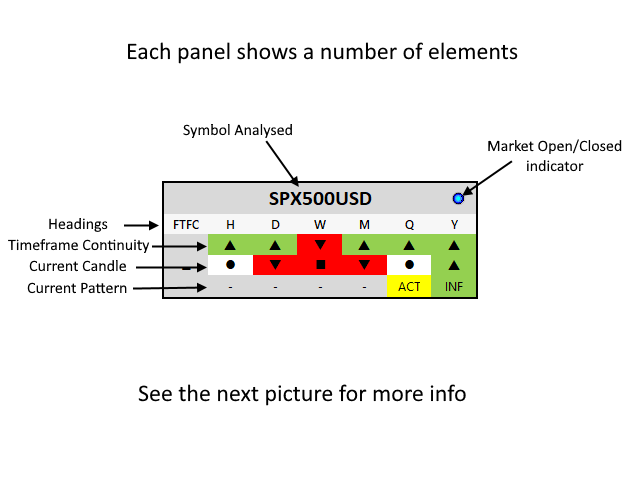
  • Afficher la continuité des délais pour tous les délais pris en charge
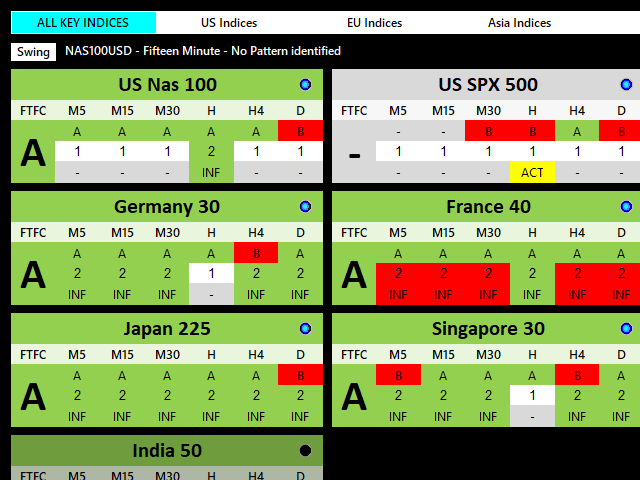
  • Prend en charge deux vues timeset, Day trader et Swing trader
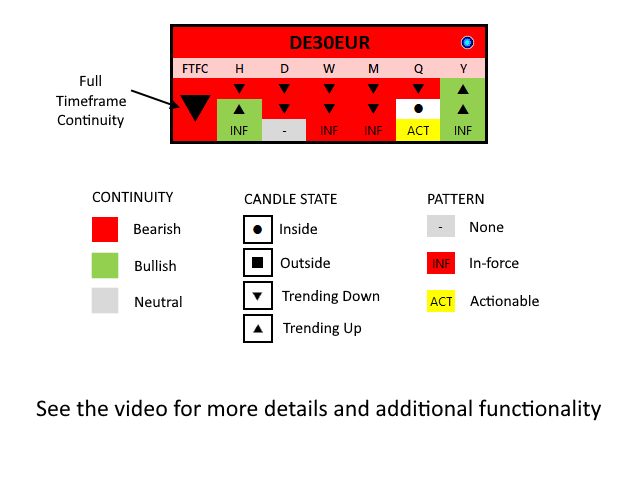
  • Afficher quand la continuité de la période complète est en place pour 4 périodes consécutives
  • Afficher l'état actuel de la bougie pour chaque période
  • Afficher le modèle actuel, le cas échéant, sur toutes les périodes
  • Affiche les modèles en vigueur et exploitables
  • Mise à jour toutes les 5 secondes (configurable à partir de 1 seconde)
  • Vous permet de cliquer sur le panneau pour ouvrir un graphique sur le symbole et la période sélectionnés
  • Vous pouvez choisir quel modèle de graphique sera utilisé pour ouvrir les graphiques
  • Vous choisissez les groupes et les symboles de ces groupes à afficher

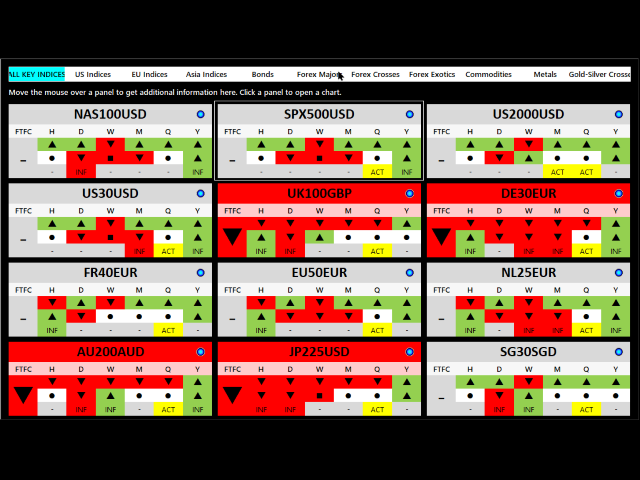
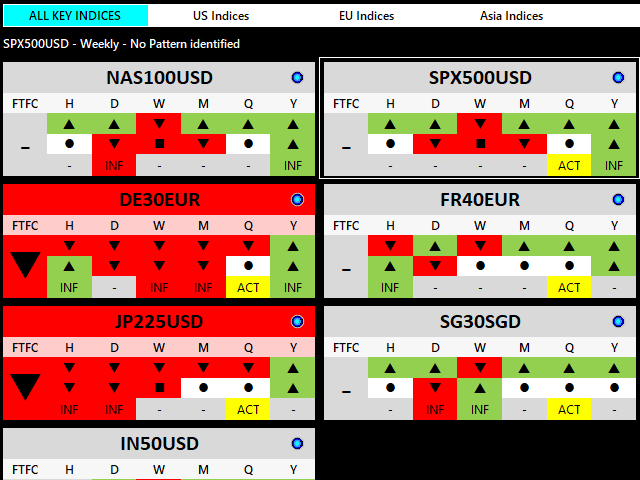
L'indicateur affiche un aperçu instantané de tous les éléments clés de Strat, la continuité de la période, les modèles actuels et les états actuels des bougies, de tout symbole pris en charge par votre courtier. Il le fait pour toutes les périodes prises en charge afin que vous puissiez voir exactement ce qui se passe actuellement sur le marché.

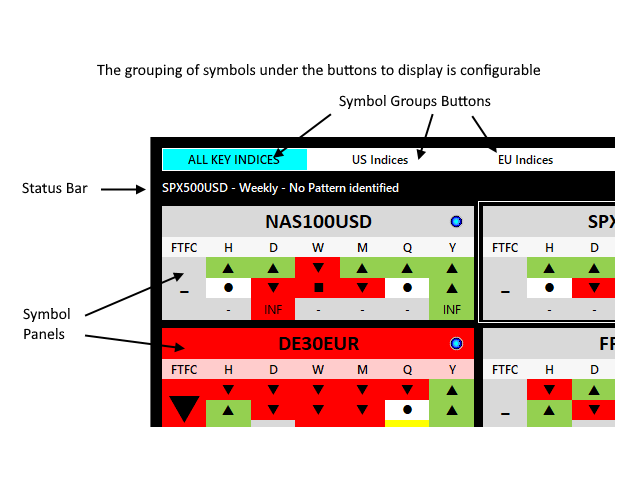
Vous pouvez grouper les symboles comme vous le souhaitez et choisir le titre des boutons relatifs à chaque groupe. Avoir tous les symboles d'un type particulier à l'écran en même temps vous permet de repérer les similitudes dans le groupe, ce qui facilite votre analyse.

Plus d'informations sur le fichier de configuration peuvent être trouvées ici : https://www.mql5.com/en/blogs/post/746142

Si un symbole est actuellement non négociable, le marché fermé, le courtier désactivé, etc., le panneau des symboles affichera les dernières données disponibles mais grisera l'affichage. Une petite icône de lumière LED le montre également.
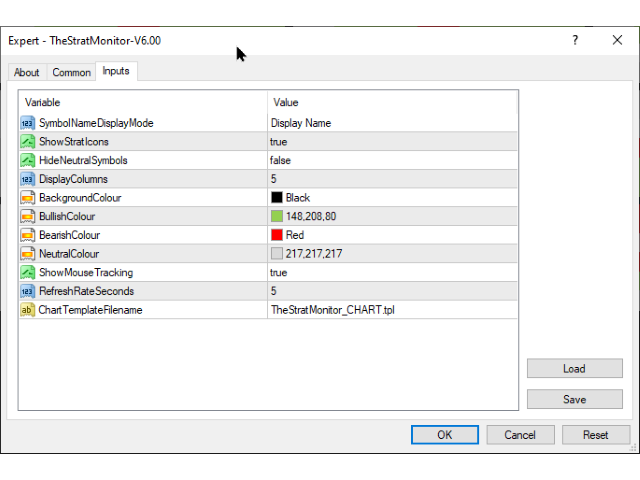
PARAMÈTRES

SymbolNameDisplayMode

Choisissez parmi Nom, Description ou Les deux pour la légende de chaque panneau de symboles.

Réglage de l'heure

Définit la vue de l'intervalle de temps par défaut pour l'indicateur. Choisissez entre Day Trader ou Swing Trader. Vous pouvez modifier ce paramètre à tout moment en cliquant sur le bouton à l'écran.

La vue Day Trader affiche les périodes M5, M15, M30, H1, H4 et D1 sur chaque panneau, tandis que la vue Swing Trader affiche H1, D1, W1, MN1, Q et Y.

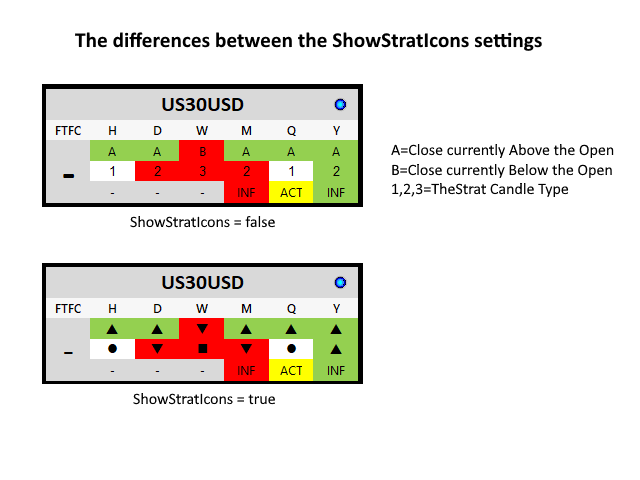
Afficher les icônes Strat

Lorsque cela est vrai, les panneaux affichent des icônes pour la direction de la continuité, les états actuels des bougies, les modèles et le FTFC global.

Masquer les symboles neutres

Lorsque vrai, tous les symboles qui n'ont pas de direction FTFC sont masqués.

AfficherColonnes

Combien de colonnes de panneau souhaitez-vous afficher dans le graphique.

AfficherSuivi de la souris

Lorsqu'il est vrai, un contour est dessiné autour du panneau de symboles sur lequel la souris se trouve actuellement.

RefreshRateSeconds

La valeur par défaut est 5, ce qui signifie simplement que les données de chaque panneau sont mises à jour toutes les 5 secondes. La valeur doit être un entier positif, donc quelque chose de plus grand que 0

NomFichierModèleGraphique

Nom de fichier du modèle à utiliser lors de l'ouverture d'un graphique. Si le modèle donné est introuvable, le modèle par défaut sera utilisé.


La couleur d'arrière-plan

Couleur haussière

Couleur baissière

Couleur neutre

Choisissez la couleur que vous souhaitez utiliser dans la sélection standard de MetaTrader.


Avis 1
renetrader07
135
renetrader07 2023.11.23 18:19 
 

Great help for filtering markets to improve probability

Produits recommandés
Owl Smart Levels MT5
Sergey Ermolov
4.49 (37)
Version MT4   |  FAQ L' indicateur Owl Smart Levels est un système de trading complet au sein d'un seul indicateur qui comprend des outils d'analyse de marché populaires tels que les fractales avancées de Bill Williams , Valable ZigZag qui construit la structure d'onde correcte du marché et les niveaux de Fibonacci qui marquent les niveaux exacts d'entrée. sur le marché et les endroits où prendre des bénéfices. Description détaillée de la stratégie Mode d'emploi de l'indicateur Conseiller-Assis
All about time and price by ICT. This indicator provides a comprehensive view of ICT killzones, Silver Bullet times, and ICT Macros, enhancing your trading experience.  In those time windows price either seeks liquidity or imbalances and you often find the most energetic price moves and turning points. Features: Automatic Adaptation: The ICT killzones intelligently adapt to the specific chart you are using. For Forex charts, it follows the ICT Forex times: In EST timezone: Session: Asia: 20h00-0
Renko System
Marco Montemari
This indicator can be considered as a trading system. It offers a different view to see the currency pair: full timeless indicator, can be used for manual trading or for automatized trading with some expert advisor. When the price reaches a threshold a new block is created according to the set mode. The indicator beside the Renko bars, shows also 3 moving averages. Features renko mode median renko custom median renko 3 moving averages wicks datetime indicator for each block custom notificatio
Order Book, known also as Market Book, market depth, Level 2, - is a dynamically updated table with current volumes of orders to buy and to sell specific financial instument at price levels near Bid and Ask. MetaTrader 5 provides the means for receiving market book from your broker, but in real time only, without access to its history. The indicator OrderBook Cumulative Indicator accumulates market book data online and visualizes them on the chart. In addition, the indicator can show the market
Donchian Channel DC is the indicator of Donchian Channels, that plots maximum and minimum values of a specific period, besides mean value line. It´s possible to configure simple period for analysis and the indicator will plot all three values. You can trade with this indicator as trend or reversal, according to each strategy. Do not let to test others indicators as soon as others expert advisors.
Renko Plus
Eadvisors Software Inc.
With Renko Plus you can use the features in the Indicator functionality, just add it to the Metatrader5 chart.             The Renko chart is a type of chart, developed by the Japanese, that is constructed using price movement rather than standardized prices and time intervals like most charts. It is believed to be named after the Japanese word for bricks, "renga", as the graphic looks like a series of bricks.             A new brick is created when the price moves a specified p
Follow The Line MT5
Oliver Gideon Amofa Appiah
4.4 (30)
This indicator obeys the popular maxim that: "THE TREND IS YOUR FRIEND" It paints a GREEN line for BUY and also paints a RED line for SELL. (you can change the colors). It gives alarms and alerts of all kinds. IT DOES NOT REPAINT and can be used for all currency pairs and timeframes. Yes, as easy and simple as that. Even a newbie can use it to make great and reliable trades. NB: For best results, get my other premium indicators for more powerful and reliable signals. Get them here: https://www.m
FREE
Half ma
Artem Svistunov
The Half ma arrow indicator for the MetaTrader 5 trading terminal is a simple but effective tool that gives a signal about a change in the current trend. The Half ma indicator looks like a solid dynamic line that changes color at the points where the trend changes. At these points, the indicator draws arrows of the corresponding color and direction.The Half ma arrow indicator for the MT5 terminal is not an independent source of input signals. It will be most effective to use it as a trend filte
Le niveau Premium est un indicateur unique avec une précision de plus de 80 % des prédictions correctes ! Cet indicateur a été testé par les meilleurs Trading Specialists depuis plus de deux mois ! L'indicateur de l'auteur que vous ne trouverez nulle part ailleurs ! À partir des captures d'écran, vous pouvez constater par vous-même la précision de cet outil ! 1 est idéal pour le trading d'options binaires avec un délai d'expiration de 1 bougie. 2 fonctionne sur toutes les paires de de
Point Black
Ignacio Agustin Mene Franco
Black Card Pack indicator 5/1 point black It has the strategy of professional bollingers where each arrow gives you a different entry signal. It is used to operate in m1 and in d1 It is used for scalping and intraday, modified for forex markets ! suitable for all pairs modified for synthetic index markets suitable for all pairs! Ideal for volatility and jumps!
This indicator obeys the popular maxim that: "THE TREND IS YOUR FRIEND" It paints a Blue line for BUY and also paints a RED line for SELL. (you can change the colors). It gives alarms and alerts of all kinds. IT DOES NOT REPAINT COLOR and can be used for all currency pairs and timeframes. Yes, as easy and simple as that. Even a newbie can use it to make great and reliable trades. https://www.mql5.com/en/market/product/115553
Trend Monitor MT5
Pavel Zamoshnikov
3.67 (3)
The indicator generates early signals basing on ADX reading data combined with elements of price patterns. Works on all symbols and timeframes. The indicator does not redraw its signals. You see the same things on history and in real time. For better visual perception signals are displayed as arrows (in order not to overload the chart). Features The best results are obtained when the indicator works on two timeframes. For example: M30 – the indicator shows the main trend; M5 – the indicator ge
Noize Absorption Index - is the manual trading system that measures the difference of pressure between bears forces and bulls forces. Green line - is a noize free index that showing curent situation. Zero value of index shows totally choppy/flat market.Values above zero level shows how powerfull bullish wave is and values below zero measures bearish forces.Up arrow appears on bearish market when it's ready to reverse, dn arrow appears on weak bullish market, as a result of reverse expectation.
TrendDetect
Pavel Gotkevitch
The Trend Detect indicator combines the features of both trend indicators and oscillators. This indicator is a convenient tool for detecting short-term market cycles and identifying overbought and oversold levels. A long position can be opened when the indicator starts leaving the oversold area and breaks the zero level from below. A short position can be opened when the indicator starts leaving the overbought area and breaks the zero level from above. An opposite signal of the indicator can
HMA Trend Professional MT5
Pavel Zamoshnikov
4.4 (5)
Improved version of the free HMA Trend indicator (for MetaTrader 4) with statistical analysis. HMA Trend is a trend indicator based on the Hull Moving Average (HMA) with two periods. HMA with a slow period identifies the trend, while HMA with a fast period determines the short-term movements and signals in the trend direction. The main differences from the free version: Ability to predict the probability of a trend reversal using analysis of history data. Plotting statistical charts for analyz
Renko Gold
Ignacio Agustin Mene Franco
Renko Gold! clearly indicates the floors and ceilings where it goes from 4 lines, the line below that marks the floor in green confirming with the thinnest line clarifies the purchase entry, the same is for sale, the top line marks the ceiling and the thinnest red line marks the sale, This indicator works for all temporalities! For Forex and Synthetic Indices markets! It also works for crypto markets! Good profit! World Investor.
Ichimoku Aiko MTF
Michael Jonah Randriamampionontsoa
Ichimoku Aiko MTF is a collection of technical indicators that show support and resistance levels, as well as momentum and trend direction. It is a multi-timeframe indicator so you don't need to change the chart timeframe when you want to see the ichimoku clouds on a higher timeframe.  eg. The chart timeframe is M15 and you want to see on the M15 timeframe chart the H1 ichimoku indicators (the ichimoku in Metatrader can't do that) that's why you need to use Ichimoku Aiko MTF.
Indicator and Expert Adviser  EA Available in the comments section of this product. Download with Indicator must have indicator installed for EA to work. Mt5 indicator alerts for bollinger band and envelope extremes occurring at the same time. Buy signal alerts occur when A bullish candle has formed below both the lower bollinger band and the lower envelope  Bar must open and close below both these indicators. Sell signal occur when A bear bar is formed above the upper bollinger band and upp
The standard Bollinger Bands indicator has been improved by integrating additional indications from the Standard Deviation indicator (StdDev), which gives an additional filter for confirming trading signals. In addition, the color of the indicator's lines shows the beginning of a trend, its development and exhaustion. This indicator has a signal block that notifies the trader of the beginning of the trend on any time frame to which it is attached. Settings Type of messages - select the type of
Supertrend   indicator uses a combination of a moving average and average true range to detect the trend of a trading instrument. Supertrend indicator for MetaTrader 5 easily shows the trend as a line following the price. You can use the second my indicator: You will see 3 supertrends and EMA 200 lines on the screen. Working with my product : https://www.mql5.com/en/market/product/80692
Range Target
Ignacio Agustin Mene Franco
Range Target! indicator that marks the depletion of strength of the candle where it touches the floor and catches a trend, whether it is up or down The indicator has two support lines where it marks the floor and the ceiling. where on the same line marks the entry for rise or fall, the lines have Gold and Blue colors the gold line shows the purchase the blue line shows the sale works for any season works for forex markets works for synthetic index markets! Good Profit, World Investor.
Big Player Range
Thalles Nascimento De Carvalho
5 (2)
Bienvenue sur l'indicateur "BigPlayerRange", un outil d'analyse technique développé pour identifier les zones d'intérêt significatives des institutions financières sur les marchés. Cet indicateur offre une analyse précise des plages de prix où les principaux acteurs du marché démontrent une activité et un intérêt considérables. Principales caractéristiques : 1. Cartographie des zones d'intérêt institutionnel : "BigPlayerRange" met en évidence avec précision les zones du graphique où les in
Tout d'abord, il convient de souligner que cet outil de trading est un indicateur non repeint, non redessiné et non retardé, ce qui le rend idéal pour le trading professionnel. Cours en ligne, manuel utilisateur et démonstration. L'indicateur Smart Price Action Concepts est un outil très puissant à la fois pour les nouveaux et les traders expérimentés. Il regroupe plus de 20 indicateurs utiles en un seul, combinant des idées de trading avancées telles que l'analyse du trader Inner Circle et
One of the most famous phrases in the trading world is "The Trend Is Your Friend". Trading following the current trend is one of the most successful ways in terms of probability. The hard part of it is to recognize when the market is trending or not. that's the role of our indicator we called The Trend Is Your Friend Until It Is Not. Apart from its big name it is really easy to use and see when the market is trending or ranging. Through a little window of 3 colors you will identify if the ma
LT Rainbow Trend
Thiago Duarte
5 (1)
Do you, like me, like to trade with the trend? Then this indicator will help you! Rainbow Trend is a trend indicator, which uses several Moving Averages on the chart. It measures different trend strenght zones for different periods: very long term, long term, mid term, short term and very short term. Each zone has its color, and it is possible to have sound alert when the prices leaves a zone and enters another. Its configuration is very simple. If you find any bug or have any suggestions, co
Cet indicateur vous montrera les valeurs TP et SL (dans cette devise) que vous avez déjà définies pour chaque commande sur les graphiques (fermées à la ligne de transaction/commande) qui vous aideront beaucoup à estimer vos profits et pertes pour chaque commande. Et il vous montre également les valeurs PIP. le format affiché est "Valeurs monétaires de nos valeurs de profit ou de perte / PIPs". La valeur TP sera affichée en couleur verte et la valeur SL sera affichée en couleur rouge. Pour tou
Time And Sales Delta
Evgeny Shevtsov
5 (2)
The indicator displays the delta and the cumulative delta based on the "Time & Sales" deals list data. In addition to the standard timeframes, the indicator displays data regarding the seconds timeframes (S5, S10, S15, S20, S30) to choose from. Using the rectangle, user can select an arbitrary area in the indicator subwindow to view the ratio of the volumes of deals of buyers and sellers within this area. Indicator features: The indicator works correctly only on those trading symbols for whi
This is Gekko's Cutomized Cutomized Average Directional Index (ADX), a customized version of the famous ADX indicator. Use the regular ADX and take advantage two entry signals calculations and different ways of being alerted whenever there is potential entry or exit point. Inputs Period: Period for the ADX calculation; PlotSignalType: How will the indicator calculate entry (swing) signals: 1- ShowSwingsOnTrendLevel : Show Signals for Trend Confirmation Swings; 2- ShowSwingsOnTrendLevelDirectio
Slopes are an increasingly key concept in Technical Analysis. The most basic type is to calculate them on the prices, but also on technical indicators such as moving averages and the RSI. In technical analysis, you generally use the RSI to detect imminent reversal moves within a range. In the case of the Blue indicator, we are calculating the slope of the market price and then calculating the RSI of that slope in order to detect instances of reversal. The Blue indicator is therefore used
Les acheteurs de ce produit ont également acheté
Atomic Analyst MT5
Issam Kassas
5 (13)
Tout d'abord, il convient de souligner que cet indicateur de trading n'est ni repainting, ni redrawing et ne présente aucun délai, ce qui le rend idéal à la fois pour le trading manuel et automatisé. Manuel de l'utilisateur : réglages, entrées et stratégie. L'Analyste Atomique est un indicateur d'action sur les prix PA qui utilise la force et le momentum du prix pour trouver un meilleur avantage sur le marché. Équipé de filtres avancés qui aident à éliminer les bruits et les faux signaux, et à
FX Volume MT5
Daniel Stein
4.94 (17)
Obtenez votre mise à jour quotidienne du marché avec des détails et des captures d'écran via notre Morning Briefing ici sur mql5 et sur Telegram ! FX Volume est le PREMIER et SEUL indicateur de volume qui fournit un VRAI aperçu du sentiment du marché du point de vue d'un courtier. Il fournit des informations impressionnantes sur la façon dont les acteurs institutionnels du marché, comme les courtiers, sont positionnés sur le marché des changes, bien plus rapidement que les rapports COT. Voir c
74% discount for the next 10 buyers (original price $605): 1 left Get a 50% bonus by buying (or even renting) any of our products. After buying (or renting), send a message for more information. 3 Indicators in 1 indicator Strategy based on price action Made specifically for the best forex currency pairs Can be used in the best time frame of the market at a very reasonable price This indicator is basically 3 different indicatos . But we have combined these 3 indicators in 1 indicator so th
Professional Scalping Tool on Deriv Attention! The indicator will be sold in limited quantities!!! The previous 5 copies were sold for $250 The remaining 4 copies will be sold for $350 The next price is $500 Description: This trading indicator is designed for professional traders focused on scalping. Designed with the market in mind, it provides highly accurate spike trading signals. It works on the M1 timeframe and supports the following symbols: Boom 300 Index, Boom 500 Index, Boom 1000 I
XQ Indicator MetaTrader 5
Marzena Maria Szmit
5 (1)
Step into the realm of Forex trading with confidence and precision using XQ, a cutting-edge Forex indicator designed to elevate your trading game to unprecedented heights. Whether you're a seasoned trader or just stepping into the world of currency exchange, XQ Forex Indicator empowers you with the insights and signals needed to make informed trading decisions. The signal conditions are a combination of three indicators, and XQ Forex Indicator only display  medium and long-term trends . The ind
Advanced Supply Demand MT5
Bernhard Schweigert
4.53 (15)
La meilleure solution pour tout commerçant débutant ou expert ! Cet indicateur est un outil de trading unique, de haute qualité et abordable car nous avons intégré un certain nombre de fonctionnalités propriétaires et une nouvelle formule. Avec cette mise à jour, vous pourrez afficher des zones à double horaire. Vous pourrez non seulement afficher un TF plus élevé, mais afficher les deux, le graphique TF, PLUS le TF supérieur : AFFICHAGE DES ZONES NICHÉES. Tous les traders Supply Demand vont ado
Introducing the South African Sniper indicator created by a small group of traders with a few years trading trading the financial market profitably . This is a plug and play indicator that provides you with  BUY and SELL (SNIPER ENTRY) signals with TARGET and trail stops. The indicator Works with all MT5 trading instruments. The indicator uses previous  chart data as receipt to speculate on future market moves.
FxaccurateLS
Shiv Raj Kumawat
WHY IS OUR FXACCCURATE LS MT5 THE PROFITABLE ? PROTECT YOUR CAPITAL WITH RISK MANAGEMENT Gives entry, stop and target levels from time to time. It finds Trading opportunities by analyzing what the price is doing during established trends. POWERFUL INDICATOR FOR A RELIABLE STRATEGIES We have made these indicators with a lot of years of hard work. It is made at a very advanced level. Established trends provide dozens of trading opportunities, but most trend indicators completely ignore them!
The Volume by Price Indicator for MetaTrader 5 features Volume Profile and Market Profile TPO (Time Price Opportunity). Get valuable insights out of currencies, equities and commodities data. Gain an edge trading financial markets. Volume and TPO histogram bar and line charts. Volume Footprint charts. TPO letter and block marker charts including split structures. Versatile segmentation and compositing methods. Static, dynamic and flexible ranges with relative and/or absolute visualizations. Lay
MetaForecast M5
Vahidreza Heidar Gholami
5 (2)
MetaForecast prédit et visualise l'avenir de n'importe quel marché en se basant sur les harmoniques des données de prix. Bien que le marché ne soit pas toujours prévisible, s'il y a un motif dans les prix, MetaForecast peut prédire l'avenir aussi précisément que possible. Comparé à d'autres produits similaires, MetaForecast peut générer des résultats plus précis en analysant les tendances du marché. Paramètres d'entrée Past size (Taille passée) Spécifie le nombre de barres que MetaForecast uti
Golden Gate Algo MT5
James David Lane
4 (6)
40% DE RÉDUCTION POUR NOËL ! AUGMENTATION DES PRIX À 250 $ LE 1er JANVIER ! Présentation de GoldenGate Entries : une solution de trading de pointe ! Découvrez une approche révolutionnaire du trading avec GoldenGate Entries (GGE), un indicateur avancé conçu pour améliorer votre expérience de trading. GGE offre un ensemble complet de fonctionnalités pour donner aux utilisateurs la précision et la confiance nécessaires dans leurs décisions de trading. Paires : Toutes (FX - Matières premières
TrendMaestro5
Stefano Frisetti
note: this indicator is for METATRADER4, if you want the version for METATRADER5 this is the link:  https://www.mql5.com/it/market/product/108106 TRENDMAESTRO ver 2.4 TRENDMAESTRO recognizes a new TREND in the bud, he never makes mistakes. The certainty of identifying a new TREND is priceless. DESCRIPTION TRENDMAESTRO identifies a new TREND in the bud, this indicator examines the volatility, volumes and momentum to identify the moment in which there is an explosion of one or more of these data a
This is arguably the most complete harmonic price formation auto-recognition indicator you can find for the MetaTrader Platform. It detects 19 different patterns, takes fibonacci projections as seriously as you do, displays the Potential Reversal Zone (PRZ) and finds suitable stop-loss and take-profit levels. [ Installation Guide | Update Guide | Troubleshooting | FAQ | All Products ] It detects 19 different harmonic price formations It plots primary, derived and complementary Fibonacci p
TPA True Price Action indicator reveals the true price action of the market makers through 100% non-repainting signals strictly at the close of a candle! TPA shows entries and re-entries, every time the bulls are definitely stronger than the bears and vice versa. Not to confuse with red/green candles. The shift of power gets confirmed at the earliest stage and is ONE exit strategy of several. There are available now two free parts of the TPA User Guide for our customers. The first "The Basics"
NakaSide
Ricardo De Andrade Nakano
Nous vous présentons NakaSide - Votre indicateur ultime d'opportunités sur le marché ! Fatigué de manquer des occasions de trading rentables ? Prêt à porter votre trading au niveau supérieur ? Ne cherchez pas plus loin, car NakaSide est là pour révolutionner votre façon de trader ! NakaSide n'est pas juste un autre indicateur ordinaire ; c'est votre arme secrète pour naviguer avec confiance et précision dans le monde complexe des marchés financiers. Avec ses algorithmes avancés et sa techno
L'indicateur de Carré Gann est un puissant outil d'analyse du marché basé sur l'article "Formule Mathématique pour les Prédictions de Marché" écrit par W.D. Gann. Cet outil utilise des concepts mathématiques et des théories de Gann pour réaliser une analyse précise du marché. Il utilise les carrés de 144, 90, 52 et aussi le carré de 9. De plus, il intègre la méthode du  pour le carré de 9 et sa relation avec les canaux et le modèle en étoile de ce carré. Manuel d'Utilisateur et Application : Ava
Bill Williams Advanced
Siarhei Vashchylka
5 (5)
Bill Williams Advanced is designed for automatic chart analysis using Bill Williams' "Profitunity" system. The indicator analyzes four timeframes at once. Manual (Be sure to read before purchasing) Advantages 1. Automatically analyzes the chart using the "Profitunity" system of Bill Williams. The found signals are placed in a table in the corner of the screen. 2. Equipped with a trend filter based on the Alligator indicator. Most of the system signals are recommended to be used only accordi
Our indicator will help you to make a decision whether to Buy or Sell , including where to set the Take Profit and Stop Loss . The Buy/Sell signal will not redraw nor repaint until new signal occurs. The Take Profit and Stop Loss will change following the market conditions. Our indicator will give alert to your mobile/handphone when new buy/sell signal arrive. For best result, combine this indicator with your knowledge on price action and support & resistance, also don't forget to watch for the
Good day! I present to you a trading technical indicator for Deriv broker synthetic indices. This indicator ONLY works with the following indices: Boom 300 Index Boom 500 Index Boom 1000 Index Crash 300 Index Crash 500 Index Crash 1000 Index The indicator was created to give signals to open medium-term trades in the direction of Spikes. But you can open trades in the opposite direction to Spikes, at your own risk. Trade only on M1. Other TFs do not guarantee the correct operation of the indic
Eng Gold
Ely Alkrar Xshkaky
ENG-GOLD Scalper It is an auxiliary indicator that identifies potential targets and determines the place of entry with a stop loss that works on Heiken Ashi candles  The green lines are usually the targets, the red lines are the stop loss, and the yellow lines are the entry location.  This file is recognized on small and medium frames, usually less than the watch frame I highly recommend using XAUUSD US100 US30 USOIL 
IVISTscalp5
Vadym Zhukovskyi
5 (3)
Nous vous présentons l'indicateur iVISTscalp5, qui est non seulement unique, mais également efficace dans les opérations de trading. Cet indicateur est basé sur des données temporelles et est le résultat de nombreuses années d'expérience et d'analyse approfondie des marchés financiers. L'indicateur iVISTscalp5 est un excellent outil pour le trading manuel. La commodité, la simplicité et la visualisation - toute la complexité est cachée à l'intérieur. Nous avons simplifié au maximum les paramètre
PZ Swing Trading MT5
PZ TRADING SLU
5 (4)
Swing Trading is the first indicator designed to detect swings in the direction of the trend and possible reversal swings. It uses the baseline swing trading approach, widely described in trading literature. The indicator studies several price and time vectors to track the aggregate trend direction and detects situations in which the market is oversold or overbought and ready to correct. [ Installation Guide | Update Guide | Troubleshooting | FAQ | All Products ] Profit for market swings with
SMCpro
Arief
5 (1)
SMCpro MT5  Original Price  $440   ---  Currently Price  40% OFF  ( for unlimited use ) Hello World! Introducing.. SMCpro tool and Indicator for  MetaTrader 5 , a cutting-edge feature designed to revolutionize your trading experience. With innovative ICT Smart Money Concept, you gain unparalleled insight into market dynamics, empowering you to make informed trading decisions like never before. Built on the foundation of advanced algorithms and real-time data analysis, SMCpro tool and Indicat
VTrende Pro
Andrii Diachenko
5 (1)
VTrende Pro - MTF indicator for trend trading with a display panel for MT5 *** Videos can be translated into any language using subtitles (video language - Russian) Although the signals of the VTrende Pro indicator can be used as signals of a full-fledged trading system, it is recommended to use them in conjunction with the Bill Williams TS. VTrende Pro is an extended version of the VTrende indicator. Difference between Pro version and VTrende: - Time zones - Signal V - signal 1-2 waves
RAD CRITICAL LEVES RAD indicator tracks “Relevant Volume” in real time, identifying accumulation and distribution processes, projecting them in the chart as SUPPORT or RESISTANCE zones. Natural   support   and resistance levels are generated by Volume Accumulation and Distribution processes. As these processes evolve, levels at which the relevant volume in the market place is positioned, become difficult areas to cross upwards or downwards. By using this information, traders can identify very s
[ MT4 Version ] Backtesting Simulator Are you tired of spending months on demo or live accounts to test your trading strategies? The Backtesting Simulator is the ultimate tool designed to elevate your backtesting experience to new heights. Utilizing Metatrader historical symbol information, it offers an unparalleled simulation of real market conditions. Take control of your testing speed, test ideas quickly or at a slower pace, and witness remarkable improvements in your testing performance.
Tricky to find and scarce in frequency, divergences are one of the most reliable trading scenarios. This indicator finds and scans for regular and hidden divergences automatically using your favourite oscillator. [ Installation Guide | Update Guide | Troubleshooting | FAQ | All Products ] Easy to trade Finds regular and hidden divergences Supports many well known oscillators Implements trading signals based on breakouts Displays suitable stop-loss and take-profit levels Configurable oscilla
Introduction to X3 Chart Pattern Scanner X3 Cherart Pattern Scanner is the non-repainting and non-lagging indicator detecting X3 chart patterns including Harmonic pattern, Elliott Wave pattern, X3 patterns, and Japanese Candlestick patterns. Historical patterns match with signal patterns. Hence, you can readily develop the solid trading strategy in your chart. More importantly, this superb pattern scanner can detect the optimal pattern of its kind. In addition, you can switch on and off individu
The indicator is designed to close positions on the market in time. For example: to take profits ahead of schedule if the price has not reached TakeProfit, and the market is turning around. The indicator analyzes the momentum, not the trend. He does not give any information about the trend. The indicator is well suited for finding divergence. The Ershov 38 Parrots indicator dynamically adjusts to the market and detects price movement impulses of medium and high amplitude. It almost does not rea
Cet indicateur est une méthode d'analyse de marché basée sur l'article "Formule mathématique pour les prédictions de marché" écrit par W.D. Gann en fonction du carré de neuf et du carré de 144 méthodes. Manuel de l'Utilisateur: Add Your review And contact us to get it Vous pouvez acheter la version complète MT4 à partir de : https://www.mql5.com/en/market/product/15316 Vous pouvez tester gratuitement sur MT4 : https://www.mql5.com/en/market/product/15320?source=Site +Profile+Seller#!t
Plus de l'auteur
Multi Chart Crosshairs
Robert Gerald Wood
5 (2)
This indicator is designed to make reviews of many charts on different timescales quicker, and easier to do. Track Time and Price across multiple charts Change Symbol on one chart and all other charts of the same symbol will be changed too. Easy to use, quick to master The indicator allows you to identify the price and time where the mouse pointer is on the current chart, across all other charts open on the same Symbol. This allows you to quickly see information on multiple charts whereas normal
Multi Chart Crosshairs MT5
Robert Gerald Wood
5 (7)
Cet indicateur est conçu pour rendre les révisions de nombreux graphiques sur différentes échelles de temps plus rapides et plus faciles à faire. Suivez le temps et le prix sur plusieurs graphiques Changer de symbole sur un graphique et tous les autres graphiques du même symbole seront également modifiés. Facile à utiliser, rapide à maîtriser L'indicateur vous permet d'identifier le prix et l'heure où se trouve le pointeur de la souris sur le graphique actuel, sur tous les autres graphiques ouve
L'épuisement de la fourchette se produit lorsque le prix atteint ou dépasse la fourchette attendue pour la période en cours. À ces niveaux, le prix commence à perdre son élan par rapport au début de la période, c'est donc un bon point pour vous assurer que vous ne prenez pas de nouvelles positions. Cet indicateur vous montrera où cela est susceptible de se produire sur votre graphique, montrant les niveaux pour les périodes quotidiennes, hebdomadaires et mensuelles. Lorsque vous voyez un prix dé
Active Pivot Levels
Robert Gerald Wood
5 (1)
Les niveaux pivots sont un niveau technique bien établi et reconnu sur tous les marchés. Cet indicateur dessinera les pivots trimestriels, mensuels, hebdomadaires, quotidiens et quadri-horaires actuels sur le graphique, pour n'importe quel symbole. Vous pouvez également afficher les niveaux de support et de résistance pour chaque période et choisir lequel afficher des niveaux 1 à 4.     Choisissez le type de pivot parmi : Standard Camarilla DeMark boisé Fibonacci Veuillez noter que les pivots De
TheStrat Monitor
Robert Gerald Wood
3 (2)
If you've not already learnt about The Strat trading strategy , go google it now. I promise it won't be a waste of your time, and you will likely learn some new tricks whether you use it or not. OK, so now you know what TheStrat is, you will be able to understand what this indicator can do for you. Key Features In short, the Indicator will: Show Timeframe Continuity for all supported timeframes Supports two timeset views, Day trader and Swing trader Show when Full Timeframe Continuity is in pl
Chart Drawing Cloner
Robert Gerald Wood
5 (4)
Ce script vous permet de copier des objets de dessin de tout type, tels que des lignes de tendance, des retracements de Fibonachi, etc., vers un ou plusieurs autres graphiques. Par défaut, le script copiera tous les objets du graphique actuel, c'est-à-dire le graphique auquel le script a été appliqué, vers tout autre graphique du même symbole actuellement chargé. Paramètres Délai de destination Lorsqu'il est défini sur autre chose que PERIOD_CURRENT, il copiera les objets dans n'importe qu
FREE
TheStrat Levels
Robert Gerald Wood
This indicator draws the prior Highs and Lows for multiple timeframes, and can display potential Take Profit and Stop Loss levels. In Rob Smith's # The Strat   terms,   these are potential entry points, or alternatively potential targets for open positions. I like to use them in both ways. On a lower timeframe, say 5 minutes to get a good entry on a daily or weekly level, and then as a potential target. Very small stops required giving an excellent risk/reward ratio. Please watch the DEMO video
TheStrat Candles
Robert Gerald Wood
4.5 (2)
Cet indicateur dessinera une étiquette au-dessus ou au-dessous de chaque bougie en fonction de       de Rob Smith       La Strat       à mesure qu'ils évoluent au fil du temps sur votre graphique. Au fur et à mesure que le prix évolue, une bougie peut basculer entre trois états. Lorsque la bougie s'ouvre pour la première fois, si elle se trouve complètement dans les bougies précédentes haut et bas, elle commencera comme un type 1. Au fil du temps, si elle casse le haut ou le bas de la bougie
TheStrat Levels MT5
Robert Gerald Wood
5 (1)
This indicator draws the prior Highs and Lows for multiple timeframes, and can display potential Take Profit and Stop Loss levels. In Rob Smith's # The Strat  terms, these are potential entry points, or alternatively potential targets for open positions. I like to use them in both ways. On a lower timeframe, say 5 minutes to get a good entry on a daily or weekly level, and then as a potential target. Very small stops required giving an excellent risk/reward ratio. Key Features  - Levels from Ho
TheStrat Patterns
Robert Gerald Wood
This indicator will draw patterns based on Rob Smith's The Strat as they emerge in real time on your chart. As price evolves, TheStrat offers 18 distinct price action patterns that can help you get good entries in the market. Each pattern involves two or three candles, and this indicator will draw a bounding box around the candles and name the pattern. The indicator also shows when a potential setup is forming, known by stratters as an Actionable signal. Candles Each candle is defined by i
This indicator will draw a label above or below each candle based on   Rob Smith's   The Strat   as they develop over time on your chart. As price evolves, a candle can switch between three states. When the candle first opens, if it sits completely within the previous candles high and low, then it will start as a Type 1. As time moves on, if it breaks either the high or low of the previous candle, it will be come a type 2, and should the price action be volatile and directionless, it may then
TheStrat TFC Monitor MT5
Robert Gerald Wood
5 (1)
Lorsque vous négociez avec   The Strat   , il est important de garder un œil sur plusieurs délais. Cet indicateur affichera l'état quotidien, hebdomadaire, mensuel et trimestriel de la bougie actuelle pour chaque période. Une icône en forme de cercle indique que la bougie sur cette période est actuellement un Inside, ou Type 1 dans la terminologie TheStrat. Une bougie Inside Day consolide l'action des prix, et nous recherchons une cassure de la fourchette. Une icône Triangle, pointant vers le ha
A simple script that can delete all the drawing objects on a chart, or just the objects of a specific type. Settings: DeleteObjectsOfType By default the value will be blank which means ALL drawing objects on the chart will be deleted. If you only wish to delete specific types of drawing object, change this setting to the type of object to delete. For example, Fibonacci Retracement, Text, Label or Trend Line. Please see the demonstration video for more information.
FREE
J'ai créé cet indicateur simple pendant que j'apprenais TheStrat de Rob Smith et je le trouve si utile que j'ai pensé le partager avec vous. Si vous le trouvez utile, veuillez consulter les autres indicateurs que j'ai publiés sur MQL5. L'indicateur dessine simplement une seule ligne sur le graphique indiquant le niveau de prix que vous sélectionnez dans une période plus longue. En utilisant les paramètres, vous avez un contrôle total sur la période qu'il affiche, mais par   défaut, il calcule lu
FREE
This script allows you to toggle the "Show Trade Levels" option, but for the current chart only. Normally, you can only change the setting using the Options -> Chart menu for ALL charts, but this script allows you to do it for a SINGLE chart. I'm using it when I take screenshots, because most of the time I'm not trying to show the trades, just some functionality of one of my other tools. Iif you need that functionality, then this script is very helpful! If the script helps you, please let me
FREE
TheStrat FTFC
Robert Gerald Wood
FTFC fait référence à Full Timeframe Continuity tel que défini par   The Strat   de Rob Smith. Cet indicateur dessine deux lignes sur le graphique, l'une des plus élevées des niveaux d'ouverture trimestriels, mensuels, hebdomadaires, quotidiens ou horaires, et la seconde des plus basses de ces valeurs. Cela vous donne un canal au-dessus ou au-dessous duquel le trading est plus susceptible d'être très fortement dans une direction. Entre les lignes, l'action des prix sera plus agitée et vous pourr
Les marchés aiment vraiment les chiffres ronds et ils agissent souvent comme un soutien dans un marché en baisse ou comme une résistance lorsque les prix augmentent. Cet indicateur est conçu pour dessiner des niveaux de prix à des valeurs rondes. Il le fait automatiquement, mais vous avez également la possibilité de remplacer cela et de déterminer les niveaux que vous souhaitez voir. Un niveau rond peut être aussi simple que des étapes de 10, donc 10, 20, 30 etc. ou si vous travaillez avec le Fo
Lorsque vous négociez avec   The Strat   , il est important de garder un œil sur plusieurs délais. Cet indicateur affichera l'état quotidien, hebdomadaire, mensuel et trimestriel de la bougie actuelle pour chaque période. Une icône en forme de cercle indique que la bougie sur cette période est actuellement un Inside, ou Type 1 dans la terminologie TheStrat. Une bougie Inside Day consolide l'action des prix, et nous recherchons une cassure de la fourchette. Une icône Triangle, pointant vers le ha
ATR Extremes
Robert Gerald Wood
L'Average True Range (ATR) est un indicateur couramment utilisé qui mesure la quantité de mouvement du prix sur une durée définie. Cependant, la valeur qu'il donne n'est définie dans aucune sorte de limite, ce qui rend son utilisation pour autre chose que des calculs de stop loss ou de take profit, presque impossible. Cet indicateur est votre indicateur ATR standard, mais nous avons introduit des démarcations en centiles afin que vous puissiez voir les extrêmes. Vous pouvez choisir entre le
Range Exhaustion
Robert Gerald Wood
L'épuisement de la fourchette se produit lorsque le prix atteint ou dépasse la fourchette attendue pour la période en cours. À ces niveaux, le prix commence à perdre son élan par rapport au début de la période, c'est donc un bon point pour vous assurer que vous ne prenez pas de nouvelles positions. Cet indicateur vous montrera où cela est susceptible de se produire sur votre graphique, montrant les niveaux pour les périodes quotidiennes, hebdomadaires et mensuelles. Lorsque vous voyez un prix dé
TheStrat FTFC MT5
Robert Gerald Wood
FTFC fait référence à Full Timeframe Continuity tel que défini par   The Strat   de Rob Smith. Cet indicateur dessine deux lignes sur le graphique, l'une des plus élevées des niveaux d'ouverture trimestriels, mensuels, hebdomadaires, quotidiens ou horaires, et la seconde des plus basses de ces valeurs. Cela vous donne un canal au-dessus ou au-dessous duquel le trading est plus susceptible d'être très fortement dans une direction. Entre les lignes, l'action des prix sera plus agitée et vous pourr
This indicator will draw patterns based on   Rob Smith's   The Strat   as they emerge in real time on your chart. As price evolves,   TheStrat   offers 18 distinct price action patterns that can help you get good entries in the market. Each pattern involves two or three candles, and this indicator will draw a bounding box around the candles and name the pattern. The indicator also shows when a potential setup is forming, known by stratters as an Actionable signal. Candles Each candle is de
Les niveaux pivots sont un niveau technique bien établi et reconnu sur tous les marchés. Cet indicateur dessinera les pivots trimestriels, mensuels, hebdomadaires, quotidiens et quadri-horaires actuels sur le graphique, pour n'importe quel symbole. Vous pouvez également afficher les niveaux de support et de résistance pour chaque période et choisir lequel afficher des niveaux 1 à 4.     Choisissez le type de pivot parmi : Standard Camarilla DeMark boisé Fibonacci Veuillez noter que les pivots De
Les marchés aiment vraiment les chiffres ronds et ils agissent souvent comme un soutien dans un marché en baisse ou comme une résistance lorsque les prix augmentent. Cet indicateur est conçu pour dessiner des niveaux de prix à des valeurs rondes. Il le fait automatiquement, mais vous avez également la possibilité de remplacer cela et de déterminer les niveaux que vous souhaitez voir. Un niveau rond peut être aussi simple que des étapes de 10, donc 10, 20, 30 etc. ou si vous travaillez avec le Fo
ATR Extremes MT5
Robert Gerald Wood
L'Average True Range (ATR) est un indicateur couramment utilisé qui mesure la quantité de mouvement de prix sur une durée définie. Cependant, la valeur qu'il donne n'est définie dans aucune sorte de limite, ce qui rend son utilisation pour autre chose que des calculs de stop loss ou de take profit, presque impossible. Cet indicateur est votre indicateur ATR standard, mais nous avons introduit des démarcations en centiles afin que vous puissiez voir les extrêmes. Vous pouvez choisir entre les cen
Filtrer:
renetrader07
135
renetrader07 2023.11.23 18:19 
 

Great help for filtering markets to improve probability

Robert Gerald Wood
4299
Réponse du développeur Robert Gerald Wood 2023.11.23 18:20
Thanks for the review, and very happy you like the indicator.
Répondre à l'avis
Version 1.21 2021.10.22
Bug fix for issue with display on day trader mode.
Speed enhancement on startup
Version 1.20 2021.10.20
New Feature!
You can now toggle between a Day Trader view, showing M5, M15, M30, H1, H4 and D1 or the Swing Trader view with H1, D1, W1, MN1, Q and Y timeframes displayed.