Elliot Waves Analyzer
- Indicateurs
- Viktor Weidenthal
- Version: 1.1
- Mise à jour: 11 février 2021
Elliot Waves Analyzer
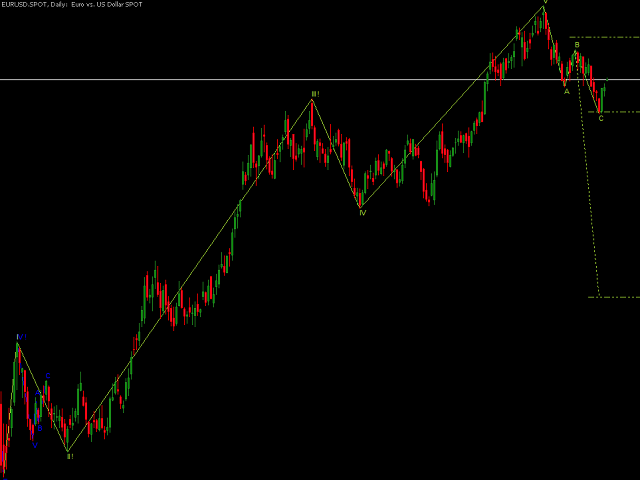
calculates Elliot Waves to Help Identify Trend direction and Entry Levels. Mainly for Swing Trading Strategies.
Usually one would open a Position in trend direction for Wave 3 or a Correction for Wave C .
This Indicator draws Target Levels for the current and next wave. Most important Rules for Elliot Wave Analysis are verified by the Indicator.
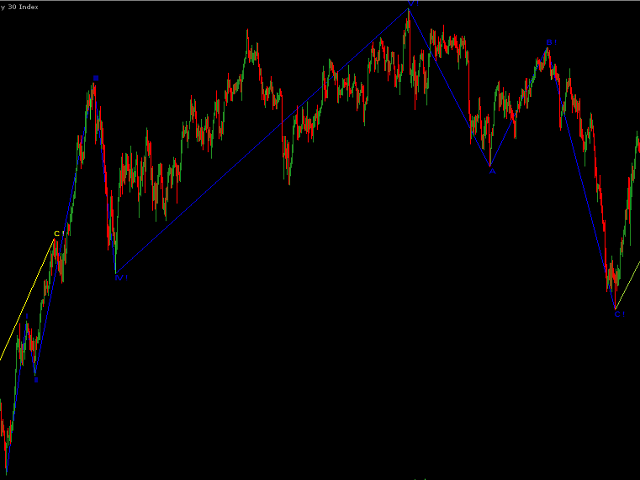
This free version is limited for Analyzing one Timperiod Waves. Waves are Shown only in PERIOD_H4 and above. Not Useful for Intraday trading startegies.
Full version shows Subwaves and all TimePeriods.


simple, effective and good Many thanks