ZoneHunter MT5
- Indicateurs
-
Paul Anderson
 I'm a retired Computer Science Professor who has been trading for over 20 years.
 - Version: 1.2
- Activations: 5
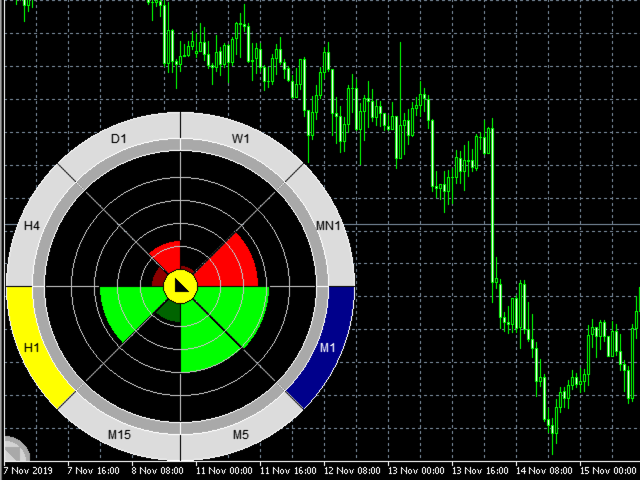
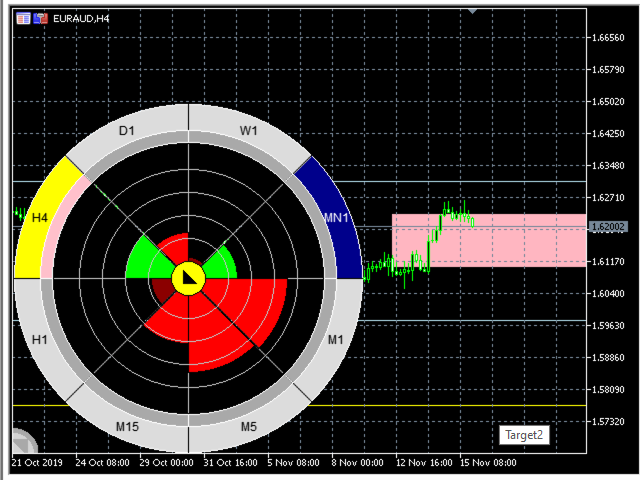
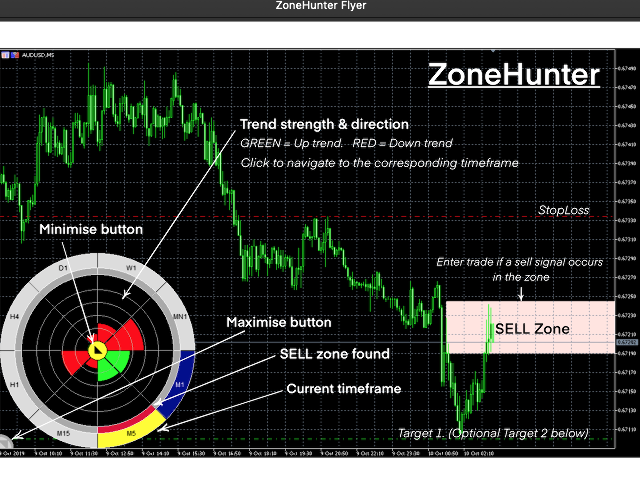
ZoneFinder is an indicator panel that presents an interactive, multi-timeframe visualisation of trend direction and strength. Trend strength and direction is measured using a modified ADX indicator based on smoothed DI+ and DI- values.
High probability trading zones are identified using Fibonacci retracements. Where such zones are found, they are marked on the chart together with a proposed Fibonacci targets.