SFT Local Trend Signal
- Indicateurs
- Artem Kuzmin
- Version: 1.0
- Activations: 5
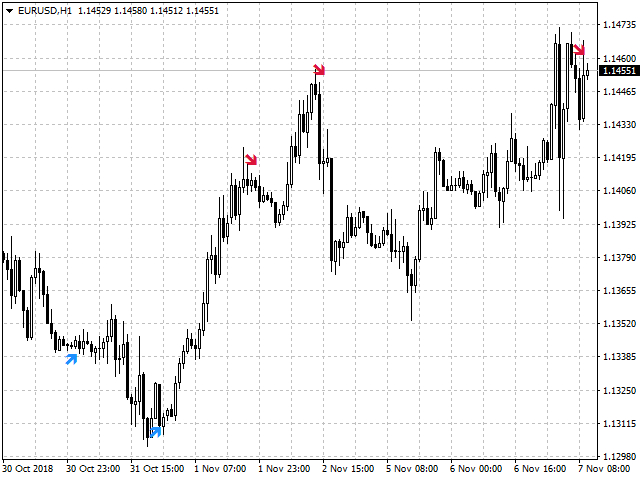
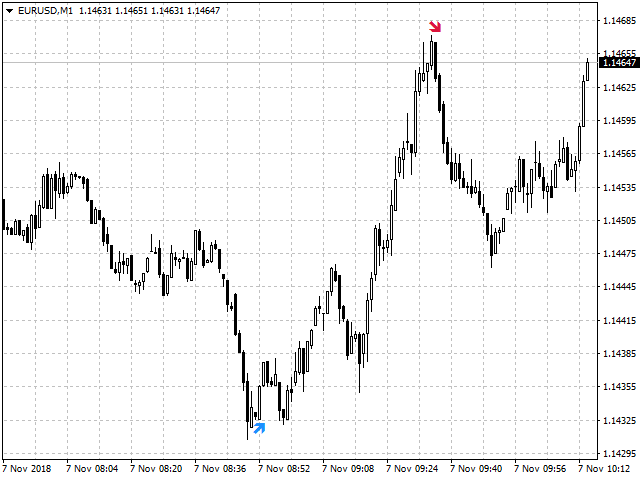
Arrow indicator, to determine adjustments and local trends
The arrow appears on the current bar and after closing the bar will not disappear.
Allows you to enter the transaction at the very beginning of the movement
Thanks to the flexible settings you can use on any currency pairs, metals and cryptocurrency
Can be used when working with binary options
Distinctive features
- Does not redraw.
- Additional parameters for fine tuning.
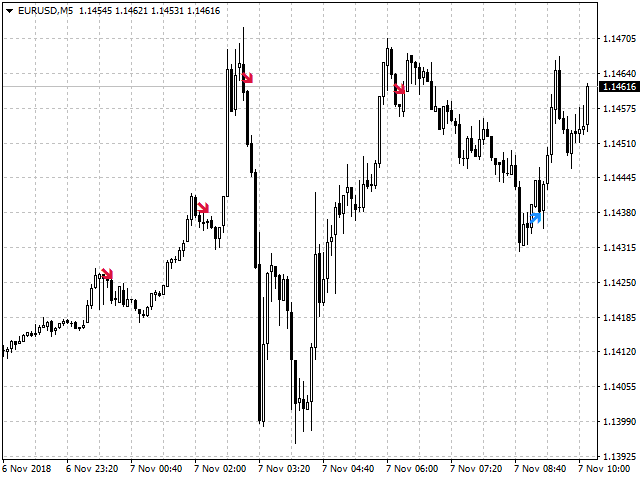
- Works on all timeframes and symbols.
- Suitable for trading currencies, metals, options and cryptocurrency (Bitcoin, Litecoin, Ethereum, etc.)
- Suitable for manual trading and development of Expert Advisors.
For more accurate entries and additional confirmation of signals, it can be used in conjunction with other indicators.
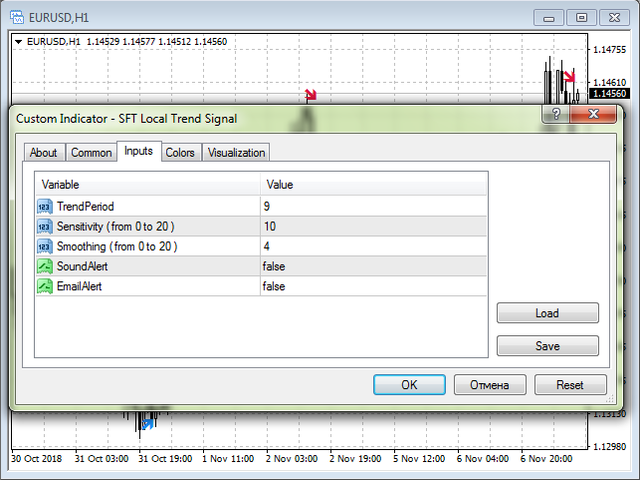
Setting up the indicator
- TrendPeriod - indicator period;
- Sensitivity - sensitivity from 1 to 10, the higher the more signals;
- Smoothing - smoothing and filtering spurious signals from 1 to 10, the higher the fewer signals remain;
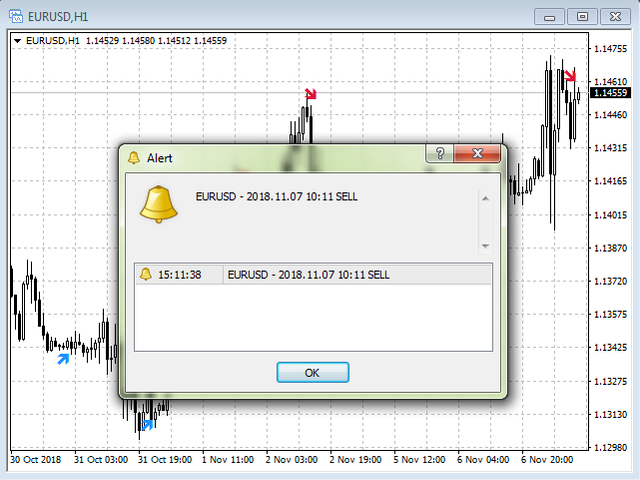
- SoundAlert - use audio confirmation of signals.
- EmailAlert -send Email notifications, configuration instructions are available here.
Trading Recommendations
- When the red arrow appears, open Sell or Put (for options)
- When the blue arrow appears, open Buy or Call (for options)
- The trade direction should correspond to the direction of the trend on a higher timeframe.
- Exit the trades at a reverse signal or at the defined SL and TP levels.
- When using SL and TP, set SL beyond the nearest extremum, TP = 1..2 SL.
- Signals work well near significant levels, such levels are well shown by the Topical Levels indicator.
Other trading options are also possible, you can develop the most convenient tactics for you in the process of trading.
Additional information and a more detailed overview of trading methods can be seen here:
Trading strategies with indicator SFT Local Trend Signal
We wish you a stable and profitable trading.
Thank you for using our software.
If you like it, share a link with your friends.
In order not to miss the release of new useful trading programs, add SURE FOREX TRADING to the friends list