Swap Checker
- Indicateurs
- Version: 1.0

SHORT SUMMARY
See the daily and weekly swap for every symbol you trade, Buy and Sell, in your account currency, before you hold a position overnight.
------------------------------------------------------------
DESCRIPTION
------------------------------------------------------------
Swap is easy to ignore when you open a trade and hard to ignore when it adds up. Swap Checker puts the overnight cost of holding, or the credit you earn, for every symbol you trade into one compact table on your chart.
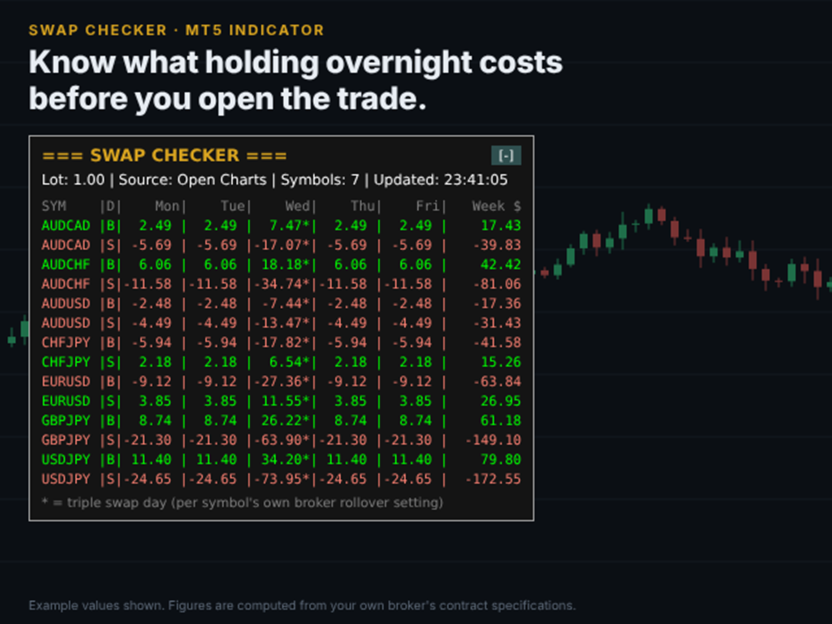
For each symbol, the panel shows two rows, one for Buy and one for Sell, with the swap for Monday through Friday and a weekly total. Every value is calculated from your own broker's contract specification and shown in your account currency for the lot size you choose.
Green means that direction pays you to hold. Red means it costs you. White means it's flat. You can see in a few seconds which side of a pair carries, and how much a multi-day hold really costs.
WHAT IT SHOWS
- Two rows per symbol (Buy and Sell) with Mon, Tue, Wed, Thu and Fri columns plus a weekly total
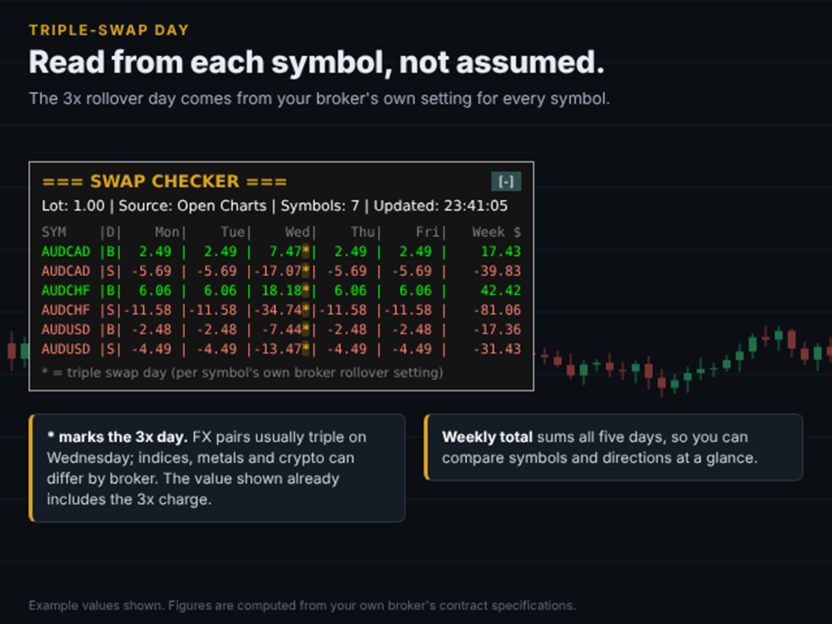
- The triple-swap day for each symbol, marked with an asterisk (*) and already multiplied by 3
- Colour coding by weekly result: earning, paying or flat
- A summary line with lot size, symbol source, symbol count and last update time
KEY FEATURES
- Two symbol sources: every symbol on your open charts, or your full Market Watch list
- Adjustable lot size (default 1.00), so the figures match the size you actually trade
- Per-symbol triple-swap day, read from the broker's rollover setting rather than assumed to be Wednesday. FX pairs, indices, metals and crypto can triple on different days.
- Swap filter with seven modes: None, Positive Only, Negative Only, Zero Only, Positive and Zero, Negative and Zero, Positive and Negative. Buy and Sell are filtered independently, so "Positive Only" shows exactly which direction earns swap on each symbol.
- Alphabetical or default ordering, with each symbol's Buy and Sell rows kept together
- Option to hide symbols with zero swap on both sides
- A compact panel that sizes itself to the rows shown and minimises to its title bar
- Fully customisable colours
HOW THE NUMBERS ARE CALCULATED
Swap Checker reads each symbol's swap mode, long and short swap rates, rollover day and contract details directly from the terminal, then converts the result to your account currency.
Supported swap modes:
- Points: points x point size x contract size x lots, converted from the symbol's profit currency. A second calculation using the broker's tick value runs as a cross-check, and any disagreement of more than 5% is written to the Experts log with the raw values.
- Currency (base, margin or deposit currency): converted to your account currency using live exchange rates
- Interest rate (current or open price): annual rate applied to position value using a 360-day convention
- Legacy "reopen" modes don't reduce to a fixed daily amount and are shown as N/A rather than as an invented number.
BUILT TO BE RELIABLE
After a terminal restart, broker data for some symbols can take a moment to arrive. Instead of mislabelling those symbols, Swap Checker shows them as "Syncing..." and retries every 5 seconds for up to about two minutes. Once everything is in, it switches to your normal refresh interval (default: every 6 hours, since swap rates rarely change intraday).
READ-ONLY
Swap Checker is an indicator. It never opens, modifies or closes trades and places no orders.
------------------------------------------------------------
INPUT PARAMETERS
------------------------------------------------------------
Symbol Source
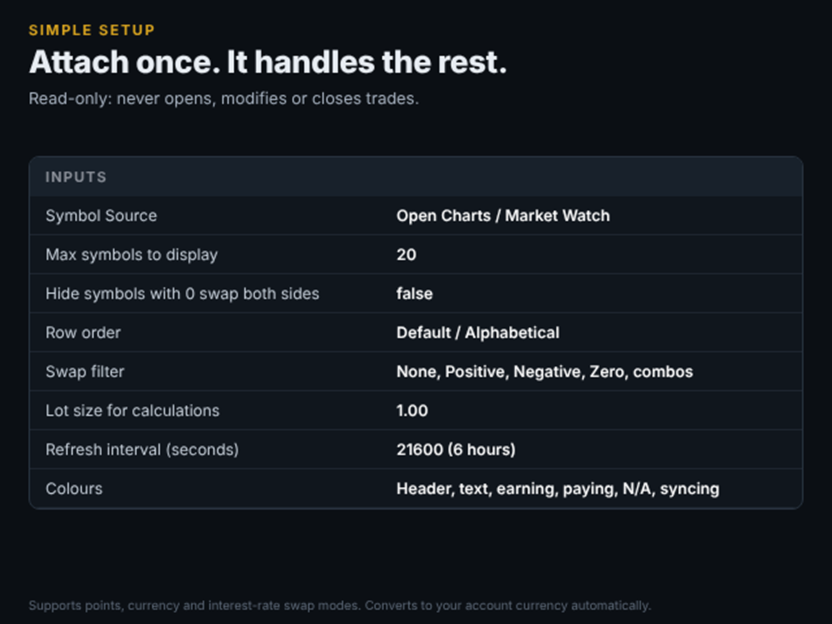
- Symbol Source: Open Charts or Market Watch
- Max symbols to display: default 20
- Hide symbols with 0 swap both sides: default false
- Row order: Default (collection order) or Alphabetical
- Swap filter: None (default), Positive Only, Negative Only, Zero Only, Positive and Zero, Negative and Zero, Positive and Negative
Calculation
- Lot size: default 1.00
Display
- Show panel: default true
- Refresh interval in seconds: default 21600 (6 hours)
- Colours: header, text, positive swap, negative swap, unsupported (N/A), syncing
------------------------------------------------------------
GOOD TO KNOW
------------------------------------------------------------
- Values are forward-looking estimates based on the current contract specification. They aren't a record of swaps already charged, and brokers can change swap rates at any time.
- Filters use the weekly total, so a row counts as positive when its five-day sum is above zero.
- If a broker sets the triple-swap day to Saturday or Sunday, the extra charge is shown in the Friday column.
- For interest-rate swap modes, some brokers use a 365-day convention, so expect small differences.
- If no conversion pair is available for a currency-based swap, the figure is shown in its original currency. Check those rows against your broker's specification.
- The panel uses a fixed-width layout. On a very narrow chart window, widen the chart to see the weekly column in full.
REQUIREMENTS
- MetaTrader 5
- Any broker, account type and account currency
- Works on any symbol and timeframe. Attach to one chart; it reads all symbols from your selected source.