• Aperçu
  • Avis
  • Commentaires
  • Nouveautés

Market Structure Hh Hl Lh Ll

Description:

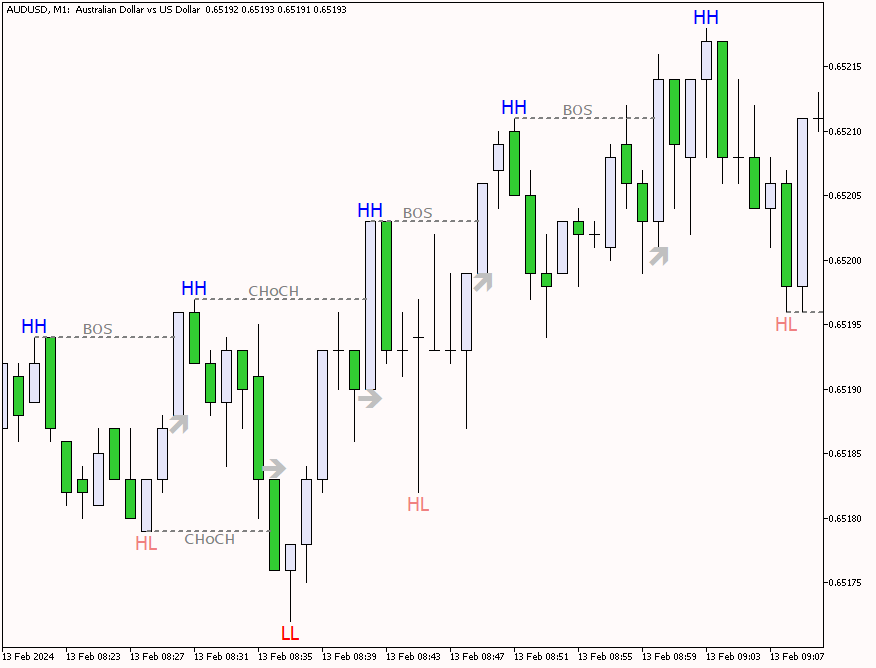
L'indicateur « Structure du marché HH HL LH LL » est un outil à la fois puissant et simple pour analyser la dynamique des prix sur les marchés financiers. Cet indicateur aide les traders et les investisseurs à identifier les changements de tendances et à identifier les points importants dans les séries chronologiques de prix.

Éléments clés de l’indicateur :

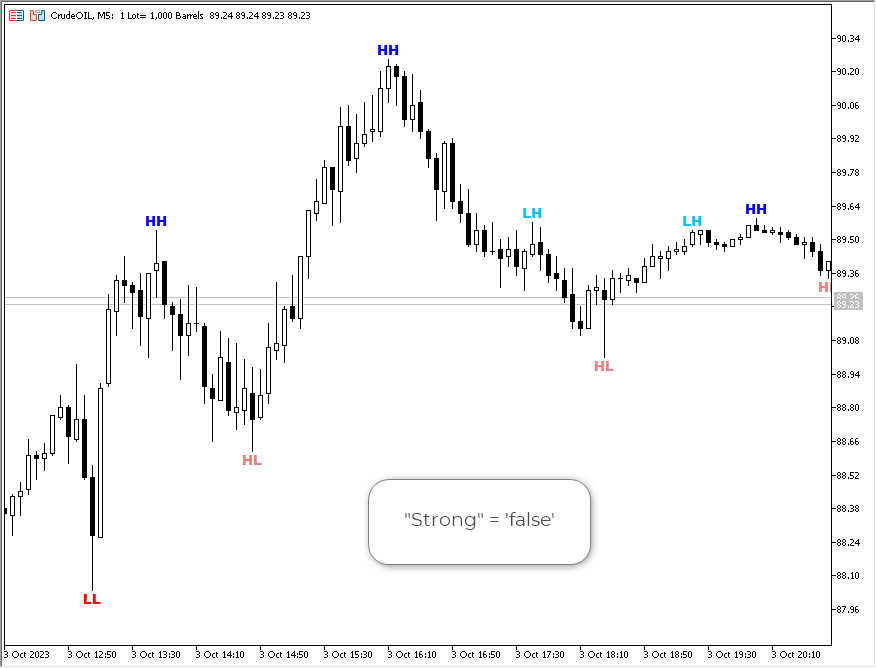
HH (Higher High) : Le sommet auquel le prix clôture au-dessus du sommet précédent. HH indique une tendance haussière qui se renforce.
HL (Higher Low) : Le minimum auquel le prix clôture au-dessus du plus bas précédent. HL confirme la poursuite de la tendance haussière.
LH (Lower High) : un sommet où le prix clôture en dessous du sommet précédent. LH signale un possible renversement de tendance.
LL (Lower Low) : Le minimum auquel le prix clôture en dessous du plus bas précédent. LL confirme le début d'une tendance baissière.

Comment utiliser:

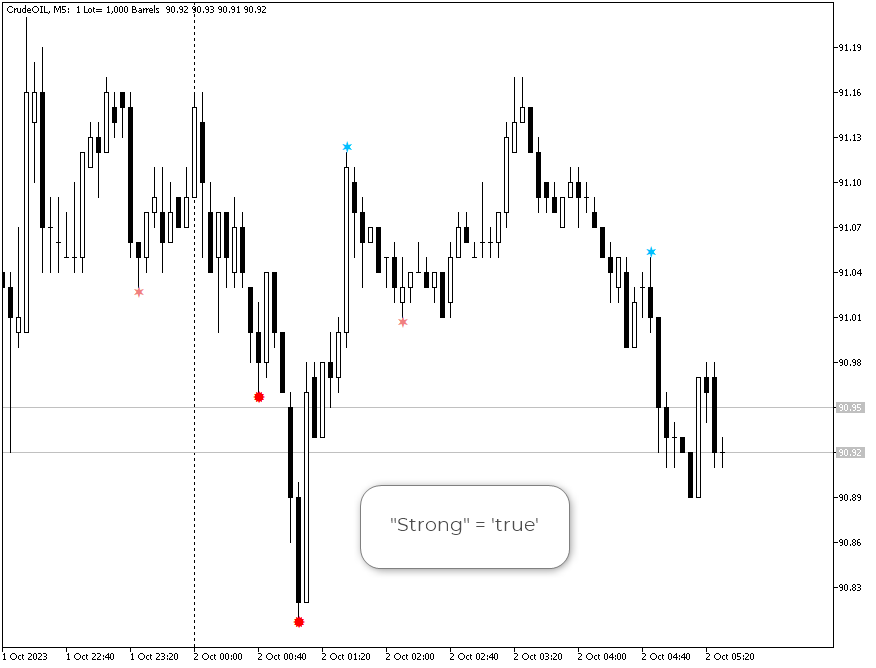
L'indicateur « Structure du marché HH HL LH LL » aide les traders et les investisseurs à déterminer la tendance actuelle du marché. Une tendance haussière est caractérisée par une séquence de HH et HL, et une tendance baissière est caractérisée par une séquence de LH et LL. Lorsque la tendance change, cela peut être un signal pour ouvrir ou fermer une position sur le marché.

Exemple d'utilisation :

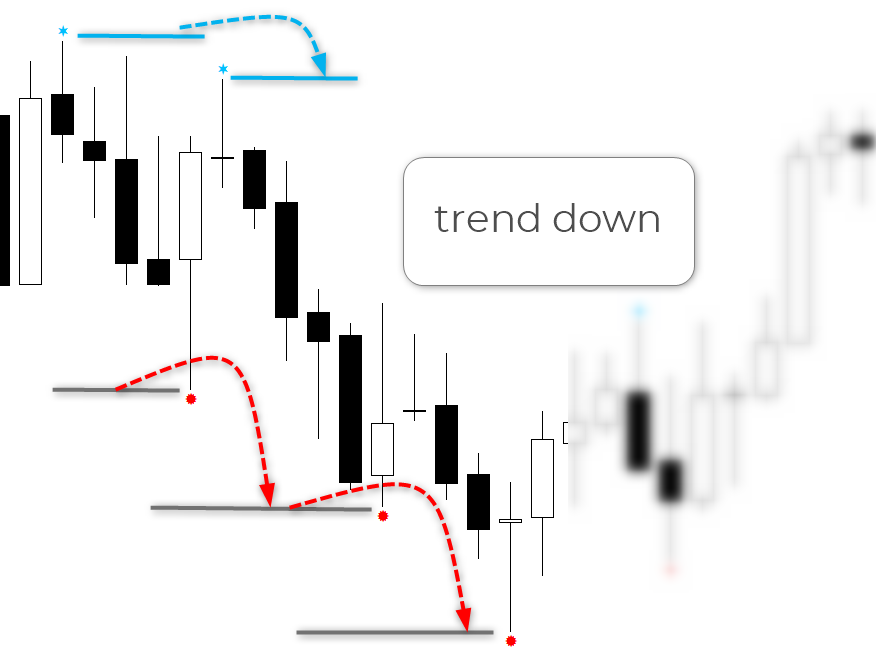
Disons que vous avez une position longue sur une action et que l'indicateur affiche une séquence de LH et LL, indiquant le début possible d'une tendance à la baisse. Cela peut être un signal pour clôturer une position ou fixer une limite de stop.

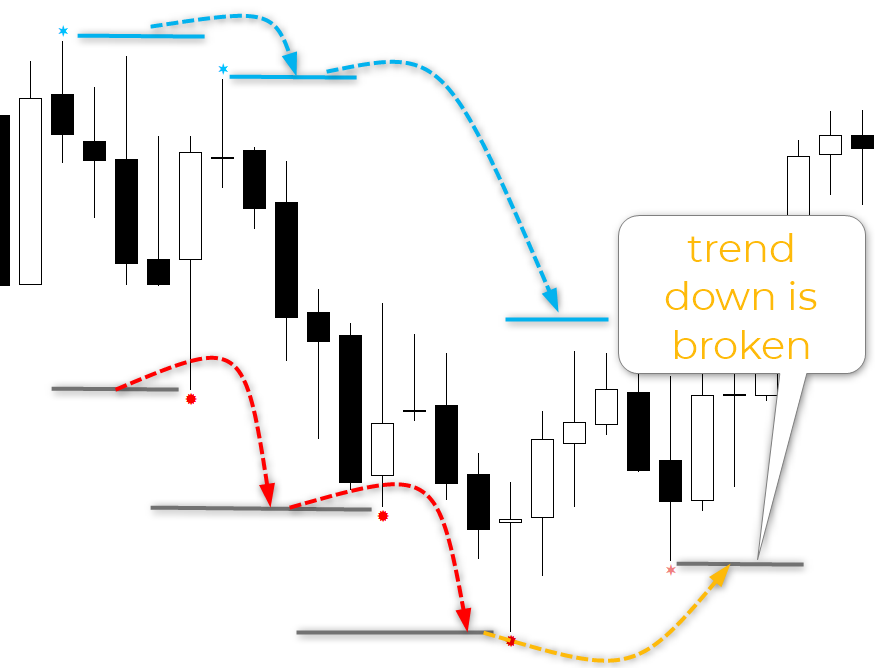
Les images ci-dessous montrent un exemple de tendance à la baisse et un exemple de rupture de cette tendance.


Produits recommandés
VWAP Indicator
LUC JACOBUS A VERHEECKE
4.19 (21)
Volume Weighted Average Price (VWAP) The volume weighted average price (VWAP) is a   trading   benchmark   used by traders that gives the average price a security has traded at throughout the day, based on both volume and price. It is important because it provides traders with insight into both the trend and value of a security. This indicator VWAP V2 is free and is the manual version of the extended Easy VWAP indicator (30 Euro), where the date and time properties are automatically entered. Wit
FREE
The   Visual Volatility Clustering   indicator clusters the market based on volatility. The indicator does not redraw and gives accurate data, does not use closing prices. Uses the opening prices or the highs or lows of the previous completed bar. Therefore, all information will be clear and unambiguous. The essence of the indicator is to divide the price market into certain areas according to a similar type of volatility. This can be done in any way. In this example, the indicator is configure
YY Mono Waves MT5
Yuryi Yatsenko
4 (2)
The Mono Waves indicator is designed to display the wave behavior of the market on a chart. Its appearance is presented on slide 1.   This indicator uses the PPPC (Point-Percent Price Channel) indicator, which can be downloaded for free from the  Market .              When the market moves up, the upper border of the price channel is built on High candlestick prices (for more details, see the description of the PPPC indicator at the link given above). The higher the High prices rise
FREE
Stackable VWAP
Flavio Javier Jarabeck
3.33 (6)
Volume Weighted Average Price (VWAP) is a trading benchmark commonly used by Big Players that gives the average price a Symbol has traded throughout the day. It is based on both Volume and price. Additionally we put in this indicator the MVWAP (Moving Volume Weighted Average Price). For those who do not know the usage and the importance od this indicator I recommend a great article about this subject at Investopedia ( https://www.investopedia.com/articles/trading/11/trading-with-vwap-mvwap.asp
FREE
Swiss VWAPsimple
Terence Gronowski
5 (4)
Swiss VWAPsimple Motivation Did not find free VWAP that works, the one that I found craseh. So I created a VWAP which calculates values only for the actual day. So computer resouces are not over stressed. What is VWAP, how is it used?  VWAP stands for Volume Weighed Average Price, it calculates the running sum of tick volume and the runnung sum of price times tickvolume. The division of these sums result in a weighed price (Sum P*V/Sum V). The calculation starts normally at midnight. The value
FREE
The   Visual Volatility Clustering   indicator clusters the market based on volatility. The indicator does not redraw and gives accurate data, does not use closing prices. Uses the opening prices or the highs or lows of the previous completed bar. Therefore, all information will be clear and unambiguous. The essence of the indicator is to divide the price market into certain areas according to a similar type of volatility. This can be done in any way. In this example, the indicator is configure
Value Chart Candlesticks
Flavio Javier Jarabeck
4.67 (9)
The idea of a Value Chart indicator was presented in the very good book I read back in 2020 , " Dynamic Trading Indicators: Winning with Value Charts and Price Action Profile ", from the authors Mark Helweg and David Stendahl. The idea is simple and the result is pure genius: Present candlestick Price analysis in a detrended way! HOW TO READ THIS INDICATOR Look for Overbought and Oversold levels. Of course, you will need to test the settings a lot to find the "correct" one for your approach.
FREE
VWAP and MVWAP
Flavio Javier Jarabeck
4.17 (6)
Volume Weighted Average Price (VWAP) is a trading benchmark commonly used by Big Players that gives the average price a Symbol has traded throughout the day. It is based on both Volume and price. Additionally we put in this indicator the MVWAP (Moving Volume Weighted Average Price). For those who do not know the usage and the importance od this indicator I recommend a great article about this subject at Investopedia ( https://www.investopedia.com/articles/trading/11/trading-with-vwap-mvwap.asp )
FREE
The VWAP Level indicator is a technical analysis tool that calculates the weighted average price for the traded volumes of a specific asset. The VWAP provides traders and investors with the average price of an asset over a specific time frame. It is commonly used by investors to compare data on "passive" trading operations, such as pension funds and mutual funds, but also by traders who want to check if an asset has been bought or sold at a good market price. To calculate the VWAP level we
FREE
Activity Power
Zoltan Nemet
5 (4)
Multi time frame, multy currency special swing volume indicator with engulfing waves too. Simpler to use compare to Weis Wave. User don't need to adjust wave size. Just use of the basic or the upper time frames. As a multi time frame indikator user can do  very complex time frame analysyses. As well as a multy currency indicator one can make market sector-segment analysyses. Use with Wckoff principles.
FREE
MIDAS Super VWAP
Flavio Javier Jarabeck
4.29 (14)
Imagine VWAP, MVWAP and MIDAS in one place... Well, you found it! Now you can track the movement of Big Players in various ways, as they in general pursue the benchmarks related to this measuring, gauging if they had good execution or poor execution on their orders. Traders and analysts use the VWAP to eliminate the noise that occurs throughout the day, so they can measure what prices buyers and sellers are really trading. VWAP gives traders insight into how a stock trades for that day and deter
FREE
Máquina Trader Tendência Count on our trend tracker to carry out your operations on the Mini Index and the Mini Dollar!!! Operational Green is BUY and Pink is SELL!!! Enter the operation after closing the first color block!!! Developed and Tested on the 5 or 15 minute Chart for Mini Index and Mini Dollar!!! Can be used on any chart!!! Editable colors and period!!!
ZhiBiTMG is a collection of trends and martingale indicators for all market segments and all chart cycles. Many indicators on the market violate the trend but claim to be accurate, but is it really accurate? In fact, it is not accurate! Because the market must go with the trend. This ZhiBiTMG indicator gives the Martingale signal on the premise of the trend. This will be in line with market rules. Instructions for use: The red line is the downward trend line (Sell), a total of three lines; by de
VP hidden
Emr Aljnaby
5 (4)
The indicator works to convert normal volume into levels and determine financial liquidity control points. It is very similar in function to Fixed Volume Profile. But it is considered more accurate and easier to use than the one found on Trading View because it calculates the full trading volumes in each candle and in all the brokers present in MetaTrade, unlike what is found in Trading View, as it only measures the broker’s displayed prices. To follow us on social media platforms: tel
FREE
Tick Database — export of tick database from MT5 terminal to MT4. The utility provides access to the tick database in real time. This is necessary to generate synthetic charts in the MT4 terminal, which initially does not provide for loading a tick database. For example, you can organize permanent access to the tick database for the " Seconds Chart " utility, which create seconds charts in the MT4 terminal.
FREE
Cet indicateur de tableau de bord d'offre et de demande à plusieurs périodes et à plusieurs symboles envoie des alertes lorsque le prix a atteint une zone d'offre/demande. Il est également possible de l'utiliser pour être alerté des doubles hauts/bas réguliers au lieu des zones. Il peut être utilisé avec toutes les plages horaires de M1 à MN.       Un maximum de 9 périodes peuvent être affichées dans le tableau de bord en même temps.   Il est possible d'utiliser des filtres RSI, divergence (MACD
LT Mini Charts
Thiago Duarte
4.86 (7)
This is a utility indicator that creates mini charts on left side of the chart you are looking at. It is very useful to watch many timeframes simultaneously, without having to change between multiple charts. Its configuration is very simple. You can have up to 4 mini charts opened. They automatically load the template of the "parent" chart. If you have any doubt please contact me. Enjoy! This is a free indicator, but it took hours to develop. If you want to pay me a coffee, I appreciate a lot
FREE
Donchian Pro
Paulo Henrique Faquineli Garcia
5 (2)
The Donchian Channel Channels are among the most popular tools of technical analysis, as they visually convey to the analyst the limits within which most price movement tends to occur. Channel users know that valuable information can be obtained at any time, whether prices are in the central region of a band or close to one of the border lines. One of the best known techniques to explore these concepts is Bollinger Bands. However, John Bollinger was not the only one to research the applicatio
FREE
A countdown timer for the  Volume bar chart generator  and  Tick chart generator  products, which are available for download from the MQL5 Market: Tick chart generator: https://www.mql5.com/en/market/product/29215 Volume bar chart generator: https://www.mql5.com/en/market/product/47197 The counter conveniently displays the number of ticks or transactions (depending on the chart) that need to pass for a new bar to start printing. The user can set the following indicator inputs. Volume type
FREE
L'indicateur vous permet de déterminer la direction actuelle des prix et la volatilité du marché. Cette version du Traders Dynamic Index a supprimé le redessinage des données historiques, la vitesse de calcul de l'algorithme optimisée, plus de paramètres externes pour des ajustements plus précis, et ses fonctionnalités étendues : ajout de la sélection de l'oscillateur initial et des méthodes de lissage des moyennes . Paramètres: Mode Osc - estimation sélection de l'oscillateur Period Osc - la pé
VWAP Simple
Deibson Carvalho
4.03 (33)
The Volume Weighted Average Price is similar to a moving average, except volume is included to weight the average price over a period.    Volume-Weighted Average Price [VWAP] is a dynamic, weighted average designed to more accurately reflect  a security’s true average price over a given period . Mathematically, VWAP is the summation of money (i.e., Volume x Price) transacted divided by the total volume over any time horizon, typically from market open to market close. VWAP reflects the capital
FREE
Bar Color Trend
Germano Chagas
4.5 (10)
Combining the best of Price Action , Directional Movement , and Divergence/Convergence analysis, Candle Color Trend is a easy and reliable way to identify trend direction. The indicator automatically paints the candles according to the assumption that an uptrend is defined by prices that form a series of higher highs and higher lows. In contrast, a downtrend is defined by prices that form a series of lower highs and lower lows. Additionally, ADX Wilder indicator is used to measure trend weakness
FREE
A useful scanner/dashboard that shows the RSI values for multiple symbols and Time-frames. It can be easily hidden/displayed with a simple click on the scanner man top left of the dashboard. You can input upper and lower RSI values and the colours can be set to show when above/below these values. The default values are 70 and 30. There are also input colours for when the RSI is above or below 50 (but not exceeding the upper/lower levels Symbols and time-frames are input separated by commas.
Do you use volume in your reading of the market? Certainly many traders use it, and do not imagine operating without it. The Color Histogram Volume Set indicator allows the user to choose the value that he considers interesting to monitor. When you pass this you will have visual confirmation and if you want you will also have the audible alert that is given by the indicator. Of course, there are other ways to try to find a high volume, such as assessing whether the volume
Bollinger Bands B
Flavio Javier Jarabeck
5 (3)
John Bollinger created this indicator in 2010 as a way to read the original indicator (Bollinger Bands) in a more "technical" way, shown as an oscillator. The typical range of the Bollinger Bands %B is 0 - 0.5 - 1.0, where "0" represents the lower band, the "0.5" the middle band, and "1" the upper band. The line on the indicator represents the Closing prices. As simple as that. SETTINGS Bollinger Bands period of analysis Standard Deviation multiplier Shift Price type to be analyzed If you
FREE
Midas VWAP
Paulo Henrique Faquineli Garcia
4 (1)
Volume Weighted Average Price (VWAP) is a trading benchmark commonly used by Big Players that gives the average price a Symbol has traded throughout the day. It is based on both Volume and price. This indicator contains Daily VWAP and MIDAS' VWAP, which means you are able to anchor the beggining of MIDAS' calculations and, therefore you will be able to use this methodology to study price versus volume moves after anchor point. You will be able to anchor up to 3 HIGH MIDAS VWAP's and 3 LOW. Wis
FREE
The best time to trade Using this Indicator is when the time reach exactly hour,half,45 minutes,15 minutes and sometimes 5 minutes.. This indicators is helpful to those who trade boom and crash indecies.How to read this indicator first you'll see Blue allow and Red allow all these allows used to indicate or to detect the spike which will happen so the allow happens soon before the spike happen.This indicator works properly only in boom and crash trading thing which you have to consider when
Intervals
Alexandre Borela
5 (2)
Si vous aimez ce projet, laissez un examen 5 étoiles. Suivre l'instagram: borelatech Traiter de gros volumes nous oblige à regarder plusieurs instruments/charts à trouver de nouvelles opportunités, cet indicateur vous aidera en complotant spécifique niveaux par le multiple d'un nombre ou son suffixe et les mettre à jour automatiquement comme le prix change, une tâche qui serait autrement fastidieuse. Par exemple, sur GBPUSD, vous pourriez avoir 4 instances de l'indicateur sur le graphiqu
FREE
The Volume Weighted ATR indicator is a helpful tool for measuring market activity. It is based on the idea of the Volume-Weighted ATR. Combining these two elements helps identify potential turning points or breakout opportunities. The indicator for the classification of the activity of the market uses the moving average and its multiples. Accordingly, where the VWATR bar is located (relative to the moving average), it is labelled as ultra-low, low, average, high, very high or ultra high. The Vo
FREE
Anchored VWAP with Alert MT5
Trade The Volume Waves Single Member P.C.
What is the Volume Weighted Average Price (VWAP)? The volume weighted average price (VWAP) is a trading benchmark used by traders that gives the average price an instrument has traded at throughout the day, based on both volume and price.  It is important because it provides traders with insight into both the trend and value of the instrument. What is the Difference between VWAP and AVWAP? While VWAP is having as starting point the beggining of the day,week,month etc. in the AVWAP you can p
Les acheteurs de ce produit ont également acheté
Tout d'abord, il convient de souligner que ce système de trading est un indicateur non repeint, non redessiné et non retardé, ce qui le rend idéal pour le trading manuel et automatisé. Le "Système de Trading Smart Trend MT5" est une solution de trading complète conçue pour les traders débutants et expérimentés. Il combine plus de 10 indicateurs premium et propose plus de 7 stratégies de trading robustes, ce qui en fait un choix polyvalent pour différentes conditions de marché. Stratégie de suivi
Atomic Analyst MT5
Issam Kassas
4.82 (11)
Tout d'abord, il convient de souligner que cet indicateur de trading n'est ni repainting, ni redrawing et ne présente aucun délai, ce qui le rend idéal à la fois pour le trading manuel et automatisé. L'Analyste Atomique est un indicateur d'action sur les prix PA qui utilise la force et le momentum du prix pour trouver un meilleur avantage sur le marché. Équipé de filtres avancés qui aident à éliminer les bruits et les faux signaux, et à augmenter le potentiel de trading. En utilisant plusieur
FX Volume MT5
Daniel Stein
4.94 (17)
Obtenez votre mise à jour quotidienne du marché avec des détails et des captures d'écran via notre Morning Briefing ici sur mql5 et sur Telegram ! FX Volume est le PREMIER et SEUL indicateur de volume qui fournit un VRAI aperçu du sentiment du marché du point de vue d'un courtier. Il fournit des informations impressionnantes sur la façon dont les acteurs institutionnels du marché, comme les courtiers, sont positionnés sur le marché des changes, bien plus rapidement que les rapports COT. Voir c
Quantum Trend Sniper
Bogdan Ion Puscasu
5 (37)
Présentation       Quantum Trend Sniper Indicator   , l'indicateur révolutionnaire MQL5 qui transforme la façon dont vous identifiez et négociez les inversions de tendance ! Développé par une équipe de traders expérimentés avec une expérience commerciale de plus de 13 ans,       Indicateur Quantum Trend Sniper       est conçu pour propulser votre parcours de trading vers de nouveaux sommets grâce à sa manière innovante d'identifier les inversions de tendance avec une précision extrêmement élevée
Trend Screener Pro MT5
STE S.S.COMPANY
4.89 (61)
Indicateur de tendance, solution unique révolutionnaire pour le trading et le filtrage des tendances avec toutes les fonctionnalités de tendance importantes intégrées dans un seul outil ! Il s'agit d'un indicateur multi-période et multi-devises 100 % non repeint qui peut être utilisé sur tous les symboles/instruments : forex, matières premières, crypto-monnaies, indices et actions. Trend Screener est un indicateur de suivi de tendance efficace qui fournit des signaux de tendance fléchés avec des
Tout d'abord, il convient de souligner que cet outil de trading est un indicateur non repeint, non redessiné et non retardé, ce qui le rend idéal pour le trading professionnel. L'indicateur Smart Price Action Concepts est un outil très puissant à la fois pour les nouveaux et les traders expérimentés. Il regroupe plus de 20 indicateurs utiles en un seul, combinant des idées de trading avancées telles que l'analyse du trader Inner Circle et les stratégies de trading Smart Money Concepts. Cet in
Top indicator for MT5   providing accurate signals to enter a trade without repainting! It can be applied to any financial assets:   forex, cryptocurrencies, metals, stocks, indices .  Watch  the video  (6:22) with an example of processing only one signal that paid off the indicator! MT4 version is here It will provide pretty accurate trading signals and tell you when it's best to open a trade and close it. Most traders improve their trading results during the first trading week with the help of
FX Power MT5 NG
Daniel Stein
5 (4)
Obtenez votre mise à jour quotidienne du marché avec des détails et des captures d'écran via notre Morning Briefing ici sur mql5 et sur Telegram ! FX Power MT5 NG est la nouvelle génération de notre très populaire indicateur de force des devises, FX Power. Et qu'est-ce que ce compteur de force de nouvelle génération offre ? Tout ce que vous avez aimé de l'original FX Power PLUS Analyse de la force de l'OR/XAU Des résultats de calcul encore plus précis Périodes d'analyse configurables individuel
RelicusRoad Pro MT5
Relicus LLC
4.82 (22)
Maintenant 147 $ (augmentant à 499 $ après quelques mises à jour) - Comptes illimités (PCS ou Mac) Manuel d'utilisation RelicusRoad + Vidéos de formation + Accès au groupe Discord privé + Statut VIP UNE NOUVELLE FAÇON DE REGARDER LE MARCHÉ RelicusRoad est l'indicateur de trading le plus puissant au monde pour le forex, les contrats à terme, les crypto-monnaies, les actions et les indices, offrant aux traders toutes les informations et tous les outils dont ils ont besoin pour rester renta
Auto Order Block with break of structure based on ICT and Smart Money Concepts Futures Break of Structure ( BoS )             Order block ( OB )            Higher time frame Order block / Point of Interest ( POI )    shown on current chart           Fair value Gap ( FVG ) / Imbalance   ,  MTF      ( Multi Time Frame )    Volume Imbalance     ,  MTF          vIMB Gap’s Equal High / Low’s     ,  MTF             EQH / EQL Liquidity               Current Day High / Low           HOD /
XQ Indicator MetaTrader 5
Marzena Maria Szmit
5 (1)
Step into the realm of Forex trading with confidence and precision using XQ, a cutting-edge Forex indicator designed to elevate your trading game to unprecedented heights. Whether you're a seasoned trader or just stepping into the world of currency exchange, XQ Forex Indicator empowers you with the insights and signals needed to make informed trading decisions. The signal conditions are a combination of three indicators, and XQ Forex Indicator only display  medium and long-term trends . The ind
Blahtech Supply Demand MT5
Blahtech Limited
4.57 (14)
Was: $299  Now: $99   Supply Demand uses previous price action to identify potential imbalances between buyers and sellers. The key is to identify the better odds zones, not just the untouched ones. Blahtech Supply Demand indicator delivers functionality previously unavailable on any trading platform. This 4-in-1 indicator not only highlights the higher probability zones using a multi-criteria strength engine, but also combines it with multi-timeframe trend analysis, previously confirmed swings
Advanced Supply Demand MT5
Bernhard Schweigert
4.53 (15)
La meilleure solution pour tout commerçant débutant ou expert ! Cet indicateur est un outil de trading unique, de haute qualité et abordable car nous avons intégré un certain nombre de fonctionnalités propriétaires et une nouvelle formule. Avec cette mise à jour, vous pourrez afficher des zones à double horaire. Vous pourrez non seulement afficher un TF plus élevé, mais afficher les deux, le graphique TF, PLUS le TF supérieur : AFFICHAGE DES ZONES NICHÉES. Tous les traders Supply Demand vont ado
ICT, SMC, SMART MONEY CONCEPTS, SMART MONEY, Smart Money Concept, Support and Resistance, Trend Analysis, Price Action, Market Structure, Order Blocks, BOS/CHoCH,   Breaker Blocks ,  Momentum Shift,   Supply&Demand Zone/Order Blocks , Strong Imbalance,   HH/LL/HL/LH,    Fair Value Gap, FVG,  Premium  &   Discount   Zones, Fibonacci Retracement, OTE, Buy Side Liquidity, Sell Side Liquidity, BSL/SSL Taken, Equal Highs & Lows, MTF Dashboard, Multiple Time Frame, BigBar, HTF OB, HTF Market Structure
L'indicateur de Carré Gann est un puissant outil d'analyse du marché basé sur l'article "Formule Mathématique pour les Prédictions de Marché" écrit par W.D. Gann. Cet outil utilise des concepts mathématiques et des théories de Gann pour réaliser une analyse précise du marché. Il utilise les carrés de 144, 90, 52 et aussi le carré de 9. De plus, il intègre la méthode du  pour le carré de 9 et sa relation avec les canaux et le modèle en étoile de ce carré. Manuel d'Utilisateur et Application : Ava
AW Trend Predictor MT5
AW Trading Software Limited
4.76 (54)
La combinaison des niveaux de tendance et de panne dans un seul système. Un algorithme d'indicateur avancé filtre le bruit du marché, détermine la tendance, les points d'entrée, ainsi que les niveaux de sortie possibles. Les signaux indicateurs sont enregistrés dans un module statistique, qui vous permet de sélectionner les outils les plus appropriés, montrant l'efficacité de l'historique des signaux. L'indicateur calcule les marques Take Profit et Stop Loss. Manuel et instruction ->   ICI   / v
Le profit de la structure du marché change à mesure que le prix s'inverse et recule. L'indicateur d'alerte d'inversion de la structure du marché identifie le moment où une tendance ou un mouvement de prix approche de l'épuisement et est prêt à s'inverser. Il vous avertit des changements dans la structure du marché qui se produisent généralement lorsqu'un renversement ou un recul majeur est sur le point de se produire. L'indicateur identifie initialement les cassures et la dynamique des prix,
The Volume by Price Indicator for MetaTrader 5 features Volume Profile and Market Profile TPO (Time Price Opportunity). Get valuable insights out of currencies, equities and commodities data. Gain an edge trading financial markets. Volume and TPO histogram bar and line charts. Volume Footprint charts. TPO letter and block marker charts including split structures. Versatile segmentation and compositing methods. Static, dynamic and flexible ranges with relative and/or absolute visualizations. Lay
Présentation       Quantum Breakout PRO   , l'indicateur révolutionnaire MQL5 qui transforme la façon dont vous négociez les zones d'évasion ! Développé par une équipe de traders expérimentés avec une expérience commerciale de plus de 13 ans,       Évasion quantique PRO       est conçu pour propulser votre parcours commercial vers de nouveaux sommets grâce à sa stratégie de zone de discussion innovante et dynamique. Quantum Breakout Indicator vous donnera des flèches de signalisation sur le
TrendLine PRO MT5
Evgenii Aksenov
4.78 (49)
The Trend Line PRO indicator is an independent trading strategy. It shows the trend change, the entry point to the transaction, as well as automatically calculates three levels of Take Profit and Stop Loss protection Trend Line PRO is perfect for all Meta Trader symbols: currencies, metals, cryptocurrencies, stocks and indices Advantages of Trend Line PRO Never redraws its signals The possibility of using it as an independent strategy It has three automatic levels Take Profit and Stop Loss lev
Owl Smart Levels MT5
Sergey Ermolov
4.47 (36)
Version MT4   |  FAQ L' indicateur Owl Smart Levels est un système de trading complet au sein d'un seul indicateur qui comprend des outils d'analyse de marché populaires tels que les fractales avancées de Bill Williams , Valable ZigZag qui construit la structure d'onde correcte du marché et les niveaux de Fibonacci qui marquent les niveaux exacts d'entrée. sur le marché et les endroits où prendre des bénéfices. Description détaillée de la stratégie Mode d'emploi de l'indicateur Conseiller-Assis
Gartley Hunter Multi
Siarhei Vashchylka
5 (5)
Gartley Hunter Multi - An indicator for searching for harmonic patterns simultaneously on dozens of trading instruments and on all classic timeframes: (m1, m5, m15, m30, H1, H4, D1, Wk, Mn). Manual (Be sure to read before purchasing) | Version for MT4 Advantages 1. Patterns: Gartley, Butterfly, Shark, Crab. Bat, Alternate Bat, Deep Crab, Cypher 2. Simultaneous search for patterns on dozens of trading instruments and on all classic timeframes 3. Search for patterns of all possible sizes. Fr
Trend Line Map Pro MT5
STE S.S.COMPANY
4.67 (9)
Trend Line Map indicator is an addons for   Trend Screener Indicator . It's working as a scanner for all signals generated by Trend screener ( Trend Line Signals ) . It's a Trend Line Scanner based on Trend Screener Indicator.  If you don't have Trend Screener Pro Indicator,   the Trend Line Map Pro will not work.     LIMITED TIME OFFER : Trend Line Map Indicator is available for only 50 $ and lifetime. ( Original price 125$ ) By accessing to our MQL5 Blog,  you can find all our premium indica
TrendDecoder Premium MT5
Christophe, Pa Trouillas
5 (1)
Identifiez les ranges et les tendances fortes  |  Obtenez les premiers signaux   |    Obtenez des TP et des sorties   clairs   |    Repérer les niveaux Fibo que le prix va tester   |  Indicateur qui ne retrace pas, non retardé - idéal pour le trading manuel et automatisé - adapté à tous les actifs et à toutes les unités de temps - 50% discount   pour le lancement - puis retour à >>   149 $ Après votre achat,   contactez-moi sur ce canal  pour obtenir les réglages recommandés. Version MT4 :   cli
MetaBands M5
Vahidreza Heidar Gholami
4.67 (3)
MetaBands uses powerful and unique algorithms to draw channels and detect trends so that it can provide traders with potential points for entering and exiting trades. It’s a channel indicator plus a powerful trend indicator. It includes different types of channels which can be merged to create new channels simply by using the input parameters. MetaBands uses all types of alerts to notify users about market events. Features Supports most of the channel algorithms Powerful trend detection algorith
TPSpro TRENDPRO  - is a trend indicator that automatically analyzes the market and provides information about the trend and each of its changes, as well as giving signals for entering trades without redrawing! The indicator uses each candle, analyzing them separately. referring to different impulses - up or down impulse. Exact entry points into transactions for currencies, crypto, metals, stocks, indices!  -  Version MT4                  DETAILED DESCRIPTION        /       TRADING SETUPS       
Was: $249  Now: $99   Market Profile defines a number of day types that can help the trader to determine market behaviour. A key feature is the Value Area, representing the range of price action where 70% of trading took place. Understanding the Value Area can give traders valuable insight into market direction and establish the higher odds trade. It is an excellent addition to any system you may be using. Inspired by Jim Dalton’s book “Mind Over Markets”, this indicator is designed to suit the
Dessine automatiquement les niveaux de support et de résistance PLUS les écarts des bougies de propulsion sur votre graphique, afin que vous puissiez voir où le prix est susceptible de se diriger ensuite et/ou de s'inverser potentiellement. Cet indicateur est conçu pour être utilisé dans le cadre de la méthodologie de trading de position enseignée sur mon site web (The Market Structure Trader) et affiche des informations clés pour le ciblage et les entrées potentielles. MT4 Version:  https://
Golden Spikes Detector
Batsirayi L Marango
5 (1)
Golden Spikes Detector Cet indicateur est basé sur une stratégie avancée principalement pour les pics de trading sur les indices Boom et Crash. Des algorithmes complexes ont été mis en œuvre pour détecter uniquement les entrées à forte probabilité. Il alerte sur les entrées potentielles d’achat et de vente. Pour échanger des pics sur le courtier Deriv ou Binary, prenez uniquement les alertes Buy Boom et Sell Cash. Il a été optimisé pour être chargé sur une période de 5 minutes, bien qu'une analy
IX Power MT5
Daniel Stein
5 (2)
IX Power   apporte enfin la précision imbattable de FX Power aux symboles non-Forex. Il détermine avec précision l'intensité des tendances à court, moyen et long terme de vos indices, actions, matières premières, ETF et même crypto-monnaies préférés. Vous pouvez   analyser tout ce que   votre terminal a à offrir. Essayez-le et découvrez comment   votre timing s'améliore considérablement   lors de vos transactions. Caractéristiques principales d'IX Power Résultats de calcul précis à 100 %,
Plus de l'auteur
La stratégie de trading de tendance « Super Trend Flexible Alert EA » est construite sur l'indicateur du même nom « Super Trend Flexible Alert ». Le conseiller utilise toutes les informations de l'indicateur, le conseiller n'a donc que trois paramètres, à savoir : « Délai de travail » – précise le délai de travail, le délai sur lequel l'indicateur est créé, et également à partir duquel les données « OHLC » sont extraites. "Stop Loss" est la taille constante du stop loss, mesurée en "points" (vo
L'indicateur de tendance «   Super Trend Flexible Alert   » possède un minimum de réglages. Cet indicateur est conçu pour être aussi facile à utiliser que possible. L'indicateur affiche la tendance avec une ligne colorée principale (ligne "SuperTrend", que vous pouvez voir dans la fenêtre "Data Windows"). De plus, aux endroits où la tendance change, l'indicateur affiche des flèches colorées (   icônes "STBuy" et "   STSell", que vous pouvez voir dans la fenêtre "Data Windows"       ). Aux endroi
L'indicateur montre une divergence haussière et baissière. L'indicateur lui-même (comme le stochastique ordinaire) est affiché dans une sous-fenêtre. Interface graphique   : Dans la fenêtre principale, des objets graphiques « ligne de tendance » sont créés - produits du prix « bas » au prix « bas » (pour une divergence haussière) et produits du prix « haut » au prix « haut » (pour une divergence baissière). ). L'indicateur dessine dans sa fenêtre exclusivement à l'aide de tampons graphiques : «
L'indicateur 'Supertrend MetaTrader 5' est la base du système de trading de tendance le plus simple. Et pourtant il reste très efficace. L'indicateur fonctionne sur n'importe quelle période (sur la période du graphique actuel). D'après le nom, vous pouvez voir que cet indicateur suit la tendance, et lorsque la tendance change, l'indicateur montre avec précision le point de changement de tendance. La base de 'Supertrend MetaTrader 5' est de comparer les valeurs de prix et 'Average True Range ind
The Candle Length Indicator Alarm generates a sound alert, sends a push notification and an email when the size of the current candlestick changes. The size of the current candlestick can be measured in two ways: The first method: the size of the candlestick is measured from the beginning of the candlestick (from the OPEN price). The second method: the size of the candlestick is measured from current price. The indicator has the following settings: sound — a sound file from the folder: "...\Meta
The Buy Sell Color Background indicator changes the background color depending on position direction. It has three settings: Background color for BUY - background color for a Buy position Background color for SELL - background color for a Sell position Default background color - background color with no open position After you detach the indicator from a chart, its background color changes to Default background color .
The calculator of signals operates directly from the MetaTrader 5 terminal, which is a serious advantage, since the terminal provides a preliminary selection and sorts out signals. This way, users can see in the terminal only the signals that ensure a maximum compatibility with their trading accounts. The calculator of signals gives the answer to the one of the questions most frequently asked by users of the Signals service: "Will I be able to subscribe to the signal NNN, and what volume of the
Arrow Signal
Vladimir Karputov
Cet indicateur appartient à la catégorie « Stochastique ». J'ai essayé de simplifier au maximum le contrôle de l'indicateur, ainsi les réglages minimaux sont indiqués dans les paramètres d'entrée : c'est le choix d'une icône pour les flèches de signal. Le signal « Acheter » est codé avec le   paramètre « Acheter le code de flèche  » et le signal « Vendre » est codé avec le   paramètre « Vendre le code de flèche   ». Les codes de flèche de signal pour les signaux (veuillez utiliser des valeurs de
Arrow Signal EA
Vladimir Karputov
An Expert Advisor based on the custom indicator. Search for a signal at every tick. Positions are closed by an opposite signal. No trailing. There is no stop loss. There is no take profit. Has a minimum of settings Money management: Lot OR Risk   - type Money management The value for "Money management"   - Money management value Deviation   - admissible slippage Buy Arrow code   (font Wingdings) - character code from 'Wingdings' font for BUY signals Sell Arrow code   (font Wingdings) - characte
Ma Dema Alert
Vladimir Karputov
L'indicateur affiche trois lignes et surveille deux types d'intersections. Trois lignes de l'indicateur : "   MA   " - indicateur lent "Moving Average", "   DEMA Slow   " - indicateur lent "   Double Exponential Moving Average" et "   DEMA Fast   " - indicateur rapide "Double Exponential Moving Average". Deux types de carrefours       : "   Alert Price MA   " - le prix franchit la   ligne " MA " et   "   Alert DEMA DEMA   " - les lignes se croisent       "DEMA lent" et   "DEMA rapide   ". Lors d
Cet Expert Advisor appartient à la classe des utilitaires pour le trading manuel et semi-automatique. L'EA «   En attente d'ordre aux extremums du jour   » place deux ordres en attente aux extremums de la veille. Paramètre "   Commandes en attente : ...       " vous permet de sélectionner le type d'ordres en attente : "   Buy Stop et Sell Stop   " ou "   Buy Limit et Sell Limit   "   .       extrême       Le décalage "bas" est effectué vers le bas). "   Nouveau en attente -> supprimer les précéd
L'utilitaire de panneau "Panel Partial Closure" est conçu pour une fermeture partielle rapide d'une position qui génère un profit. Il n'a que deux paramètres : "   Fermeture partielle #1   " et "   Fermeture partielle #2   ". Fonctionne pour n'importe quel symbole et pour n'importe quel "nombre magique" - c'est-à-dire que l'utilitaire est principalement destiné au trading manuel. Comment ça fonctionne: Par exemple, vous avez plusieurs positions sur "EURUSD", "Jump 100 Index" et "XAUUSD" (or). L'
Indicateur MQL5 "Résistance et support quotidiens" - dessine des lignes de support et de résistance quotidiennes. Le dessin est effectué uniquement à l'aide d'objets graphiques (lignes de tendance) - les tampons d'indicateur ne sont pas utilisés dans cet indicateur. L'indicateur n'a pas de paramètres - la recherche de niveaux est effectuée sur les 500 dernières barres de la période "D1" et ce paramètre est câblé à l'intérieur du code. Négociation manuelle : Lors du trading manuel, il est recomm
L'utilitaire "   Multi Symbol Trailing   " déplace le Stop Loss pour toutes les positions actuellement ouvertes (multi-symbol trailing). Il est principalement destiné à aider au trading manuel. Il n'y a aucune restriction pour l'utilitaire, que ce soit par le nom de la paire de devises ou par l'identifiant individuel (numéro magique) - l'utilitaire traite absolument toutes les positions actuellement ouvertes. L'unité de mesure des paramètres «   Trailing Stop   » et «   Trailing Step   » est le
L'indicateur de tendance "Trend Two Moving Average" utilise deux types de flèches pour afficher les résultats des calculs : "Trend UP" et "Trend DN".       Flèches "Tendance haussière"       sont dessinés       Par       prix       'Faible'       barre   ,       UN       Flèches "Tendance DN" -       Par       prix       'haut'. L'algorithme de recherche de tendance est basé sur l'analyse du prix d'une barre et des valeurs de deux indicateurs 'Moving Average'. La direction de la tendance est cal
Panneau indicateur de trois TimeFrames. L'indicateur est réalisé sous la forme d'un panneau basé sur la classe CAppDialog. Le panneau peut être réduit ou déplacé dans le graphique actuel à l'aide de la souris. L'indicateur affiche trois périodes du symbole actuel dans le panneau. Dans la version actuelle, l'indicateur a un nombre minimum de paramètres - il s'agit des paramètres de trois délais: "Délai plus jeune", "   Délai   moyen   " et "   Délai   plus ancien   ". Une fois lancé, le panneau i
L'indicateur «   Market Session Times   » indique l'heure de quatre séances de trading : Asie, Europe, Amérique et Pacifique. L'heure des séances de trading est fixée   au format       GMT et ne dépend donc pas du tout du serveur de trading. Les données suivantes sont utilisées : Séance de négociation Ville GMT Asie Tokyo Singapour Shanghai 00h00 à 06h00 01h00-09h00 01h30-07h00 L'Europe  Londres Francfort 07h00-15h30 07h00-15h30 Amérique New York Chicago 13h30−20h00 13h30−20h00 Pa
Constant stream
Vladimir Karputov
Système de trading pour une variété de transactions commerciales. Vous permet de régler le solde autour de zéro - utilisé pour des tâches de remise spécifiques ou similaires. Configuré pour fonctionner avec   des comptes de couverture.   Il ne peut y avoir plus d'une position sur le marché   . Un paramètre général, le paramètre «   Step, Stop Loss, Take Profit   » est mesuré en points (exemple pour EURUSD : 1.00055-1.00045 = 10 points). Le conseiller arrête de trader (tout en restant sur le grap
L’indicateur montre les fractales de la période la plus élevée. Il est possible d'afficher deux types de fractales : « Regular Fractal » et « BW Fractal ». Considérez la formation de la fractale « UP ». « Regular Fractal » est une fractale très stricte dans laquelle chaque prix « élevé » ultérieur (à gauche et à droite de la barre centrale) est plus petit. Alors que dans 'BW Fractal' il n'y a qu'une seule condition : la barre centrale (son prix 'high') doit être la plus haute. Visuellement, la
Résistance au support de l’IA Il s'agit d'un indicateur qui recherche les lignes « Support » et « Résistance ». La recherche est effectuée à l'aide d'un algorithme d'analyse numérique et de traitement de données. Trois options de recherche sont disponibles (« mode #1 », « mode #2 » et « mode #3 »). Chacune de ces options diffère par son algorithme interne (pour le moment, il s'agit de paramètres entièrement internes, ils ne sont pas disponibles pour l'utilisateur). On peut dire que ces options d
L'utilitaire "   Open Time Manager   " ouvre une position à une heure spécifiée puis active le suivi classique. L'heure («   Heure   » : «   Minute   ») est toujours réglée dans le fuseau horaire GMT avec un décalage GMT Ofset. Il est possible de sélectionner trois options d'ouverture de position à l'aide du paramètre '   Trade mode   ' : '   ACHETER   ' '   VENDRE   ' '   ACHETER et VENDRE (simultanément)   ' '   OFF (pas d'échange, seulement les travaux de fin)   ' Le quatrième paramètre est
Indicateur       montre les lignes "Support" et "Résistance" (ces lignes sont dessinées en utilisant le style de dessin DRAW_LINE - c'est-à-dire qu'elles ne sont pas des objets graphiques). La recherche de nouveaux minimums et maximums s'effectue à gauche et à droite de la « barre de signal » - la « barre de signal » est le milieu conventionnel de chaque nouvelle construction. Pourquoi le mot Flexible figure-t-il dans le nom de l'indicateur ? Parce que nous avons la possibilité de spécifier un n
Le tableau de bord analyse les lectures de deux indicateurs : « MACD » et « Stochastique ». Affiche les signaux dans trois colonnes : pour MACD, pour Stochastique et la colonne résultante (si le signal est le même pour les deux indicateurs). La numérisation peut être sélectionnée sur une ou plusieurs périodes. Si vous désactivez tous les délais, le tableau de bord se chargera toujours, mais avec des paramètres spécifiques à de tels cas. Les signaux sont toujours vérifiés pour la barre zéro (la b
ATR Bands Alert
Vladimir Karputov
ATR Bands Alert est un indicateur de canal où la largeur du canal est calculée comme un multiplicateur constant ("Multiplier") et la valeur de l'indicateur "Average True Range". Contrairement aux bandes de Bollinger, la bande passante n'est pas modifiée si souvent : dans l'indicateur ATR Bands Alert, les bandes ont souvent de longues lignes droites. L'interprétation de l'alerte de bandes ATR est basée sur le fait que le prix se situe la plupart du temps à l'intérieur des bandes, et si le prix
Filtrer:
Aucun avis
Répondre à l'avis
Version 1.23 2024.04.28
Hid the service commands 'Prints'.
Version 1.22 2024.04.26
Fix right bar
Version 1.21 2024.02.14
Correct processing of gaps
Version 1.20 2024.02.14
Increased work speed (this is especially noticeable in the tester)
Version 1.19 2024.02.13
Fix right bars
Version 1.18 2024.02.13
Small bug fixes with fonts. Add four buffers: "BOS UP", "CHoCH UP", "BOS DOWN" and "CHoCH DOWN"
Version 1.17 2024.01.12
1.17 Refused indicator buffers. Added by BOS/CHoCH
Version 1.16 2023.12.06
The signal is searched for on a fully formed bar - therefore the signal is not redrawn.
Version 1.15 2023.10.13
++ "Max bars"
Version 1.14 2023.10.11
Amélioration mineure de l'algorithme
Version 1.11 2023.10.04
Ajout d'étiquettes de texte. La couleur est incluse dans les paramètres d'entrée.
Version 1.10 2023.10.02
Mode 'Strong' = 'true' : comparaison stricte de High et Low