• Panoramica
  • Recensioni
  • Commenti
  • Novità

Market Structure Hh Hl Lh Ll

Descrizione:

L'indicatore "Struttura del mercato HH HL LH LL" è uno strumento potente e allo stesso tempo semplice per analizzare la dinamica dei prezzi nei mercati finanziari. Questo indicatore aiuta i trader e gli investitori a identificare i cambiamenti nelle tendenze e a identificare i punti importanti nelle serie temporali dei prezzi.

Componenti chiave dell’indicatore:

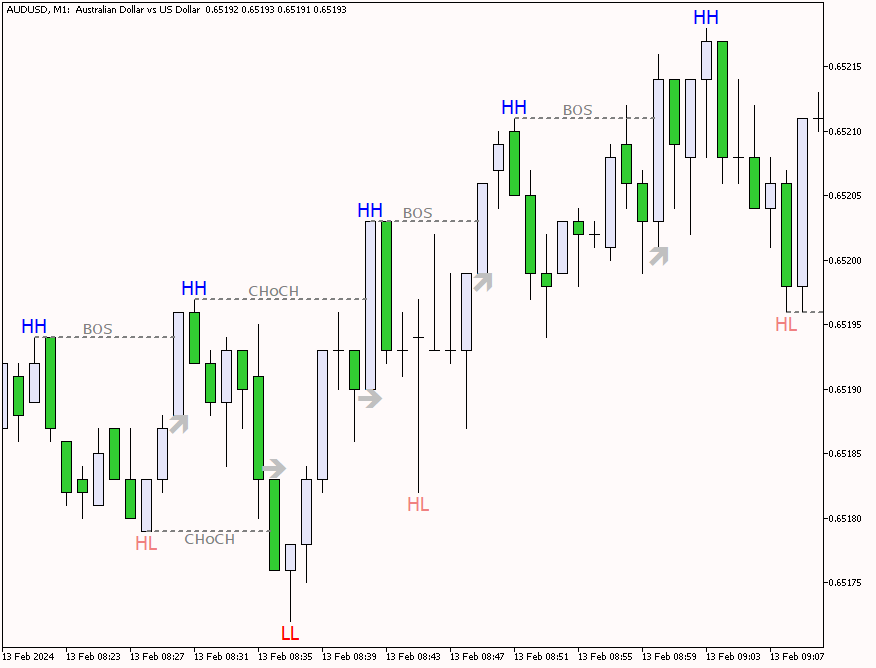
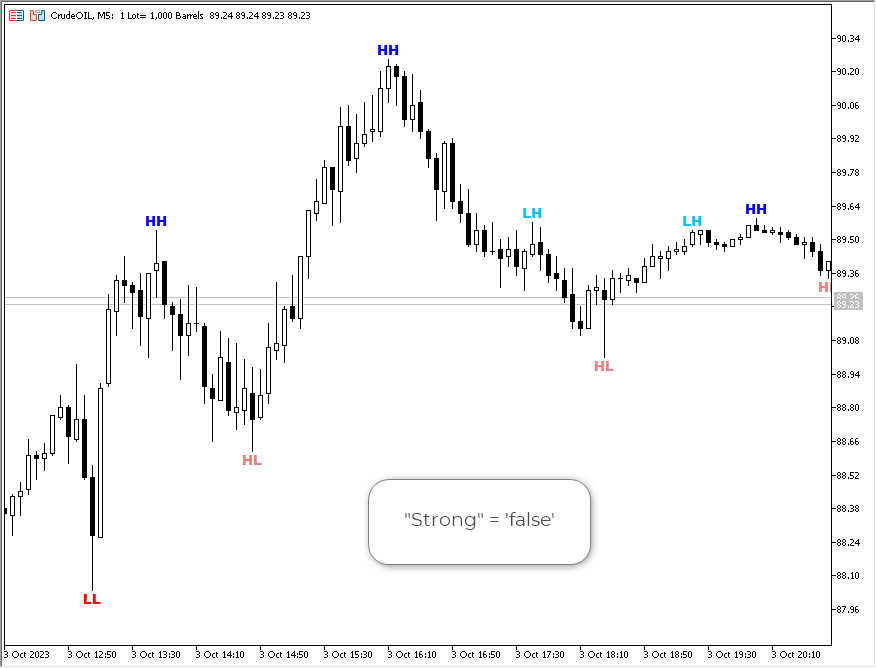
HH (Higher High): il massimo al quale il prezzo chiude sopra il massimo precedente. HH indica un rafforzamento del trend rialzista.
HL (Higher Low): il minimo al quale il prezzo chiude al di sopra del minimo precedente. HL conferma la continuazione del trend rialzista.
LH (Lower High): un massimo in cui il prezzo chiude al di sotto del massimo precedente. LH segnala una possibile inversione di tendenza.
LL (Lower Low): il minimo al quale il prezzo chiude al di sotto del minimo precedente. LL conferma l'inizio di un trend ribassista.

Come usare:

L'indicatore "Struttura del mercato HH HL LH LL" aiuta i trader e gli investitori a determinare la tendenza attuale del mercato. Un trend rialzista è caratterizzato da una sequenza di HH e HL, mentre un trend al ribasso è caratterizzato da una sequenza di LH e LL. Quando la tendenza cambia, può essere un segnale per aprire o chiudere una posizione sul mercato.

Esempio di utilizzo:

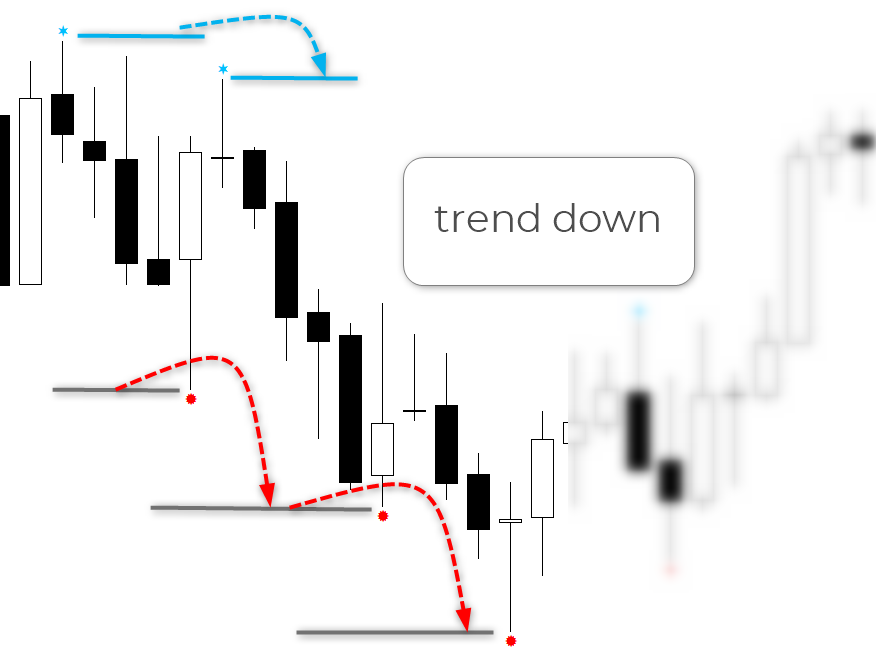
Supponiamo che tu abbia una posizione lunga su un titolo e che l'indicatore mostri una sequenza di LH e LL, indicando il possibile inizio di un trend al ribasso. Questo potrebbe essere un segnale per chiudere una posizione o impostare un limite di stop.

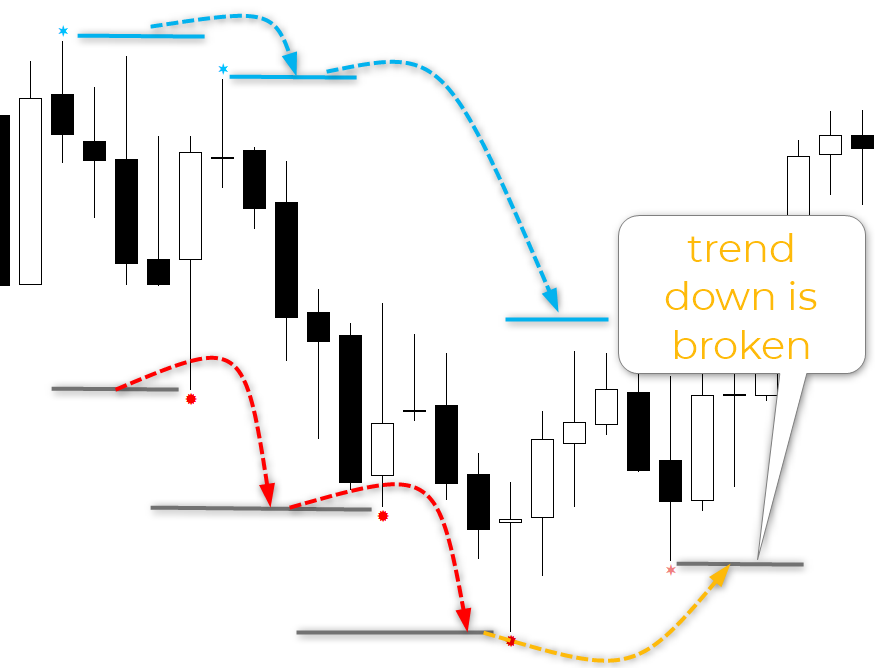
Le immagini seguenti mostrano un esempio di tendenza al ribasso e un esempio di quando questa tendenza è stata interrotta.


Prodotti consigliati
VWAP Indicator
LUC JACOBUS A VERHEECKE
4.19 (21)
Volume Weighted Average Price (VWAP) The volume weighted average price (VWAP) is a   trading   benchmark   used by traders that gives the average price a security has traded at throughout the day, based on both volume and price. It is important because it provides traders with insight into both the trend and value of a security. This indicator VWAP V2 is free and is the manual version of the extended Easy VWAP indicator (30 Euro), where the date and time properties are automatically entered. Wit
FREE
The   Visual Volatility Clustering   indicator clusters the market based on volatility. The indicator does not redraw and gives accurate data, does not use closing prices. Uses the opening prices or the highs or lows of the previous completed bar. Therefore, all information will be clear and unambiguous. The essence of the indicator is to divide the price market into certain areas according to a similar type of volatility. This can be done in any way. In this example, the indicator is configure
YY Mono Waves MT5
Yuryi Yatsenko
4 (2)
The Mono Waves indicator is designed to display the wave behavior of the market on a chart. Its appearance is presented on slide 1.   This indicator uses the PPPC (Point-Percent Price Channel) indicator, which can be downloaded for free from the  Market .              When the market moves up, the upper border of the price channel is built on High candlestick prices (for more details, see the description of the PPPC indicator at the link given above). The higher the High prices rise
FREE
Stackable VWAP
Flavio Javier Jarabeck
3.33 (6)
Volume Weighted Average Price (VWAP) is a trading benchmark commonly used by Big Players that gives the average price a Symbol has traded throughout the day. It is based on both Volume and price. Additionally we put in this indicator the MVWAP (Moving Volume Weighted Average Price). For those who do not know the usage and the importance od this indicator I recommend a great article about this subject at Investopedia ( https://www.investopedia.com/articles/trading/11/trading-with-vwap-mvwap.asp
FREE
Swiss VWAPsimple
Terence Gronowski
5 (4)
Swiss VWAPsimple Motivation Did not find free VWAP that works, the one that I found craseh. So I created a VWAP which calculates values only for the actual day. So computer resouces are not over stressed. What is VWAP, how is it used?  VWAP stands for Volume Weighed Average Price, it calculates the running sum of tick volume and the runnung sum of price times tickvolume. The division of these sums result in a weighed price (Sum P*V/Sum V). The calculation starts normally at midnight. The value
FREE
The   Visual Volatility Clustering   indicator clusters the market based on volatility. The indicator does not redraw and gives accurate data, does not use closing prices. Uses the opening prices or the highs or lows of the previous completed bar. Therefore, all information will be clear and unambiguous. The essence of the indicator is to divide the price market into certain areas according to a similar type of volatility. This can be done in any way. In this example, the indicator is configure
Value Chart Candlesticks
Flavio Javier Jarabeck
4.67 (9)
The idea of a Value Chart indicator was presented in the very good book I read back in 2020 , " Dynamic Trading Indicators: Winning with Value Charts and Price Action Profile ", from the authors Mark Helweg and David Stendahl. The idea is simple and the result is pure genius: Present candlestick Price analysis in a detrended way! HOW TO READ THIS INDICATOR Look for Overbought and Oversold levels. Of course, you will need to test the settings a lot to find the "correct" one for your approach.
FREE
VWAP and MVWAP
Flavio Javier Jarabeck
4.17 (6)
Volume Weighted Average Price (VWAP) is a trading benchmark commonly used by Big Players that gives the average price a Symbol has traded throughout the day. It is based on both Volume and price. Additionally we put in this indicator the MVWAP (Moving Volume Weighted Average Price). For those who do not know the usage and the importance od this indicator I recommend a great article about this subject at Investopedia ( https://www.investopedia.com/articles/trading/11/trading-with-vwap-mvwap.asp )
FREE
The VWAP Level indicator is a technical analysis tool that calculates the weighted average price for the traded volumes of a specific asset. The VWAP provides traders and investors with the average price of an asset over a specific time frame. It is commonly used by investors to compare data on "passive" trading operations, such as pension funds and mutual funds, but also by traders who want to check if an asset has been bought or sold at a good market price. To calculate the VWAP level we
FREE
Activity Power
Zoltan Nemet
5 (4)
Multi time frame, multy currency special swing volume indicator with engulfing waves too. Simpler to use compare to Weis Wave. User don't need to adjust wave size. Just use of the basic or the upper time frames. As a multi time frame indikator user can do  very complex time frame analysyses. As well as a multy currency indicator one can make market sector-segment analysyses. Use with Wckoff principles.
FREE
MIDAS Super VWAP
Flavio Javier Jarabeck
4.29 (14)
Imagine VWAP, MVWAP and MIDAS in one place... Well, you found it! Now you can track the movement of Big Players in various ways, as they in general pursue the benchmarks related to this measuring, gauging if they had good execution or poor execution on their orders. Traders and analysts use the VWAP to eliminate the noise that occurs throughout the day, so they can measure what prices buyers and sellers are really trading. VWAP gives traders insight into how a stock trades for that day and deter
FREE
Maquina Trader Tendencia
Fabio Rodrigues Araujo
Máquina Trader Tendência Count on our trend tracker to carry out your operations on the Mini Index and the Mini Dollar!!! Operational Green is BUY and Pink is SELL!!! Enter the operation after closing the first color block!!! Developed and Tested on the 5 or 15 minute Chart for Mini Index and Mini Dollar!!! Can be used on any chart!!! Editable colors and period!!!
ZhiBiTMG is a collection of trends and martingale indicators for all market segments and all chart cycles. Many indicators on the market violate the trend but claim to be accurate, but is it really accurate? In fact, it is not accurate! Because the market must go with the trend. This ZhiBiTMG indicator gives the Martingale signal on the premise of the trend. This will be in line with market rules. Instructions for use: The red line is the downward trend line (Sell), a total of three lines; by de
VP hidden
Emr Aljnaby
5 (4)
The indicator works to convert normal volume into levels and determine financial liquidity control points. It is very similar in function to Fixed Volume Profile. But it is considered more accurate and easier to use than the one found on Trading View because it calculates the full trading volumes in each candle and in all the brokers present in MetaTrade, unlike what is found in Trading View, as it only measures the broker’s displayed prices. To follow us on social media platforms: tel
FREE
Tick Database — export of tick database from MT5 terminal to MT4. The utility provides access to the tick database in real time. This is necessary to generate synthetic charts in the MT4 terminal, which initially does not provide for loading a tick database. For example, you can organize permanent access to the tick database for the " Seconds Chart " utility, which create seconds charts in the MT4 terminal.
FREE
I recommend you to read the  product's blog  (manual) from start to end so that it is clear from the beginning what the indicator offers. This multi time frame and multi symbol supply and demand zone dashboard indicator sends alerts when the price has reached a supply/demand zone. It is also possible to use it to be alerted about regular double tops/bottoms instead of zones. It can be used with all time frames from M1 to MN. Maximum 9 time frames can be shown in the dashboard at the same time. 
LT Mini Charts
Thiago Duarte
4.86 (7)
This is a utility indicator that creates mini charts on left side of the chart you are looking at. It is very useful to watch many timeframes simultaneously, without having to change between multiple charts. Its configuration is very simple. You can have up to 4 mini charts opened. They automatically load the template of the "parent" chart. If you have any doubt please contact me. Enjoy! This is a free indicator, but it took hours to develop. If you want to pay me a coffee, I appreciate a lot
FREE
Donchian Pro
Paulo Henrique Faquineli Garcia
5 (2)
The Donchian Channel Channels are among the most popular tools of technical analysis, as they visually convey to the analyst the limits within which most price movement tends to occur. Channel users know that valuable information can be obtained at any time, whether prices are in the central region of a band or close to one of the border lines. One of the best known techniques to explore these concepts is Bollinger Bands. However, John Bollinger was not the only one to research the applicatio
FREE
A countdown timer for the  Volume bar chart generator  and  Tick chart generator  products, which are available for download from the MQL5 Market: Tick chart generator: https://www.mql5.com/en/market/product/29215 Volume bar chart generator: https://www.mql5.com/en/market/product/47197 The counter conveniently displays the number of ticks or transactions (depending on the chart) that need to pass for a new bar to start printing. The user can set the following indicator inputs. Volume type
FREE
L'indicatore consente di determinare la direzione del prezzo corrente e la volatilità del mercato. Questa versione del Traders Dynamic Index ha eliminato il ridisegno dei dati storici, ottimizzata la velocità di calcolo dell'algoritmo, più parametri esterni per un aggiustamento più preciso e le sue funzionalità estese: aggiunta la selezione dell'oscillatore iniziale e le modalità di smoothing delle medie . Parametri: Mode Osc - stima della selezione dell'oscillatore Period Osc - il periodo di ca
VWAP Simple
Deibson Carvalho
4.03 (33)
The Volume Weighted Average Price is similar to a moving average, except volume is included to weight the average price over a period.    Volume-Weighted Average Price [VWAP] is a dynamic, weighted average designed to more accurately reflect  a security’s true average price over a given period . Mathematically, VWAP is the summation of money (i.e., Volume x Price) transacted divided by the total volume over any time horizon, typically from market open to market close. VWAP reflects the capital
FREE
Bar Color Trend
Germano Chagas
4.5 (10)
Combining the best of Price Action , Directional Movement , and Divergence/Convergence analysis, Candle Color Trend is a easy and reliable way to identify trend direction. The indicator automatically paints the candles according to the assumption that an uptrend is defined by prices that form a series of higher highs and higher lows. In contrast, a downtrend is defined by prices that form a series of lower highs and lower lows. Additionally, ADX Wilder indicator is used to measure trend weakness
FREE
A useful scanner/dashboard that shows the RSI values for multiple symbols and Time-frames. It can be easily hidden/displayed with a simple click on the scanner man top left of the dashboard. You can input upper and lower RSI values and the colours can be set to show when above/below these values. The default values are 70 and 30. There are also input colours for when the RSI is above or below 50 (but not exceeding the upper/lower levels Symbols and time-frames are input separated by commas.
Do you use volume in your reading of the market? Certainly many traders use it, and do not imagine operating without it. The Color Histogram Volume Set indicator allows the user to choose the value that he considers interesting to monitor. When you pass this you will have visual confirmation and if you want you will also have the audible alert that is given by the indicator. Of course, there are other ways to try to find a high volume, such as assessing whether the volume
Bollinger Bands B
Flavio Javier Jarabeck
5 (3)
John Bollinger created this indicator in 2010 as a way to read the original indicator (Bollinger Bands) in a more "technical" way, shown as an oscillator. The typical range of the Bollinger Bands %B is 0 - 0.5 - 1.0, where "0" represents the lower band, the "0.5" the middle band, and "1" the upper band. The line on the indicator represents the Closing prices. As simple as that. SETTINGS Bollinger Bands period of analysis Standard Deviation multiplier Shift Price type to be analyzed If you
FREE
Midas VWAP
Paulo Henrique Faquineli Garcia
4 (1)
Volume Weighted Average Price (VWAP) is a trading benchmark commonly used by Big Players that gives the average price a Symbol has traded throughout the day. It is based on both Volume and price. This indicator contains Daily VWAP and MIDAS' VWAP, which means you are able to anchor the beggining of MIDAS' calculations and, therefore you will be able to use this methodology to study price versus volume moves after anchor point. You will be able to anchor up to 3 HIGH MIDAS VWAP's and 3 LOW. Wis
FREE
The best time to trade Using this Indicator is when the time reach exactly hour,half,45 minutes,15 minutes and sometimes 5 minutes.. This indicators is helpful to those who trade boom and crash indecies.How to read this indicator first you'll see Blue allow and Red allow all these allows used to indicate or to detect the spike which will happen so the allow happens soon before the spike happen.This indicator works properly only in boom and crash trading thing which you have to consider when
Intervals
Alexandre Borela
5 (2)
Se ti piace questo progetto, lascia una recensione a 5 stelle. Seguire su instagram: borelatech Il trading di grandi volumi richiede di guardare più strumenti/cart a trovare nuove opportunità, questo indicatore vi aiuterà tramando specifico livelli dal multiplo di un numero o il suo suffisso e aggiornarli automaticamente come il prezzo cambia, un compito che altrimenti sarebbe noioso. Ad esempio, su GBPUSD, si potrebbero avere 4 istanze dell'indicatore sul grafico a trama: Ogni intervallo
FREE
The Volume Weighted ATR indicator is a helpful tool for measuring market activity. It is based on the idea of the Volume-Weighted ATR. Combining these two elements helps identify potential turning points or breakout opportunities. The indicator for the classification of the activity of the market uses the moving average and its multiples. Accordingly, where the VWATR bar is located (relative to the moving average), it is labelled as ultra-low, low, average, high, very high or ultra high. The Vo
FREE
Anchored VWAP with Alert MT5
Trade The Volume Waves Single Member P.C.
What is the Volume Weighted Average Price (VWAP)? The volume weighted average price (VWAP) is a trading benchmark used by traders that gives the average price an instrument has traded at throughout the day, based on both volume and price.  It is important because it provides traders with insight into both the trend and value of the instrument. What is the Difference between VWAP and AVWAP? While VWAP is having as starting point the beggining of the day,week,month etc. in the AVWAP you can p
Gli utenti di questo prodotto hanno anche acquistato
Innanzitutto è importante sottolineare che questo sistema di trading è un indicatore Non-Repainting, Non-Redrawing e Non-Lagging, il che lo rende ideale sia per il trading manuale che per quello automatico. Il "Sistema di Trading Smart Trend MT5" è una soluzione completa pensata sia per i trader principianti che per quelli esperti. Combina oltre 10 indicatori premium e offre più di 7 robuste strategie di trading, rendendolo una scelta versatile per diverse condizioni di mercato. Strategia di Tre
Atomic Analyst MT5
Issam Kassas
4.82 (11)
Innanzitutto, vale la pena sottolineare che questo indicatore di trading non è repaint, non è ridisegno e non presenta ritardi, il che lo rende ideale sia per il trading manuale che per quello automatico. L'Analista Atomico è un indicatore di azione del prezzo PA che utilizza la forza e il momentum del prezzo per trovare un miglior vantaggio sul mercato. Dotato di filtri avanzati che aiutano a rimuovere rumori e segnali falsi, e aumentare il potenziale di trading. Utilizzando più strati di in
FX Volume MT5
Daniel Stein
4.94 (17)
Ricevi il tuo aggiornamento quotidiano sul mercato con dettagli e schermate tramite il nostro Morning Briefing qui su mql5 e su Telegram ! FX Volume è il PRIMO e UNICO indicatore di volume che fornisce una visione REALE del sentiment del mercato dal punto di vista del broker. Fornisce informazioni straordinarie su come gli operatori di mercato istituzionali, come i broker, sono posizionati sul mercato Forex, molto più velocemente dei rapporti COT. Vedere queste informazioni direttamente sul vo
Quantum Trend Sniper
Bogdan Ion Puscasu
5 (37)
Presentazione       Quantum Trend Sniper Indicator   , l'innovativo indicatore MQL5 che sta trasformando il modo in cui identifichi e scambi le inversioni di tendenza! Sviluppato da un team di trader esperti con un'esperienza di trading di oltre 13 anni,       Indicatore Quantum Trend Sniper       è progettato per spingere il tuo viaggio di trading verso nuove vette con il suo modo innovativo di identificare le inversioni di tendenza con una precisione estremamente elevata. *** Acquista Quant
Trend Screener Pro MT5
STE S.S.COMPANY
4.89 (61)
Indicatore di tendenza, soluzione unica rivoluzionaria per il trading di tendenze e il filtraggio con tutte le importanti funzionalità di tendenza integrate in un unico strumento! È un indicatore multi-timeframe e multi-valuta al 100% non ridipingibile che può essere utilizzato su tutti i simboli/strumenti: forex, materie prime, criptovalute, indici e azioni. Trend Screener è un indicatore di tendenza che segue un indicatore efficiente che fornisce segnali di tendenza a freccia con punti nel gra
Innanzitutto, vale la pena sottolineare che questo Strumento di Trading è un Indicatore Non-Ridipingente, Non-Ridisegnante e Non-Laggante, il che lo rende ideale per il trading professionale. L'Indicatore Smart Price Action Concepts è uno strumento molto potente sia per i nuovi che per i trader esperti. Racchiude più di 20 utili indicatori in uno solo, combinando idee di trading avanzate come l'Analisi del Trader del Circolo Interno e le Strategie di Trading dei Concetti del Denaro Intelligen
Top indicator for MT5   providing accurate signals to enter a trade without repainting! It can be applied to any financial assets:   forex, cryptocurrencies, metals, stocks, indices .  Watch  the video  (6:22) with an example of processing only one signal that paid off the indicator! MT4 version is here It will provide pretty accurate trading signals and tell you when it's best to open a trade and close it. Most traders improve their trading results during the first trading week with the help of
FX Power MT5 NG
Daniel Stein
5 (4)
Ricevi il tuo aggiornamento quotidiano sul mercato con dettagli e schermate tramite il nostro Morning Briefing qui su mql5 e su Telegram ! FX Power MT5 NG è la nuova generazione del nostro popolare misuratore di forza delle valute, FX Power. Cosa offre questo misuratore di forza di nuova generazione? Tutto ciò che avete amato dell'FX Power originale IN PIÙ Analisi della forza di ORO/XAU Risultati di calcolo ancora più precisi Periodi di analisi configurabili individualmente Limite di calcolo pe
RelicusRoad Pro MT5
Relicus LLC
4.82 (22)
Ora $ 147 (aumentando a $ 499 dopo alcuni aggiornamenti) - account illimitati (PC o MAC) Manuale utente di RelicusRoad + Video di formazione + Accesso al gruppo Discord privato + Stato VIP UN NUOVO MODO DI GUARDARE IL MERCATO RelicusRoad è l'indicatore di trading più potente al mondo per forex, futures, criptovalute, azioni e indici, fornendo ai trader tutte le informazioni e gli strumenti di cui hanno bisogno per rimanere redditizi. Forniamo analisi tecniche e piani di trading per aiutar
Auto Order Block with break of structure based on ICT and Smart Money Concepts Futures Break of Structure ( BoS )             Order block ( OB )            Higher time frame Order block / Point of Interest ( POI )    shown on current chart           Fair value Gap ( FVG ) / Imbalance   ,  MTF      ( Multi Time Frame )    Volume Imbalance     ,  MTF          vIMB Gap’s Equal High / Low’s     ,  MTF             EQH / EQL Liquidity               Current Day High / Low           HOD /
XQ Indicator MetaTrader 5
Marzena Maria Szmit
5 (1)
Step into the realm of Forex trading with confidence and precision using XQ, a cutting-edge Forex indicator designed to elevate your trading game to unprecedented heights. Whether you're a seasoned trader or just stepping into the world of currency exchange, XQ Forex Indicator empowers you with the insights and signals needed to make informed trading decisions. The signal conditions are a combination of three indicators, and XQ Forex Indicator only display  medium and long-term trends . The ind
Blahtech Supply Demand MT5
Blahtech Limited
4.57 (14)
Was: $299  Now: $99   Supply Demand uses previous price action to identify potential imbalances between buyers and sellers. The key is to identify the better odds zones, not just the untouched ones. Blahtech Supply Demand indicator delivers functionality previously unavailable on any trading platform. This 4-in-1 indicator not only highlights the higher probability zones using a multi-criteria strength engine, but also combines it with multi-timeframe trend analysis, previously confirmed swings
Advanced Supply Demand MT5
Bernhard Schweigert
4.53 (15)
La migliore soluzione per qualsiasi principiante o trader esperto! Questo indicatore è uno strumento di trading unico, di alta qualità e conveniente perché abbiamo incorporato una serie di funzionalità proprietarie e una nuova formula. Con questo aggiornamento, sarai in grado di mostrare fusi orari doppi. Non solo potrai mostrare una TF più alta, ma anche entrambe, la TF del grafico, PIÙ la TF più alta: SHOWING NESTED ZONES. Tutti i trader di domanda di offerta lo adoreranno. :) Informazioni imp
ICT, SMC, SMART MONEY CONCEPTS, SMART MONEY, Smart Money Concept, Support and Resistance, Trend Analysis, Price Action, Market Structure, Order Blocks, BOS/CHoCH,   Breaker Blocks ,  Momentum Shift,   Supply&Demand Zone/Order Blocks , Strong Imbalance,   HH/LL/HL/LH,    Fair Value Gap, FVG,  Premium  &   Discount   Zones, Fibonacci Retracement, OTE, Buy Side Liquidity, Sell Side Liquidity, BSL/SSL Taken, Equal Highs & Lows, MTF Dashboard, Multiple Time Frame, BigBar, HTF OB, HTF Market Structure
L'indicatore Quadrato di Gann è uno strumento potente di analisi di mercato basato sull'articolo "Formula Matematica per le Previsioni di Mercato" scritto da W.D. Gann. Questo strumento utilizza concetti matematici e teorie di Gann per effettuare un'analisi precisa del mercato. Utilizza i quadrati di 144, 90, 52 e anche il quadrato di 9. Inoltre, integra il metodo del  per il quadrato di 9 e la sua relazione con canali e modelli stellari di quel quadrato. Manuale Utente e Applicazione: Prima di
AW Trend Predictor MT5
AW Trading Software Limited
4.76 (54)
La combinazione di trend e livelli di rottura in un unico sistema. Un algoritmo di indicatore avanzato filtra il rumore del mercato, determina la tendenza, i punti di ingresso e i possibili livelli di uscita. I segnali indicatori sono registrati in un modulo statistico, che permette di selezionare gli strumenti più adatti, mostrando l'efficacia dello storico dei segnali. L'indicatore calcola i segni Take Profit e Stop Loss. Manuale e istruzioni ->   QUI   / versione MT4 ->   QUI Come fare tradi
Il profitto dalla struttura del mercato cambia quando il prezzo si inverte e si ritira. L'indicatore di avviso di inversione della struttura del mercato identifica quando una tendenza o un movimento di prezzo si sta avvicinando all'esaurimento e pronto a invertire. Ti avvisa dei cambiamenti nella struttura del mercato che in genere si verificano quando stanno per verificarsi un'inversione o un forte pullback. L'indicatore identifica inizialmente i breakout e lo slancio del prezzo, ogni volta
Volume by Price MT5
Brian Collard
5 (3)
The Volume by Price Indicator for MetaTrader 5 features Volume Profile and Market Profile TPO (Time Price Opportunity). Get valuable insights out of currencies, equities and commodities data. Gain an edge trading financial markets. Volume and TPO histogram bar and line charts. Volume Footprint charts. TPO letter and block marker charts including split structures. Versatile segmentation and compositing methods. Static, dynamic and flexible ranges with relative and/or absolute visualizations. Lay
Presentazione       Quantum Breakout PRO   , l'innovativo indicatore MQL5 che sta trasformando il modo in cui scambi le zone di breakout! Sviluppato da un team di trader esperti con un'esperienza di trading di oltre 13 anni,       Quantum Breakout PRO       è progettato per spingere il tuo viaggio di trading a nuovi livelli con la sua strategia innovativa e dinamica della zona di breakout. Quantum Breakout Indicator ti fornirà frecce di segnalazione sulle zone di breakout con 5 zone target
TrendLine PRO MT5
Evgenii Aksenov
4.78 (49)
The Trend Line PRO indicator is an independent trading strategy. It shows the trend change, the entry point to the transaction, as well as automatically calculates three levels of Take Profit and Stop Loss protection Trend Line PRO is perfect for all Meta Trader symbols: currencies, metals, cryptocurrencies, stocks and indices Advantages of Trend Line PRO Never redraws its signals The possibility of using it as an independent strategy It has three automatic levels Take Profit and Stop Loss lev
Owl Smart Levels MT5
Sergey Ermolov
4.47 (36)
Versione MT4  |  FAQ L' indicatore Owl Smart Levels è un sistema di trading completo all'interno dell'unico indicatore che include strumenti di analisi di mercato popolari come i frattali avanzati di Bill Williams , Valable ZigZag che costruisce la corretta struttura a onde del mercato, e i livelli di Fibonacci che segnano i livelli esatti di entrata nel mercato e luoghi per prendere profitti. Descrizione dettagliata della strategia Istruzioni per lavorare con l'indicatore Consulente-assistente
Gartley Hunter Multi
Siarhei Vashchylka
5 (5)
Gartley Hunter Multi - An indicator for searching for harmonic patterns simultaneously on dozens of trading instruments and on all classic timeframes: (m1, m5, m15, m30, H1, H4, D1, Wk, Mn). Manual (Be sure to read before purchasing) | Version for MT4 Advantages 1. Patterns: Gartley, Butterfly, Shark, Crab. Bat, Alternate Bat, Deep Crab, Cypher 2. Simultaneous search for patterns on dozens of trading instruments and on all classic timeframes 3. Search for patterns of all possible sizes. Fr
Trend Line Map Pro MT5
STE S.S.COMPANY
4.67 (9)
Trend Line Map indicator is an addons for   Trend Screener Indicator . It's working as a scanner for all signals generated by Trend screener ( Trend Line Signals ) . It's a Trend Line Scanner based on Trend Screener Indicator.  If you don't have Trend Screener Pro Indicator,   the Trend Line Map Pro will not work.     LIMITED TIME OFFER : Trend Line Map Indicator is available for only 50 $ and lifetime. ( Original price 125$ ) By accessing to our MQL5 Blog,  you can find all our premium indica
TrendDecoder Premium MT5
Christophe, Pa Trouillas
5 (1)
Identificare i range e le prossime mosse probabili     |    Ottenere i primi segnali e la forza delle tendenze     |    Ottenere uscite chiare prima dell'inversione     |    Individuare i livelli di Fibo che il prezzo testerà   |  Indicatore non tracciante e non ritardato - ideale per il trading manuale e automatizzato - adatto a tutti gli asset e a tutte le unità temporali 50% di sconto   - per il lancio poi torna a   >>   149 $ Dopo l'acquisto,   contattatemi su questo canale  per le impostazi
MetaBands M5
Vahidreza Heidar Gholami
4.67 (3)
MetaBands uses powerful and unique algorithms to draw channels and detect trends so that it can provide traders with potential points for entering and exiting trades. It’s a channel indicator plus a powerful trend indicator. It includes different types of channels which can be merged to create new channels simply by using the input parameters. MetaBands uses all types of alerts to notify users about market events. Features Supports most of the channel algorithms Powerful trend detection algorith
TPSproTREND PrO MT5
Roman Podpora
5 (5)
TPSpro TRENDPRO  - is a trend indicator that automatically analyzes the market and provides information about the trend and each of its changes, as well as giving signals for entering trades without redrawing! The indicator uses each candle, analyzing them separately. referring to different impulses - up or down impulse. Exact entry points into transactions for currencies, crypto, metals, stocks, indices!  -  Version MT4                  DETAILED DESCRIPTION        /       TRADING SETUPS       
Was: $249  Now: $99   Market Profile defines a number of day types that can help the trader to determine market behaviour. A key feature is the Value Area, representing the range of price action where 70% of trading took place. Understanding the Value Area can give traders valuable insight into market direction and establish the higher odds trade. It is an excellent addition to any system you may be using. Inspired by Jim Dalton’s book “Mind Over Markets”, this indicator is designed to suit the
Disegna automaticamente i livelli di supporto e resistenza PIÙ i gap delle candele di propulsione sul vostro grafico, in modo da poter vedere dove il prezzo potrebbe dirigersi successivamente e/o potenzialmente invertire. Questo indicatore è stato progettato per essere utilizzato come parte della metodologia di trading di posizione insegnata sul mio sito web (The Market Structure Trader) e visualizza informazioni chiave per il targeting e le potenziali entrate. MT4 Version:  https://www.mql5.
Golden Spikes Detector
Batsirayi L Marango
5 (1)
Golden Spikes Detector This indicator is based on an advanced strategy primarily for trading spikes on Boom and Crash Indices. Complex algorithms were implemented to detect high probability entries only. It alerts on potential Buy and Sell entries. To trade spikes on the Deriv or Binary broker, only take Buy Boom and Sell Cash alerts. It was optimised to be loaded on 5-minute timeframe although multiple timeframe analysis is done in the background. Features ·             Desktop pop up and sound
IX Power MT5
Daniel Stein
5 (2)
IX Power   porta finalmente l'imbattibile precisione di FX Power ai simboli non-Forex. Determina con precisione l'intensità delle tendenze a breve, medio e lungo termine dei vostri indici preferiti, azioni, materie prime, ETF e persino criptovalute. Potete   analizzare tutto ciò che   il vostro terminale ha da offrire. Provatelo e sperimentate come   il vostro tempismo migliori significativamente   durante il trading. Caratteristiche principali di IX Power Risultati di calcolo precisi al
Altri dall’autore
La strategia di trading di tendenza "Super Trend flessibile Alert EA" si basa sull'indicatore con lo stesso nome "Super Trend flessibile Alert". L'advisor utilizza tutte le informazioni dell'indicatore, quindi l'advisor ha solo tre parametri, questi sono: “Tempo di lavoro” – specifica il periodo di tempo di lavoro, il periodo di tempo in cui viene creato l’indicatore e anche da cui vengono presi i dati “OHLC”. "Stop Loss" è la dimensione costante dello stop loss, misurata in "punti" (puoi veder
L'indicatore di tendenza "   Avviso flessibile Super Trend   " ha un minimo di impostazioni. Questo indicatore è progettato per essere il più facile possibile da usare. L'indicatore mostra il trend con una linea principale colorata (linea "SuperTrend", che puoi vedere nella finestra "Finestre dati"). Inoltre, nei punti in cui il trend cambia, l'indicatore mostra delle frecce colorate (   icone "STBuy" e "   STSell", che puoi vedere nella finestra "Finestre dati"       ). Nei punti in cui la tend
L’indicatore mostra una divergenza rialzista e ribassista. L'indicatore stesso (come il normale stocastico) viene visualizzato in una sottofinestra. Interfaccia grafica   : Nella finestra principale vengono creati oggetti grafici "linea di tendenza" - prodotti dal prezzo "Basso" al prezzo "Basso" (per divergenza rialzista) e prodotti dal prezzo "Alto" al prezzo "Alto" (per divergenza ribassista) ). L'indicatore disegna nella sua finestra utilizzando esclusivamente buffer grafici: “Main”, “Signa
L'indicatore 'Supertrend MetaTrader 5' è la base del più semplice sistema di trend trading. Eppure rimane molto efficace. L'indicatore funziona su qualsiasi periodo di tempo (sul periodo di tempo del grafico corrente). Dal nome puoi vedere che questo indicatore segue la tendenza e quando la tendenza cambia, l'indicatore mostra accuratamente il punto del cambiamento di tendenza. La base di "Supertrend MetaTrader 5" è il confronto dei valori del prezzo e dell'indicatore "Average True Range" molti
The Candle Length Indicator Alarm generates a sound alert, sends a push notification and an email when the size of the current candlestick changes. The size of the current candlestick can be measured in two ways: The first method: the size of the candlestick is measured from the beginning of the candlestick (from the OPEN price). The second method: the size of the candlestick is measured from current price. The indicator has the following settings: sound — a sound file from the folder: "...\Meta
The Buy Sell Color Background indicator changes the background color depending on position direction. It has three settings: Background color for BUY - background color for a Buy position Background color for SELL - background color for a Sell position Default background color - background color with no open position After you detach the indicator from a chart, its background color changes to Default background color .
The calculator of signals operates directly from the MetaTrader 5 terminal, which is a serious advantage, since the terminal provides a preliminary selection and sorts out signals. This way, users can see in the terminal only the signals that ensure a maximum compatibility with their trading accounts. The calculator of signals gives the answer to the one of the questions most frequently asked by users of the Signals service: "Will I be able to subscribe to the signal NNN, and what volume of the
Arrow Signal
Vladimir Karputov
Questo indicatore appartiene alla categoria "Stocastico". Ho cercato di semplificare il più possibile il controllo dell'indicatore, quindi le impostazioni minime sono mostrate nei parametri di input: questa è la scelta di un'icona per le frecce di segnale. Il segnale "Acquista" è codificato con il   parametro "Codice freccia Acquista   " e il segnale "Vendi" è codificato con il parametro "   Codice freccia Vendi".   I codici freccia del segnale per i segnali (si prega di utilizzare i valori da 3
Arrow Signal EA
Vladimir Karputov
An Expert Advisor based on the custom indicator. Search for a signal at every tick. Positions are closed by an opposite signal. No trailing. There is no stop loss. There is no take profit. Has a minimum of settings Money management: Lot OR Risk   - type Money management The value for "Money management"   - Money management value Deviation   - admissible slippage Buy Arrow code   (font Wingdings) - character code from 'Wingdings' font for BUY signals Sell Arrow code   (font Wingdings) - characte
Ma Dema Alert
Vladimir Karputov
L'indicatore visualizza tre linee e monitora due tipi di intersezioni. Tre linee dell'indicatore: "   MA   " - indicatore lento "Media mobile", "   DEMA Slow   " - indicatore lento "   Double Exponential Moving Average" e "   DEMA Fast   " - indicatore veloce "Double Exponential Moving Average". Due tipi di intersezioni       : "   Alert Price MA   " - il prezzo attraversa la   linea "MA" e   "   Alert DEMA DEMA   " - le linee si incrociano       "DEMA lento" e   "DEMA veloce   ". Durante l'attr
Questo Expert Advisor appartiene alla classe delle utilità per il trading manuale e semiautomatico. L'"   ordine in sospeso agli estremi del giorno   " EA colloca due ordini in sospeso agli estremi del giorno precedente. Parametro "   Ordini in sospeso: ...       " permette di selezionare il tipo di ordini pendenti: "   Buy Stop e Sell Stop   " o "   Buy Limit e Sell Limit   "   .       estremo       L'offset "Basso" viene eseguito verso il basso). "   Nuovi pendenti -> cancella precedenti   " i
Il pannello di utilità "Panel Partial Closure" è destinato alla rapida chiusura parziale di una posizione che ha un profitto. Ha solo due parametri: "   Chiusura parziale #1   " e "   Chiusura parziale #2   ". Funziona per qualsiasi simbolo e per qualsiasi "numero magico", ovvero l'utilità è destinata principalmente al trading manuale. Come funziona: Ad esempio, hai diverse posizioni su "EURUSD", "Jump 100 Index" e "XAUUSD" (oro). L'utility trova la posizione con il maggior profitto - nello scre
Indicatore MQL5 "Resistenza e supporto giornalieri": disegna linee di supporto e resistenza giornaliere. Il disegno viene eseguito solo con l'ausilio di oggetti grafici (linee di tendenza) - i buffer indicatori non vengono utilizzati in questo indicatore. L'indicatore non ha impostazioni - la ricerca dei livelli viene effettuata sulle ultime 500 barre dall'intervallo di tempo "D1" e questo parametro è cablato all'interno del codice. Trading manuale: Quando si fa trading manualmente, si consigli
L'utility "   Multi Symbol Trailing   " sposta lo Stop Loss per tutte le posizioni attualmente aperte (multi-symbol trailing). È destinato principalmente ad assistere nel trading manuale. Non ci sono restrizioni per l'utilità né per il nome della coppia di valute né per l'identificatore individuale (numero magico): l'utilità elabora assolutamente tutte le posizioni attualmente aperte. L'unità di misura dei parametri "   Trailing Stop   " e "   Trailing Step   " è il punto (la differenza tra il p
L'indicatore di tendenza "Trend Two Moving Average" utilizza due tipi di freccia per visualizzare i risultati del calcolo: "Trend UP" e "Trend DN".       Frecce "Trend Up"       sono disegnate       Di       prezzo       'Basso'       barra   ,       UN       Frecce "Trend DN" -       Di       prezzo       'alto'. L'algoritmo di ricerca dei trend si basa sull'analisi del prezzo di una barra e dei valori di due indicatori di 'Media Mobile'. La direzione del trend è calcolata sulla barra corrente
Three TimeFrames
Vladimir Karputov
Pannello indicatore a tre TimeFrames. L'indicatore è realizzato sotto forma di un pannello basato sulla classe CAppDialog. Il pannello può essere ridotto a icona o spostato all'interno del grafico corrente utilizzando il mouse. L'indicatore mostra tre tempi del simbolo corrente nel pannello. Nella versione attuale, l'indicatore ha un numero minimo di impostazioni: questi sono i parametri di tre periodi di tempo: "Frame di tempo più giovane", "   Frame di tempo   medio   " e "   Frame di tempo  
L'indicatore "   Market Session Times   " mostra il tempo di quattro sessioni di negoziazione: Asia, Europa, America e Pacifico. L'orario delle sessioni di negoziazione è impostato   nel formato       GMT e quindi non dipende affatto dal server di trading. Vengono utilizzati i seguenti dati: Sessione di negoziazione Città GMT Asia Tokio Singapore Shangai 00:00-06:00 01:00-09:00 01:30-07:00 Europa Londra Francoforte 07:00-15:30 07:00-15:30 America New York Chicago 13:30-20:00 13:30-
Constant stream
Vladimir Karputov
Sistema di trading per una varietà di transazioni commerciali. Consente di impostare il saldo in modo che oscilli intorno allo zero, utilizzato per attività di sconto specifiche o simili. Configurato per funzionare con   conti di copertura.   Non può esserci più di una posizione nel mercato   . Un'impostazione generale, il parametro "   Step, Stop Loss, Take Profit   " viene misurato in punti (esempio per EURUSD: 1.00055-1.00045 = 10 punti). L'advisor interrompe il trading (rimanendo sul grafico
L'indicatore mostra i frattali dal periodo di tempo più elevato. È possibile visualizzare due tipi di frattali: 'Frattale regolare' e 'Frattale BW'. Consideriamo la formazione del frattale 'SU'. Il "frattale regolare" è un frattale molto rigoroso in cui ogni successivo prezzo "alto" (a sinistra e a destra della barra centrale) è più piccolo. Mentre in 'BW Fractal' c'è una sola condizione: la barra centrale (il suo prezzo 'alto') deve essere la più alta. Visivamente, la differenza tra queste due
Resistenza al supporto dell'IA Questo è un indicatore che cerca le linee “Supporto” e “Resistenza”. La ricerca viene effettuata utilizzando un algoritmo per l'analisi numerica e l'elaborazione dei dati. Sono disponibili tre opzioni di ricerca (“modalità n. 1”, “modalità n. 2” e “modalità n. 3”). Ognuna di queste opzioni differisce nel suo algoritmo interno (al momento si tratta di impostazioni completamente interne, non sono disponibili per l'utente). Possiamo dire che queste opzioni differiscon
Open Time Manager
Vladimir Karputov
L'utilità "   Open Time Manager   " apre una posizione a un'ora specificata e quindi attiva il trailing classico. L'ora ("   Ora   ":"   Minuti   ") è sempre impostata nel fuso orario GMT con un offset GMT Offset. E' possibile selezionare tre opzioni per l'apertura di una posizione utilizzando il parametro '   Modalità Trade   ': '   ACQUISTARE   ' '   VENDERE   ' '   ACQUISTA e VENDI (contemporaneamente)   ' '   OFF (no scambi, solo lavori finali)   ' Il quarto parametro viene utilizzato quand
Indicatore           mostra le linee "Supporto" e "Resistenza" (queste linee sono disegnate utilizzando lo stile di disegno DRAW_LINE - cioè non sono oggetti grafici). La ricerca di nuovi minimi e massimi avviene a sinistra e a destra della "barra del segnale" - la "barra del segnale" è il centro convenzionale di ogni nuova costruzione. Perché la parola Flessibile nel nome dell'indicatore? Perché abbiamo la possibilità di specificare un numero diverso di barre a sinistra (“Left Bars”) e a destra
Il dashboard scansiona le letture di due indicatori: "MACD" e "Stocastico". Visualizza i segnali in tre colonne: per MACD, per Stocastico e la colonna risultante (se il segnale è lo stesso per entrambi gli indicatori). La scansione può essere selezionata su uno o più intervalli temporali. Se disabiliti tutti gli intervalli di tempo, la dashboard verrà comunque caricata, ma con impostazioni specifiche per questi casi. I segnali vengono sempre controllati per la barra zero (la barra zero è la barr
ATR Bands Alert
Vladimir Karputov
ATR Bands Alert è un indicatore di canale in cui la larghezza del canale viene calcolata come un moltiplicatore costante ("Moltiplicatore") e il valore dell'indicatore "Average True Range". A differenza delle bande di Bollinger, la larghezza di banda non viene modificata così spesso: nell'indicatore ATR Bands Alert, le bande spesso hanno lunghe linee rette. L'interpretazione dell'ATR Bands Alert si basa sul fatto che il prezzo si trova all'interno delle bande per la maggior parte del tempo e,
Filtro:
Nessuna recensione
Rispondi alla recensione
Versione 1.23 2024.04.28
Hid the service commands 'Prints'.
Versione 1.22 2024.04.26
Fix right bar
Versione 1.21 2024.02.14
Correct processing of gaps
Versione 1.20 2024.02.14
Increased work speed (this is especially noticeable in the tester)
Versione 1.19 2024.02.13
Fix right bars
Versione 1.18 2024.02.13
Small bug fixes with fonts. Add four buffers: "BOS UP", "CHoCH UP", "BOS DOWN" and "CHoCH DOWN"
Versione 1.17 2024.01.12
1.17 Refused indicator buffers. Added by BOS/CHoCH
Versione 1.16 2023.12.06
The signal is searched for on a fully formed bar - therefore the signal is not redrawn.
Versione 1.15 2023.10.13
++ "Max bars"
Versione 1.14 2023.10.11
Miglioramento minore dell'algoritmo
Versione 1.11 2023.10.04
Aggiunte etichette di testo. Il colore è incluso nei parametri di input.
Versione 1.10 2023.10.02
Modalità 'Forte' = 'vero': confronto rigoroso tra Alto e Basso