VolumeCrossOver Mt4
- Indicateurs
- Version: 1.1
- Mise à jour: 24 juillet 2023
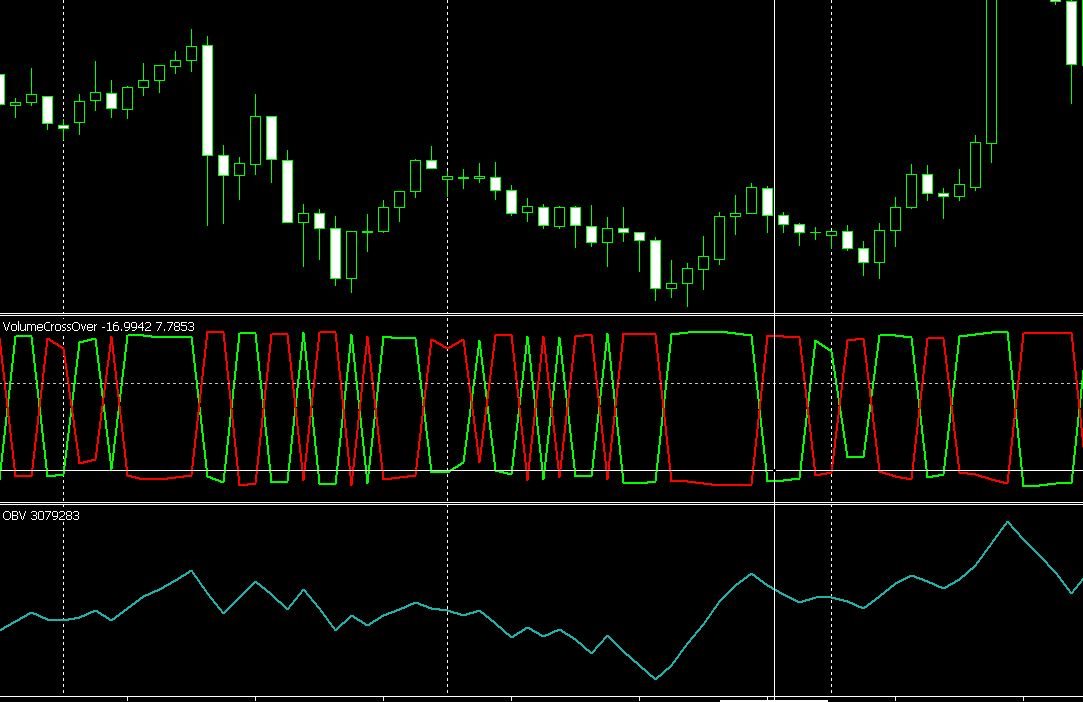
Le "Volume Cross Over" est un indicateur qui mesure le flux de volume positif et négatif dans un instrument financier, tel qu'une action, une matière première ou un indice. Il est basé sur l'idée de l'On-Balance Volume développée par Joseph Granville. Cependant, au lieu de tracer des lignes de tendance, cet indicateur montre des croisements de volumes. Lorsque le prix de clôture d'un actif est supérieur au prix de clôture précédent, alors le volume haussier est supérieur à zéro et le volume baissier est négatif. Cela suggère que le volume d'achat domine et que le prix est susceptible de continuer sa tendance à la hausse.
Inversement, lorsque le prix de clôture est inférieur au prix de clôture précédent, le volume baissier est supérieur à zéro et le volume haussier est négatif. Cela indique que le volume de vente domine et que le prix peut continuer à baisser.
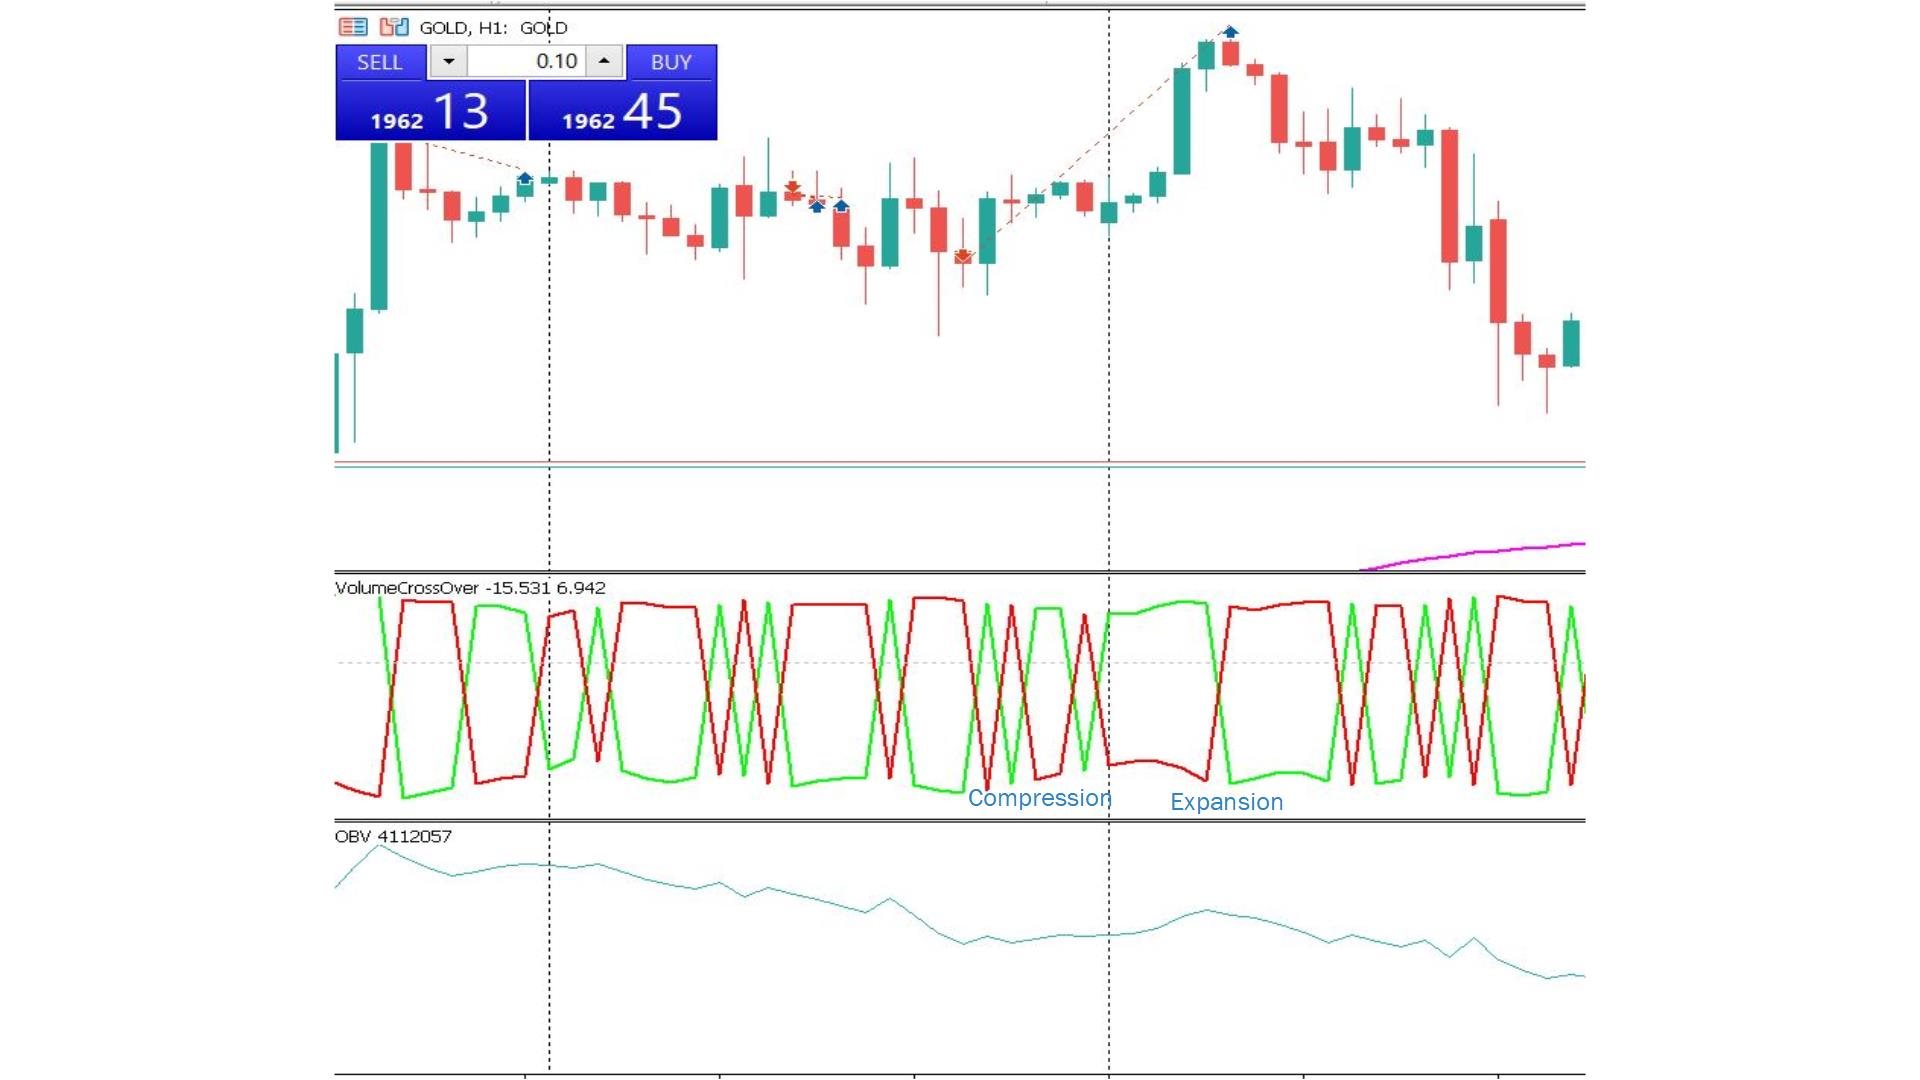
Le "Volume Cross Over" forme un schéma similaire à un ressort avec des périodes de compression et d'expansion. Chaque compression est suivie d'une expansion et vice versa. Il peut être utilisé...
Avantages :
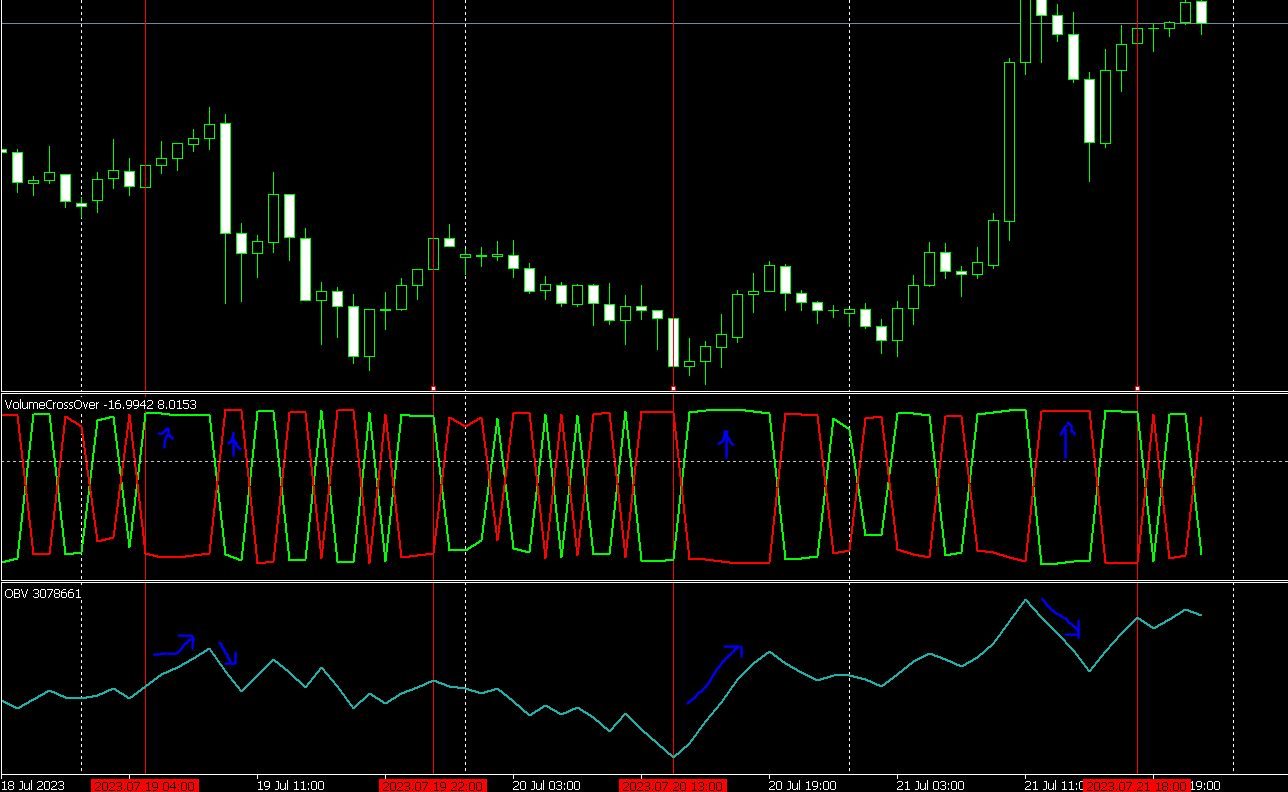
La compression et l'expansion de cet indicateur permettent aux traders d'identifier des points d'entrée potentiels sur le marché. Une fois qu'il y a une expansion, une contraction suit et vice versa.
C'est un indicateur prédictif, tout comme l'On-Balance Volume.
Inconvénient :
Il n'indique pas les divergences entre le prix et l'indicateur, comme c'est le cas de l'On-Balance Volume.
Comme pour tout indicateur de trading, il est essentiel de comprendre pleinement ses points forts et ses limites. Bien que l'indicateur "Volume Cross Over" puisse fournir des informations précieuses sur le flux de volume et les points d'entrée sur le marché, les traders devraient envisager de l'utiliser en combinaison avec d'autres indicateurs et outils pour former une stratégie de trading globale. De plus, les performances passées ne garantissent pas les résultats futurs, il est donc crucial de gérer les risques avec prudence lors de l'application de toute stratégie de trading basée sur des indicateurs techniques.
I've been testing it for around a week so far, which has given me good feedback. worth keeping it on your platform. Yes, it is not 100% accurate, but it eliminates a lot of the fake singles for better trading decisions. Thank you.