Regardez les tutoriels vidéo de Market sur YouTube
Comment acheter un robot de trading ou un indicateur
Exécutez votre EA sur
hébergement virtuel
hébergement virtuel
Test un indicateur/robot de trading avant d'acheter
Vous voulez gagner de l'argent sur Market ?
Comment présenter un produit pour qu'il se vende bien
Expert Advisors et indicateurs payants pour MetaTrader 5 - 115
Советник написан по стратегии из видео.
Советник можно поставить на два графика одной валютной пары назначив им разные Magic number и указав разные направления торговли параметром Direction of trade. Стратегия была незначительно изменена. В видео показано, что закрываются сделки без прибыли, так сказать в ноль. Этот советник каждый раз закрывает прибыль не меньше стоимости шага сетки. Ещё добавлена возможность установить размер прибыли при достижении которой советник закроет все позиции своего

Automated trading system it's a professional instrument which allows you to achieve results without the negative influence of a human factor. Effectiveness is confirmed by trading on a real account since 2017. Perform all the tests with the modelling type RealTicks or EveryTick. LINKS Signal trading monitoring ( WeTrade + BOA System ); Telegram community; Video tutorial installation; Video tutorial optimization; Presets for popular symbols. TRADING STRATEGY DESCRIPTION The trading strategy
A trader cannot always discover what the last closed bar is by volume. This EA, analyzing all volumes inside this bar, can more accurately predict the behavior of large players in the market. In the settings, you can make different ways to determine the volume for growth, or for falling. This adviser can not only trade, but also visually display what volumes were inside the bar (for buying or selling). In addition, it has enough settings so that you can optimize the parameters for almost any ac

Super Zone For several years of observing the principles of the market, Super Zone worked, both then and now, because the indicator allows you to see the trading range of the week and even the month that major market participants use. It’s very easy to use, we work on H4 in the weekly range ( in the tester it doesn’t work in the demo mode ) - we sell from the upper zones, we buy from the lower ones. It marks the zones from the beginning of the week (month) that are not redrawn , works on

Горячие клавиши плюс клик левой кнопки мыши на графике. Советник открывает сделки, выставляет лимитные и стоповые ордера, удаляет ордера и закрывает позиции, также делает реверс открытых позиций, выставляет прописанные в настройках стоп лосс и тейк профит. (реверс только на неттинговых счетах) При запуске советника можно посмотреть подсказку как действует советник при нажатии клавиши + клик на графике.
Правее последнего бара, ниже цены Ctrl+ЛКМ - OpenSell Правее последнего бара, выше цены
Channelizer is able to trade all kind of markets (Stocks, Forex, Commodities, Futures, Cryptos). It makes trading decisions by analyzing Price Actions on the Regression Channel Lines. Product Home Page: https://www.mql5.com/en/market/product/49892
ADVANTAGES: Works on any market and any time frame Multiple Trading Strategies in three categories: Reversal, Breakout, Trend Follow Trades simultaneously on any number of markets under the same account Display Regression Channel while trading Can d
The strateggy: This EA has built-in CCI and MA indicators to determine the assets prices trend directions. The Commodity Channel Index (CCI) determines the trend directions by measuring the prices oscilations as the two Moving Averages (MAs) conffirm the trends as they cross each other; The EA has different inputs for long and short positions because tests show it is more efficient; It works with Trailing Stop Loss technique to protect the profiting positions. The Short Positions Inputs: Take p
VR Template Switcher est un utilitaire puissant permettant de gérer les modèles de graphiques dans le terminal MetaTrader. Vous n'aurez plus besoin d'accomplir de nombreuses actions pour télécharger, enregistrer et supprimer des modèles. L'utilitaire VR Template Switcher vous permet d'enregistrer le modèle de graphique actuel avec tous les indicateurs, niveaux et paramètres, puis d'en charger un autre en un seul clic. Vous avez des modèles pour différents instruments financiers ? VR Template Swi

Stochastic Reversal allows you to recognize reversals professionally. Stochastic Indicator: This technical indicator was developed by George Lane more than 50 years ago. The reason why this indicator survived for so many years is because it continues to show consistent signals even in these current times. The Stochastic indicator is a momentum indicator that shows you how strong or weak the current trend is. It helps you identify overbought and oversold market conditions within a trend. Rules
Fx Pulsar for the Meta Trader 5 platform is a professional expert who allows you to earn ≈ 100% profit per year! Great results for a long time!
MAIN CHARACTERISTICS: The Expert Advisor is ideally suited for EUR / USD (other correlated pairs are possible) Expert works fully automatically (we recommend using VPS) The expert has built-in functions for calculating signals by the Stochastic oscillator (no indicators are required) The expert uses Martingale in his work (can be disabled, se

Open time indicator 4 Major sessions. 1. Sydney is open 0h - 9h (GMT + 3) 4h - 13h (VN - GMT + 7) 2. Tokyo is open 3h - 12h (GMT + 3) 7h - 16h (VN - GMT + 7) 3. Lodon is open 10h - 19h (GMT + 3) 14h - 23h (VN - GMT + 7) 4. Newyork is open 15h - 24h (GMT + 3) 19h - 4h (VN - GMT + 7) Link download indicator KIDsEA Session Please come to my youtube for free download, please feel free for like and subscribe for my channel.
Calm grid adviser developed by a professional trader for traders. It works with market orders, the first transaction opens with sharp movements. It has the functions of minimum holding time and minimum interval between opening new orders in seconds. It can work with any brokers, including American brokers, requiring FIFO to close primarily previously opened transactions. Closing orders is a unidirectional basket of orders. To close positions, you can use the functions of stop loss, take profit,

LinLit mq5 EURJPY is fully automated EA. The input parameters are optimized for EURJPY - M15 time frame We use Moving Averages Crossover, Moving Average and Money Flow Index indicators EA NOT use Martingale, GRID, Averaging and other dangerous strategies! Full compliance with the FIFO method! Recommendations EA Settings : Use default settings. Symbol : EURJPY. Time Frame : M15. Brokers : ECN brokers, low spread/commission, 1:400 leverage Minimum Deposit : $200 USD.
Parameters Entry lot si

LinLit mq5 USDJPY is fully automated EA. The input parameters are optimized for USDJPY- M15 time frame We use, Stochastic and Money Flow Index indicators EA NOT use Martingale, GRID, Averaging and other dangerous strategies! Full compliance with the FIFO method! Recommendations EA Settings : Use default settings. Symbol : USDJPY. Time Frame : M15. Brokers : ECN brokers, low spread/commission, 1:400 leverage Minimum Deposit : $200 USD.
Parameters Entry lot size : Initial lot size Stop Loss

MoneyMaker stableATM Lite is an automatic intelligent trading system for foreign exchange! Lite edition just support MetaTrader 5! The purpose of MoneyMaker stableATM Lite is to stabilize profits, not to give you the ability to get rich overnight! MoneyMaker stableATM Lite is only applicable to EUR / USD currency trading, and cannot be used for other currency exchange trading, other CFD product trading, and commodity tradingor futures commodity trading! MoneyMaker stableATM Lite is only suitabl

***** IMPORTANT NOTE: DO NOT FORGET TO DETERMINE THE MAIN TREND DURING THE TEST. FOR AN UPWARD TREND MAKE "TRADE LONG: TRUE" AND "TRADE SHORT: FALSE" FOR A DOWNWARD TREND MAKE "TRADE LONG: FALSE" AND "TRADE SHORT: TRUE" AND FOR A HORIZONTAL BAND MAKE "TRADE LONG: TRUE" AND "TRADE SHORT: TRUE" IN THE SETTINGS. YOU CAN ALSO CHOOSE THE LONG TRADE, SHORT TRADE OR BOTH WAY IN REAL ACCOUNT BY THE HELP OF THE BUTTONS ON YOUR GRAPH IN ANY TIME. ***** "Statistics are like mini-skirts. They give yo

I present to you an indicator for manual trading on DeMark's trend lines. All significant levels, as well as the indicator signals are stored in the buffers of the indicator, which opens the possibility for full automation of the system. Bars for calculate (0 = unlimited) - Number of bars to search for points DeMark range (bars) - Shoulder size to determine point
Get all the moving averages in one indicator. Simple moving average, Exponential moving average, Smoothed moving average, Linear weighted moving average, Double Exponential Moving Average, Triple Exponential Moving Average, T3 Moving Average and MORE. Find in the comments a Free Expert Advisor that uses the XPMA . It will show you how easy to make an EA based on the XPMA (XP MOVING AVERAGE). Settings: Moving Average Type: The Moving Average Type. It can be one of these types: SMA (Simple Moving
Elite SR - Advanced Level Indicator for automatic detection of support and resistance levels with different degree of credibility should become a part of your trading arsenal. This indicator is accessible via iCustom function and provides level values as well as their degree of credibility. Elite SR is fully adjustable and can work on any time-frame with any trading instrument!
Important information For all detailed information about this indicator you can visit 747Developments website.
Feat

Are you accidently making mistakes with your stoplosses, you thought you were risking 5% but you actually risked 15%? Are you causing yourself unncessary drawdowns by moving the sl too many times? Don't worry this ea has your back, it lies in the background and always watches your risk. No matter how many orders you have open in both directions it will make sure you stop out at your set risk percent. It also removes all stoplosses and targets in the case of a full hedge situation.
The same as R
The EA uses 3 strategies: 1 - a strategy for breaking through important levels, 2-a strategy for reversing, and 3 - trading on a trend. To open a position, the expert Advisor evaluates the situation on the charts using 5 custom indicators. The EA also uses averaging elements in the form of several additional orders ( the EA does not increase the lot for averaging orders). The EA uses 8 adaptive functions for modifying and partially closing orders. Hidden Stop loss, Take Profit, Break Even and Tr

Personal Note (How best to use this fishing indicator) This is a highly intuitive indicator. I will express here, how I trade with it personally.
(Trend) 1. One way, you insert the fishing indicator onto your charts, and wait around 10mins at least, you can wait more.
The dot will become a more reliable direction color. Then you could choose to trade it.
Once done. take the indicator off your chart. And then you can repeat and rinse.
(Scalping) 2. This is my personal favourite way t

Trend indicator, draws 2 bars of different colors on the chart. A change of one lane to another signals a market reversal in the opposite direction. The indicator also places on the chart 3 parallel dashed lines High, Middle, Low line which show respectively the top, middle, bottom of the forming reversal.
Parameters
Depth - Depth of indicator calculation, the higher the parameter, the longer-term signals; Deviation - Deviation of the indicator during drawing; Backstep - The intensity of th

With it, you leave pre-configured two expansion settings and one fibo retraction configuration to use via keyboard shortcut and mouse click.
That is, the Fibo_Z utility facilitates the use of MT5's native functions.
The shortcut keys are:
"Z" configuration 1 of the expansion.
"X" expansion setting 2
"Z" retraction configuration.
"V" clears objects from the screen.
It is.
Success and good trades!

The WT Vwap Bands indicator is an indicator that combines price and volume, helping to show whether the price is within the "fair price", overbought or oversold.
The indicator code was designed for performance and has already been tested in a real trading account.
In addition to the visual inputs (color, thickness and line style), the user can define a% value that depends on the price.
The default values work with the most distant band at 1% of the price and then dividing this distan

On Control EA MT5 V2 Game-Changing Software For The Forex Market On Control EA was created to help traders like you maximize their income. How would you like to gain access to a world-class proprietary piece of software designed for one purpose, to improve your Forex strategy? Let’s be honest, it can be hard to understand which technical analysis & trading signals you should follow. With On Control EA, you now have a powerful tool that will enhance your Forex trading strategy & elevate your in

Classic RSL This is the classic indicator "Relative Strength Levy" (RSL), according to Dr. Robert Levy's study, called "The Relative Strength Concept of Common Stock Pricing", which was released as a hardcover book in late 60's of the last century.
Key concept Use this indicator on various instruments to compare their relative strength: The resulting analysis values will fluctuate around 1 The strongest instruments will have the highest RSL values (above 1) and the weakest instruments

The Stepper indicator generates Signals in strong Trend zones. Even when the Trend is set, we must filter when to ENTER or HOLD the trigger. The Trend is represented by two lines: Trend UP and Trend DOWN. W e are in a Bullish trend when the Trend UP (Green line) is above. And in a Bearish trend when the Trend DOWN (Pink line) is above.
When the momentum is aligned with the Trend , this indicator generates: BUY signals (LIME line) SELL signals (RED line) The user is alerted of the scenario, at

Hi Friends! this is countdown candles with 4 functions. 1. Countdown current Candles 2. Countdown H1 timeframe. 3. Countdown H4 timeframe. 4. show the spread index and the lowest spread value within 5 minutes. Instructions for installing and downloading this indicator in the link below. https://www.youtube.com/watch?v=fi8N84epuDw
Wish you have a happy and successful day.

I automated its commercial strategies for use of binary in MT5 and with our Mt5BridgeBinary I sent the orders to its Binary account and I list: begin to operate this way of easy!
The expert advisers are easy to form, to optimize and to realize hardiness tests; also in the test we can project its long-term profitability, that's why we have created Mt5BridgeBinary to connect its best strategies to Binary.
Characteristics: - It can use so many strategies as I wished. (Expert Advisor). - He doe
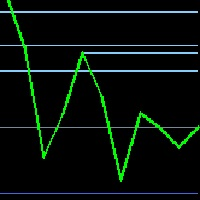
Resistance and Support levels is one of the most important factors when you enter the market This indicator will automatically draw all resistance and support for last x (you can insert the x value as you like) resistances and supports You should trade between those lines and put your stop loss behind this line (if you in sell then your stop line should be above this line, and opposite for buy) Also your take profit should be upon those lines So you should trade between support and resistance
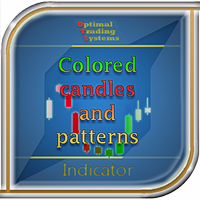
Some candles have a strong tendency to continue the movement, or its turn. Using the Colored candles and patterns indicator, such candles are clearly visible. This indicator calculates the parameters of each candle, as well as its volume, and after that it colors the candles depending on its strength and direction. Bullish candles turn green and bearish candles turn red. The greater the strength of the bulls or bears, the brighter the color. If desired, the colors can be changed. In addition, t

Trend Factor is an indicator based on the calculation of price values to answer questions about what direction the trend is acting on the market at the moment and when this trend will end.
By launching the Trend Factor indicator, the user will see two lines and bars of different colors, which can change color to green during an uptrend, to red during a downtrend or to be yellow during an uncertainty.
The trader uses the Trend Factor indicator to determine the market situation. This is a t
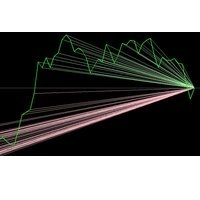
This indicator provide very solid and successful mark for the price direction, it will give you values towards the last price levels which let you be able to predict the next price move How to trade using this indicator: We recommend that you buy or sell when the buy/sell value is more than double the sell/buy value and both sell/buy values is greater than 20 Let's take examples: If the values was Buy: 45, sell: 55, then don't enter the market if the values was Buy: 90, sell: 10, then this is a

Special Channel channel indicator is a classic indicator of a family of channel indicators, the use of which allows the trader to respond in time to the price out of the channel set for it. This corridor is built on the basis of the analysis of several candles, starting from the last, as a result of which the extrema of the studied interval are determined. It is they who create the channel lines.
Trading in the channel is one of the most popular Forex strategies; its simplicity allows even be

JUPITER it is a Secure Automated Software for trade Forex market and indices.
The architecture is a Fully Automatic Autonomous Robot Expert capable of
Independently analyzing the market and making trading decisions
JUPITER It is an advanced trading system. This is a fully automatic Expert Advisor.
JUPITER . It is a 100% automatic system, The system is self-sufficient, performing all the work. Is a revolution in the customization of the trading. You can download t

The Regression indicator shows the direction of the trend. The graph shows up to 3 regression lines with different time periods. The straight line is built as the average inside the wave channel of the price movement (shown on one ScreenShot).
In this case, you can disable any of the lines. Also, the indicator allows you to change the color for each line. It is interesting to calculate the relative angle in degrees. The angle display can also be turned off.
Thanks to this indicator, you can

The indicator draws support and resistance lines on an important part of the chart for making decisions. After the trend line appears, you can trade for a breakout or rebound from it, as well as place orders near it. Outdated trend lines are deleted automatically. Thus, we always deal with the most up-to-date lines. The indicator is not redrawn .
Settings:
Size_History - the size of the calculated history. Num_Candles_extremum - the number of candles on each side of the extremum. Type_Ar

Blue Sky Plus is a tested product over 5 years now which is also available in Metatrader. It uses a combination of indicators and trading strategies to make constant profit. The best thing about this product is that it generates signals at the right time and also gives less signals. Using this Expert Advisor over a period of time will make you profit. We don't recommend random trades instead a systematic way along with the expert advisor.
Segments which works best Works best with Commodities
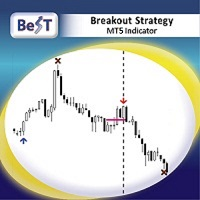
BeST_Breakout Strategy MT5 is an Metatrader Indicator based on a proprietary algorithm implementing a very powerful tool that can exploit every breakout leading to huge market movements.It timely locates the most likely points for Entering the Market as well as the most suitable Exit points and can be used successfully as a standalone Trading System which performance is often accompanied by very impressive statistics of % Success Ratio and Profit Factor . The BeST_Breakout Strategy is a non-rep

Each bar graph is a brick, take buy a bill now as an example, the brick that is in lowest position at the moment, go to the left, when the brick with the 3rd highest is in existence, take the height of this brick as a benchmark, when the price exceeds the height of this brick, can establish buy a bill, when appear opposite circumstance closes a position, establish empty order at the same time. This is a simple rule, need each friend grope by oneself.
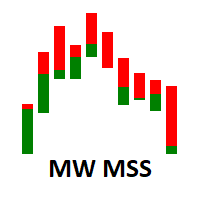
The Martinware Market Sides' Strength indicator shows the candlestick chart in a different manner allowing for a clearer view of which side, bullish or bearish is dominating the asset in the current period. As a bonus, it can also show an internal area that can be used to visualize two levels of Fibonacci retracements inside the bars.
The default configuration shows the MSS bars with 4 main colors, two representing the bullish force, and two representing the bearish one. The primary colors a

Do you use volume in your reading of the market?
Certainly many traders use it, and do not imagine operating without it.
The Color Candle Volume Set indicator allows the user to choose the value that he considers interesting to monitor.
When you pass this you will have visual confirmation on the price chart and if you want you will also have the audible alert that is given by the indicator.
Of course, there are other ways to try to find a high volume, such as assessing whet

Do you use volume in your reading of the market?
Certainly many traders use it, and do not imagine operating without it.
The Color Histogram Volume Set indicator allows the user to choose the value that he considers interesting to monitor.
When you pass this you will have visual confirmation and if you want you will also have the audible alert that is given by the indicator.
Of course, there are other ways to try to find a high volume, such as assessing whether the volume
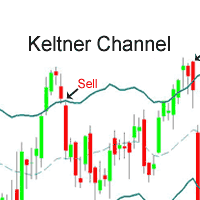
The EA strategy : it is provided wirh built-in Keltner Channel indicator and a Moving Average to ensure the signals. Short and Long positions are treated separetely with different stop levels, lots volume, quantity of simultaneous pending positions and trailing stop loss distances; You should purchase this EA because : it has been tested for a long time; its indicator was deeply improved and optimized; the program is bugs free; it is safe because its efficience is about 94% of assertiveness;

NetWorker сеточный советник подойдет как профессионалам так и новичкам прост в настройке. Работает с любыми валютными парами,товарами, индексами. EURUSD,GOLD,OIL BRENT,OIL WTI,S&P 500,Crypto currency Bitcoin ВНИМАНИЕ ПЕРЕД НАЧАЛОМ ТОРГОВЛИ НА РЕАЛЬНОМ СЧЕТЕ ВОСПОЛЬЗУЙТЕСЬ ТЕСТЕРОМ СТРАТЕГИЙ ДЛЯ ПОИСКА ЛУЧШЕЙ НАСТРОЙКИ ОПТИМИЗИРУЙТЕ НАСТРОЙКИ С ПОМОЩЬЮ ОПТИМИЗАТОРА ПРОВЕРЯЙТЕ ВАШИ НАСТРОЙКИ НА ДЕМО СЧЕТЕ

Currency Strength Meter is the easiest way to identify strong and weak currencies. This indicator shows the relative strength of 8 major currencies + Gold: AUD, CAD, CHF, EUR, GBP, JPY, NZD, USD, XAU. Gold symbol can be changed to other symbols like XAG, XAU etc.
By default the strength value is normalised to the range from 0 to 100 for RSI algorithm: The value above 60 means strong currency; The value below 40 means weak currency;
This indicator needs the history data of all 28 major curren

The indicator detects important peaks and troughs (extremes) on the chart. These points can be used to plot support/resistance levels and trend lines, as well as any other graphical analysis. These points can serve as reference points for setting trading orders. The indicator does not redraw .
Settings:
Size_History - the size of the calculated history. Num_Candles_Right - number of candles to the right of the peak or trough.
Num_Candles_Left - number of candles to the left of the pea

Cet indicateur multi-périodes et multi-symboles identifie le moment où la ligne de signal stochastique croise la ligne principale stochastique. Comme alternative, il peut également alerter lorsque la stochastique quitte (sans ligne de signal traversant la ligne principale) une zone de surachat/survente. En prime, il peut également rechercher les bandes de Bollinger et les croisements de surachat/survente RSI. Combiné avec vos propres règles et techniques, cet indicateur vous permettra de créer (

MACD Master Our MACD Master is the Expert Advisor you were searching for. It is easy to set up and brings Money Management such as automated or fixed Stop loss, risk management with fixed amount or percentage on the Account Balance or Account Equity and the most important for a solid system, the definition of the risk ratio - CRV.
How does the system work? The system is based on the original idea of the MACD. Whenever the fast EMA and the slow EMA of the MACD are crossing a sell or buy signal

The Laguerre VIX Trend Extrema (LVTE) indicator detects market tops and bottoms. As its name suggests, LVTE is a percentage price oscillator that identifies extreme ranges in market price. How to use: Buy when the indicator was in the lower "blue" range for more than 2 candles, and then moves up into grey. Sell when the indicator was in the upper "red" range, and then moves down into orange. Please see screenshots for examples! To make it simple, the indicator can show this by painting "dots
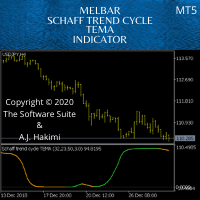
Schaff Trend: A Faster And More Accurate Indicator In Combination With The TEMA MACD - Scalping Systems Advantage
The Schaff Trend Cycle (STC) is a charting indicator that is commonly used to identify market trends and provide buy and sell signals to traders. Developed in 1999 by noted currency trader Doug Schaff, STC is a type of oscillator and is based on the assumption that, regardless of time frame, currency trends accelerate and decelerate in cyclical patterns. https://www.investopedia.
Chart Slice is a very convenient multi-timeframe indicator, with which you can see market information at once on several time slices. This will allow the trader to learn quickly and most importantly understand the vibrant market . The author himself went this way and this indicator helped incredibly. You probably have often wanted to see in detail why at a given point in time the price was rapidly moving away from a certain level or, on the contrary, stopping there. And for this you had to chan

This indicator calculates the Daily VWAP and projects its Bands in 3 upper levels and 3 lower levels (Supports and Resistances), offset by the Standard Deviation selected by the user.
How to configure: Choose the symbol and the desired graphic time; Choose the type of price that is most suitable to calculate the Desired VWAP; Choose whether or not you want the Bands to be plotted; Choose the type of Volume you want to use (Ticks or Real); Choose the type of Calculation of the Bands (Deviation

This indicator allows you to monitor and correlate several assets simultaneously. Using an operational reading technique applied in Multimarkets, the user is able to observe the behavior of other assets visible to the current asset that is operating. With this, the user's ability to make decisions becomes more robust and grounded.
The indicator has the capacity to list up to 4 assets, with the possibility, also, to change the type of quote and be used both for the current price and the past p

PROMOTIONAL PERIOD - ONLY 2 COPIES LEFT OF FIRST 10 BUYERS AT PRICE 300,00$!!!
CHECK SCREENSHOTS AND COMMENTS FOR OUR STRATEGY RULES AND LIVE TRADES SIGNALS PULL IT BACK is a revolutionary trading system and a complete strategy with advanced algorithm developed to detect the trend direction after a PULLBACK , a RETREACEMENT or a KEY LEVEL BOUNCE . The goal of this indicator is to get as many pips as possible from market trend. Following strictly the rules of the strategy, you can become a

Rebate System performs a large number of trades with the minimum profit, which gives the opportunity to earn from receiving rebates (returning part of a spread). It is based on two grids (buy and sell), when one of them is in a drawdown, the other one can enter with an increased lot size, keeping the account away from the drawdown. Differences from the usual EA Rebate System in the mode of closing long-term losing trades in one of the grids due to the previously received profit. Input parameters

The 9-5 Count is designed to track a very powerful cycle that runs through all freely traded markets. This is not a time cycle but a price cycle. The time spent between two points is not as important as the price traveled between them. The 9-5 Count is called that because one complete upward cycle consists of measurement of 9 units plus 5 units of cycle time. This tool takes into account price and pattern together, so it’s more than just a simple cycle. The 9-5 theory classifies market movemen

5 Advantages of Using a Forex Expert Advisor It can trade while you sleep! ... It is not vulnerable to emotions. ... You can run backtests quickly. ... It reacts to quick market movements instantly. ... It isn't prone to human error.
MelBar Take10P AJH Expert Advisor RoboTrade Software MT5 - TEST RESULTS by Independent 3rd. Party
Leverage : 1-500 Initial Deposit US$150-US$300
Timeframe : M30
Period : March 1, 2020 - April 29, 2020
Profit Returns Percentage in 59 DAYS : 50+%-10

The Larry Wiliams' indicator named WillSpread considers the influence of the secondary Asset (Symbol) on the current Asset (trading). Indicator essence is to transform the correlation between assets in accumulated history data, providing an opportunity to detect various peculiarities and patterns in price dynamics which are invisible to the naked eye. Based on this information, traders can assume further price movement and adjust their strategy accordingly. As exposed on his Book, Larry says: "a

through this indicator you can make analysis and also can to distinguish possible weakness or continuous strength on price, it is an indicator initially developed by David Weis. This version is for the meta trader 5 platform. The Weis Waves indicator is based on volume and is aligned with the price, being able to find not only possible strenght and weakness, but also possible divergences between price and volume, bringing an interesting analysis between both.
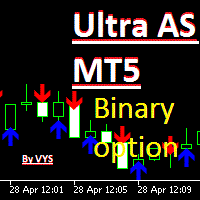
the indicator is intended for trading binary options period parameter, you can adjust the indicator to your strategy and select the required number and quality of signals red arrow down to sell signal blue arrow up to buy signal Recommended time for one candle You can enter the deal when a signal appears or on the next candle ATTENTION on the current candle the signal may sometimes disappear accuracy of about 70%

RSI Scalper Multi Profit Targets is a Fully automated EA. It uses the RSI indicator for the entries. You can do counter trend scalp (for example sell on 72, and buy on 25) - default (trend buy-sell - false) settings or it can do the same direction trade (trend buy-sell - true).
You can find the best profit targets on backtesting and optimization because it works almost on all pairs on some TF (Time Frame). I personally use it on 5 min, EURUSD, GBPUSD, NAS100, SP500. on 15 min I use on USDCAD

The strategy which is applied in finance market all around the world is known as CTA strategy. A successful CTA always includes multi-strategies, multi-instruments and multi-timeframe. The series of Multi Instruments TrendSystem (MITS) provide a profitable strategy which can be used in different instruments with different timeframe. Multi Instruments TrendSystem 6 CP (Central Power ) MT5 is a fully automated multi-instrument Expert Advisor. This EA is one of our trend strategies EA, it can be

The strategy which is applied in finance market all around the world is known as CTA strategy. A successful CTA always includes multi-strategies, multi-instruments and multi-timeframe. The series of Multi Instruments TrendSystem (MITS) provide a profitable strategy which can be used in different instruments with different timeframe.
Multi Instruments TrendSystem 5 RA MT5 (Rapier) is a fully automated multi-instrument Expert Advisor. This EA is one of our trend strategies EA, it can be used
The strategy which is applied in finance market all around the world is known as CTA strategy. A successful CTA always includes multi-strategies, multi-instruments and multi-timeframe. The series of Multi Instruments TrendSystem (MITS) provide a profitable strategy which can be used in different instruments with different timeframe.
Multi Instruments TrendSystem 4 M4A1 MT5 is a fully automated multi-instrument Expert Advisor. This EA is one of our trend strategies EA, it can be used on lots

Gossamer is a moving average ribbon indicator that uses a novel approach to identify breakout trades in trending markets. By applying a progressive period shift to each moving average, levels of consolidation become visible. Enter trades when price breaks out in the direction of the prevailing trend. Stoploss should be located on the other side of the consolidation from the breakout. Profits can be taken at the next consolidation or the stoploss trailed and the position built. Applicable to a

Полностью автоматический советник, на основе индикатора RSI с системой технического анализа на заданную глубину и с учетом текущей ситуации. Особенность данного эксперта в специальном фильтре ложных сигналов, без которого RSI практически бесполезен. Советник не использует методы работы с высоким риском (Мартингейл, сетки ордеров и т. д.). Размер лота автоматически рассчитывается в зависимости от текущего баланса и уставки на каждый минимальный размер лота. Рекомендуется запускать советник с раб

The underlying P.S.-Technical Trading bot is a computer program written in the MQL5 language. The P.S.-Technical Trading bot is a fully automated trading robot based on the two developed technical indicators, ADX and Parabolic SAR, developed by technical analyst Welles Wilder Jr.
If you want to learn more about this, I recommend the book "New Concepts in Technical Trading Systems" which was published in 1978.
In addition, the trading bot eliminates all too understandable emotions during

The strategy which is applied in finance market all around the world is known as CTA strategy. A successful CTA always includes multi-strategies, multi-instruments and multi-timeframe. The series of Multi Instruments TrendSystem (MITS) provide a profitable strategy which can be used in different instruments with different timeframe.
Multi Instruments TrendSystem 3 BS MT5 (Blood Sword) is a fully automated multi-instrument Expert Advisor. This EA is one of our trend strategies EA, it can be u
Découvrez comment acheter un robot de trading sur le MetaTrader Market, le magasin d'applications de la plateforme MetaTrader.
e système de paiement de MQL5.community prend en charge les transactions via PayPal, les cartes bancaires et les systèmes de paiement populaires. Nous vous recommandons vivement de tester le robot de trading avant de l'acheter, pour une meilleure expérience client.
Vous manquez des opportunités de trading :
- Applications de trading gratuites
- Plus de 8 000 signaux à copier
- Actualités économiques pour explorer les marchés financiers
Inscription
Se connecter
Si vous n'avez pas de compte, veuillez vous inscrire
Autorisez l'utilisation de cookies pour vous connecter au site Web MQL5.com.
Veuillez activer les paramètres nécessaires dans votre navigateur, sinon vous ne pourrez pas vous connecter.