Regardez les tutoriels vidéo de Market sur YouTube
Comment acheter un robot de trading ou un indicateur
Exécutez votre EA sur
hébergement virtuel
hébergement virtuel
Test un indicateur/robot de trading avant d'acheter
Vous voulez gagner de l'argent sur Market ?
Comment présenter un produit pour qu'il se vende bien
Indicateurs techniques payants pour MetaTrader 4 - 84

Trade Assistant MetaTrader indicator — a multi-timeframe indicator that is based on three standard indicators: Stochastic oscillator , RSI (Relative Strength Index), and CCI (Commodity Channel Index). It displays current trend directions for M1, M5, M15, M30, H1, H4, D1, W1, and MN1 timeframes. When you follow such an indicator you have a clear picture of the trends across all important timeframes. It doesn't matter which timeframe you attach this indicator to. The indicator can be d
Introducing an indicator that creates signals!
Triple Signal Finder displays signals on the chart according to the readings of indicators : from one to three simultaneously. You can use 3 indicators at once and the signals will be displayed when the signals of your indicators coincide !
You can include 3 indicators , which can be both standard and self-written .
You will see the signals of your strategy on the chart and in the form of statistics . The number of signals and their success

Watch how indicator works here; https://www.youtube.com/watch?v=3rfwzWgU6Rk CURRENTLY 50% OFF !! will only be available for first 10 DROP A COMMENT WHEN YOU PURCHASE THE INDICATOR SO I CAN ADD YOU TO THE TELGRAM GROUP Best Solution for any Newbie or Expert Trader! This indicator have been made affordable and easy to interact with, it is precise and direct to use. IT IS NONE REPAINT INDICATOR THAT CAN SEND NOTIFICATION TO YOUR PHONE
PLEASE IF YOU PURCHASE THIS INDICATOR YOU WILL BE ADDED TO A T
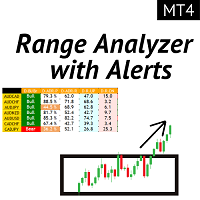
La plage quotidienne moyenne montre la plage de pip moyenne d'une paire Forex mesurée sur un certain nombre de périodes. Les traders peuvent utiliser l'ADR pour visualiser l'action potentielle des prix en dehors du mouvement quotidien moyen. Lorsque l'ADR est supérieur à la moyenne, cela signifie que la volatilité quotidienne est plus élevée que d'habitude, ce qui implique que la paire de devises peut s'étendre au-delà de sa norme.
Notre ADR Analyzer est composé de 5 fonctionnalités principal
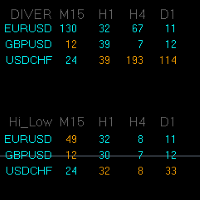
The logical continuation of the divergence indicator is the Divergence HiLo Dashboard indicator - a divergence scanner immediately for three currency pairs. In the indicator menu, select which currency pairs we will analyze. The analysis is carried out on the timeframes M15, H1, H4, D1. In addition to divergences, tops and bottoms are analyzed. All data is entered into tables Alerts are provided in the indicator. According to the logic of the indicator, the signal appears after the end of 3 bars

[ MT5 Version ] Bulls and Bears Power Bulls and Bears Power is an indicator that clearly highlights if bulls or bears are currently in control of the market. A price movement started with high Bulls control in the market can indicate the beginning of a new trend movement. The relative indicator power between price peaks also indicates if the movement is losing strength and might foresee a significant correction or a trend reversal. Bulls and Bears Power indicator offers a clear and simplified vi

Non-repaint indicator to identify trade opportunities in swing action as prices move within an upper and lower band. Inspired by the Keltner Channel, the most popular channel Indicator introduced by Chester Keltner. It is different with a Bollinger Bands. It represents volatility using the high and low prices, while Bollinger's studies rely on the standard deviation. Customized by adding the trends exactly in the middle line, arrows when price cross over the outer lines and Fibonacci Levels L
Would you like to learn a technical system refined by centuries of use, but virtually unknown here? A system so versatile that it can be fused with any other indicator/technical tool? A system as pleasurable to use as it is powerful? If so, this indicator which scans candlestick charting techniques is for you. You should find it valuable no matter what your background in technical analysis. This trading system has been designed after years of hard work and back testing. Indicator will find stro

Trend Divergence Finder – индикатор, позволяющий выявлять дивергенции цены и графика выбранного индикатора. С помощью Trend Divergence Finder вы сможете подобрать тот индикатор, который наиболее эффективен для Вас, и использовать его с наглядным отображением на графике.
В индикатор включены 9 базовых индикаторов : 1. RSI 2. MACD 3. MOMENTUM 4. RVI 5. STOCHASTIC 6. CCI 7. Standard Deviation 8. Derivative 9. William Blau
Присутст
This is an advanced order block indicator with multi timeframe support. It can auto draw the higher highs, lower lows, breakers along with many other features that can be adjusted to the requirement of the trader. The breakers are also added to the indicator buffers with arrows. If you are an order block trader, then this is probably the best indicator you can find to minimize manual efforts. Features: Respected bullish and bearish order blocks Broken order blocks (breakers) Source order bloc
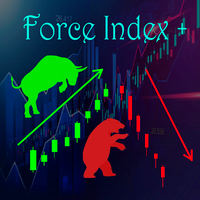
Данный помощник в торговле основан на индикаторе Force Index, хороший осцилятор для скальпинга в периоде H1, входы в сделки указаны стрелками, выходы соответственно можете определять самостоятельно, к примеру можете воспользоваться стандартным индикатором Stochastic. Данный индикатор работает только в периоде H1! В настройках при желании можете изменить цвета и период. На основе этого индикатора пишется робот, желающему пишите в лс.
!! FLASH SALE !! Over 80% off !! For ONE week only. Now only $47 - normally $297! >>> Ends on 30 June 2023 - Don't miss it!
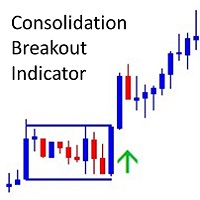
The Consolidation Breakout Alerts Indicator will revolutionize your trading strategy. Our innovative indicator offers unique buy and sell arrows when price breaks out from consolidation, allowing you to get in at the most optimal entry with minimal risk and maximum reward potential. Never again will you miss out on the lucrative trading opportunities available

Cet indicateur est basé sur la transformée de Hartley discrète. L'utilisation de cette transformation vous permet d'appliquer différentes approches lors du traitement des séries chronologiques financières. Une caractéristique distinctive de cet indicateur est que ses lectures ne se réfèrent pas à un point sur le graphique, mais à tous les points de la période de l'indicateur. Lors du traitement d'une série temporelle, l'indicateur permet de sélectionner différents éléments de la série temporell
!! FLASH SALE !! Over 80% off !! For ONE week only. Now only $47 - normally $297!
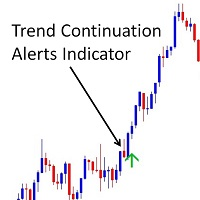
Buy and sell arrows on the chart when the trend is about to continue. Aslo Sends Alerts – On MT4 To Your Phone To Your Email.
Does not repaint.
Works on any pair, any timeframe. (Just ajust the settings for your pair and timeframe.)
10 Activations allowed so you are free from limitations
See an example of alerts from today (23 May 2020) using this and 2 other indicators here . MT5 version h
Ce filtre est basé sur les polynômes de Bessel. Son principal avantage est un petit délai. Une autre caractéristique de ce filtre est sa grande sensibilité aux dernières valeurs de la série chronologique financière. Pour cette raison, l'indicateur met en évidence les mouvements de prix actifs, tout en lissant les écarts de bruit. En plus de la variante classique, les logarithmes des coefficients de Bessel ont été ajoutés à l'indicateur en tant que fonction de pondération. Dans ce cas, l'indicat

Highly accurate supply and Demand indicator that gives you the exact value of where the Demand or supply ends or starts. Has built-in Alerts Has ability to change colors to whatever you want. Has special feature to automatically change when the chart crosses into a new zone or breaks free from a weak zone. Great for any Manual Trader Set your own custom alerts you can have it check the history of the chart to see how other setups of supply and demand where made in the past.
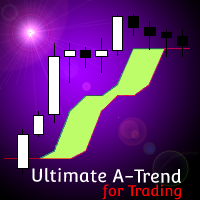
[ MT5 Version ] Ultimate Alpha Trend MT4
Ultimate Alpha Trend is the first trend indicator, which combines volatility, volume, average price and momentum. The results is a highly versatile representation of trendy and sideways market conditions, highlighting, at the same time, significant supply and demand levels. The Ultimate Alpha Trend indicator can be used to find entry oportunities and to set SLs taking into consideration current market volatility, volume and momentum. Besides that, the in
!! FLASH SALE !! Over 80% off !! For ONE week only. Now only $47 - normally $297! >>> Ends on 30 June 2023 - Don't miss it!
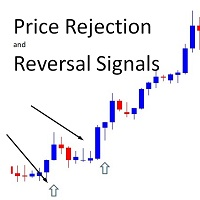
Buy And Sell Signal Arrows On The Chart When The Price Is About To Reverse. Also Sends Alerts – On MT4 To Your Phone To Your Email.
Does not repaint.
Works on any pair, any timeframe. (Just ajust the settings for your pair and timeframe.)
10 Activations allowed so you are free from limitations
MT5 version here . Spreads from 0.1pip RAW/ECN Acco

Trade any Forex combine out there. Many prop firms offer challenge or instant funding combines. The biggest problem is controlling the loss. With this indicator you can get a visual system that can limit loss and teach discipline. This uses the MACD and the strategy is scalping. You can determine the risk and reward. Visually follow small trends for scalps. Trade during active sessions. It's just a simple system to instill discipline while limiting loss and scalping pips with the paramet
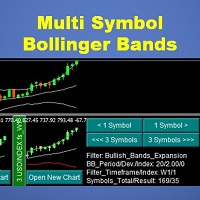
This indicator will display mini candlestick chart with Bollinger Bands indicator of the symbols that pass a filter criteria in the indicator subwindow from 1 to 10 symbols per subwindow. Feature:
Button to scroll 1 symbol, click to scroll the displaying symbols back and forth 1 symbol per click Button to scroll 1 page , click to scroll the displaying symbols back and forth 1 page(number of symbols per subwindow) per click Button to open new chart, click to force mt4 terminal to open a new cha

Holy Grail arrow is for scalping. The period you use will determine the trend. You can try different time frames and periods to see what works best for your strategy. Filters can be applied like a moving average or trendlines. The 1 minute works good for scalps and always trade during active periods and avoid consolidation times. Using other indicators to determine trends is recommended but this can also be a free flowing scalping system alone with tp and sl.
Inputs: Period = trend period

The Colored Volume is a simple, yet useful indicator that paints the color of the volume based on the price direction. If the price has increased, the volume will be shown in green. If the price has decreased, the volume will be shown in red. This indicator will make it super easy for traders to track volume bars based on price movements. (The settings of the volume bars including line width and color can be manually changed by the trader.)
MT4に表示している同一通貨ペアのチャート上で、水平線や垂直線、トレンドラインなどのオブジェクトを同期します。 このインジケーターを使うと、1つの時間足で作成した水平線などのオブジェクトが、同一通貨ペアの他のチャートにも同じオブジェクトが作成されるようになります。また、作成後の移動、プロパティ変更、削除なども同期することができます。
チャートオブジェクトが同期されるケース
・チャートオブジェクトの作成 ・チャートオブジェクトのスタイル変更(色、太さなど) ・チャートオブジェクトの移動 ・チャートオブジェクトの削除
対応しているチャートオブジェクト
以下24のオブジェクトに対応しています。 ・水平線
・垂直線
・トレンドライン
・平行チャネル
・フィボナッチリトレースメント
・フィボナッチ・エクスパンション
・フィボナッチ・チャネル
・フィボナッチ・タイムゾーン
・フィボナッチ・ファン
・フィボナッチ・アーク
・角度によるトレンドライン
・アンドリューズ・ピットフォーク
・標準偏差チャネル
・線形回帰チャネル
・サイクルライン
・三角

Oscillateur MACD avec filtrage de tendance avancé et indication d'alerte. Il détermine la tendance, les tendances faibles sont filtrées et la nouvelle force de la tendance est indiquée. L'oscillateur MACD fonctionne sur toutes les périodes et sur tous les symboles (devises, indices, pétrole, métaux, actions, options, graphiques renko hors ligne) 1. L'utilisateur peut modifier la valeur MACD, 2. Filtre de niveau MACD minimum, 3. Diviser la valeur filtrera le rapport de puissance avec lequel l'in
!! FLASH SALE !! Over 80% off !! For ONE week only. Now only $47 - normally $297! >>> Ends on 30 June 2023 - Don't miss it!
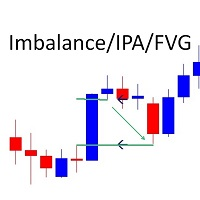
Marks Market Imbalance / Fair Value Gaps / Improper Price Action On The Chart. As traders continue to search for the best trading indicators to guide their investments, the I mbalance / I mproper P rice A ction / F air V alue G ap I ndicator has become increasingly popular. This indicator helps to identify opportunities for taking profit . Th
Speed Trade - Un excellent outil entre de bonnes mains!
Ce qui vous permettra de regarder le marché de l'autre côté !
Tous les signaux et impulsions cachés que vous n'avez pas vus seront affichés par ce produit !
Indicateur multidevise qui vous permet de négocier sur toutes les paires de devises.
Le produit est également testé sur les matières premières et la crypto-monnaie.
Il est conseillé d'utiliser des délais ne dépassant pas 1 à 5 mois, c'est un trading rapide et intelligent.

This indicator is excellent for scalping on the M1 or M5 chart. Uses a special algorithm for the lines. No need to set up the indicator. Does not feature any alerts and is best used manually after visually confirming the line displays. NB: Make sure to download M1 history before testing and use.
How to use: Simply attach to M1 or M5 chart. Zoom chart out completely. Sell when all lines above the white line (PriceLine). Sniper line crosses above white line. Buy when all lines below the white li
!! FLASH SALE !! Over 80% off !! For ONE week only. Now only $47 - normally $297! >>> Ends on 30 June 2023 - Don't miss it!
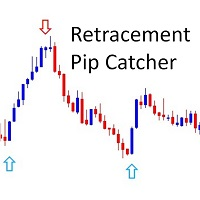
Buy and Sell Arrows when price is about to retrace. It Also Sends Alerts – On MT4 To Your Phone To Your Email
Does not repaint.
Works ony any pair, any timeframe.
10 Activations allowed so you are free from limitations
See an example of alerts from today (23 May 2020) using this and 2 more of my indicators here . MT5 Version here . Spreads from 0
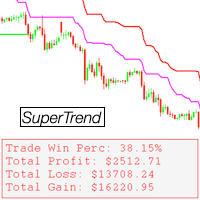
Super Trend Double Pro
- Includes the classic SuperTrend indicator x2 - Includes two indicators for much better market analysis - Comes with various settings - Comes with a display - Displays statistical win/loss information
The "Super Trend Double Pro" indicator provides the ability to combine two of the classic SuperTrend indicators into one, displaying two indicators with different settings on the same chart. The indicator comes with many customizable settings as well as a display which

This is a Manual Indicator to help Manual traders see the Trend Visually it allows you to fully control how the candle closes with many different options, and you can plot the path with many different options. This Indicator is best used in Timeframe: H1 or higher
Close Candle Methods
Close Open High Low Median Typical Weighted Close Median Body (Open+Close)/2 Average (High+Low+Open+Close)/4 Trend Biased Heiken Ashi Close Heiken Ashi Open Heiken Ashi High Heiken Ashi Low Heiken Ashi Media
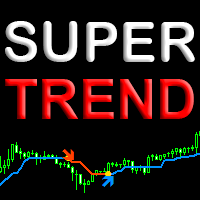
В Super Trend Line реализован один из лучших "price action" алгоритмов трендового индикатора. В связке с авторской фильтрацией это дает максимально точное определения тренда на любых трендовых валютных парах, акциях, криптовалюте без перерисовки результата. Индикатор легко настраивается и станет дополнительным помошником в вашей торговой системе. Подходит как новичкам так и профессионалам для всех видов трендовой торговли.
Как выбрать прибыльный таймфрейм и оптимизировать индикатор под валютну

Ready trading system. The indicator arrow shows when and in what direction you need to open an order. At the end of the blue rectangle we put TakeProfit, and at the end of the red rectangle we put StopLoss. The indicator calculates the size of TakeProfit and StopLoss automatically, depending on the market volatility and the probability of price direction. Therefore, the indicator does all the work instead of the trader. He analyzes the market himself, determines the distance for TakeProfit and

This indicator XRX Master indicator.Indicator displays trend movement. Indicator helps to buy and sell. Features FiltPer- displays indicator period.
deviation - displaus indicator deviation.
deviation2 - displaus indicator deviation 2.
HL_period - displaus indicator Highest and Lowest period. HL_period2 - displaus indicator Highest 2 and Lowest 2 period.
How to understand the status: If the trend color arrow is green, trend is up. I f the trend color arrow is red, trend is down.
//////
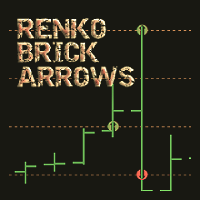
The ' Renko Brick Arrows ' indicator was developed to showcase the traditional renko brick grid pricing on chart. An alternative to using an offline chart generator for renko grid prices, and a unique charting style to strategize.
Key Features Renko bricks are drawn over the chart without having to generate a new chart. Optional horizontal lines shows where the next arrows are supposed to appear. Both one and two step reversals are available to draw arrows for buy and sell.
Input Parameters

IMPORTANT; Price is subject to rise at any time from now! Do not miss this offer! Dear trader I am glad to introduce my new tool called Trend Analyser Dashboard to you. The design, style, and settings of this indicator have been made simple to make its users not take too much time in understanding the indicator itself. The purpose is to help traders in analysing the direction of the major trend and the status of the trend whether in weak trend or its strong trend. The indicator will also prov
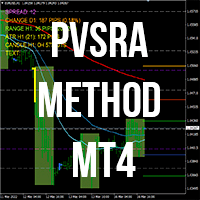
Méthode de négociation PVSRA. Le système est basé sur le calcul de la direction des positions des grands joueurs, dans laquelle ils gagnent des positions.
PVSRA est une abréviation : P - Prix (Prix), V - Volume (Volume), S - Support (Support), R - Résistance (Résistance), A - Analyse (Analyse).
La méthode PVSRA utilise des niveaux de prix ronds (par exemple 1,2000) et des niveaux intermédiaires (par exemple 1,2250, 1,2750). La consolidation en dessous du niveau rond est la préparation des p

Scalping indicator. Points show the price reversal places on the chart. Not redrawn. Minimum delay. Works on M1, M5, M30, H1, H4 timeframes. You can work on all currency pairs. The indicator can also work on gold, silver and cryptocurrencies. This indicator can also be used for binary options.
How to trade (an example of a strategy for GBPUSD)? When a blue dot appears, buy. When a red dot appears, sell. TakeProfit set to 25 points. StopLoss set 35 points. TrelingStop is set at 15 pips. Benefi

Target Striking - One of the best binary options trading tools!
It is set up so powerfully that you can trade not only on currency pairs, but also on raw gold oil!
You can also try on cryptocurrency!
Ideal for trading on currency pairs, the percentage of reliable transactions is more than + 75%
The trading tool is already set for the best profit!
Only Target Striking can unlock the potential of the trading market for you!
With it, the signals are even and accurate without redrawing,

''SKPredict'' Show you next prediction of Close/High/Low/ Open Level. This indicator Used mathematical calculations . It means, that based on the previous movement of the market, the price movement is expected to be in predicted Level. Also you can See, what Happened in previous Data and Predictions and use Buffers to write your EA. Also In ' Tendency indicator '' , as full package of Predictions that every Trader need, there is the Predict line to show you the future of Price.

Improve trading with this indicator. Find areas of buys or sells in Fibonacci retracement areas. Fulltrend is for scalping and making swing trades. Fib levels are added for take profits and stop losses. This works on any time frame and can be used by itself or together with other systems and indicators for filters. The indicator doesn't repaint. Alerts are added and can be true or false. No need to sit glued to the computer, just set on charts and listen or the alerts to come. Take a pos
The Breakeven levels indicator is an indicator that, according to its algorithm of work, determines the number of open orders on a certain instrument finds the level at which all orders go from loss to profit. Separately, for sell and buy orders, the general level of the beginning of profit is found. In the lower left or right corner, information is displayed on three buttons to choose from. When you press the button, a horizontal line of a certain level is displayed on the screen. On the right
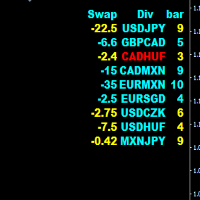
Divergence HiLo scaner is a good tool for market analysis. The indicator looks through all currency pairs and finds those that meet the selection conditions, where corrections or reversals to the main movements are supposed to begin. The indicator values are entered in the final table. 1 value is swap 2 Currency pair. 3 The number of bars after finding the selection conditions. The bar color blue is used for the buy signal. The bar color yellow is used for the sell signal. The color of the

Developed methods for trading collected in one indicator. In the form of arrows, it defines entries in the direction of the trend.
It has 2 types of arrows - trend and signal guides, informing about the potential movement in the direction of the trend.
Works without redrawing, ready for use on all symbols/tools.
The most suitable time frames to use are M15, M30, H1, H4.
How to use
The indicator finds the direction of the trend in the form of a signal arrow, a graphic rectangle stretches
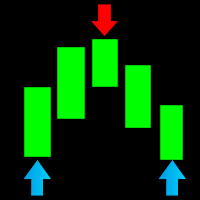
An indicator that shows price reversal points on the chart. Using RSI and other standard indicators, the indicator determines the price reversal points and shows them on the chart with arrows. The indicator does not redraw its values and in 95% of cases it shows accurate signals. This indicator works on all currency pairs and all timeframes.
How to trade with this indicator (recommendations): We recommend opening trades in the direction of the arrow that appears. If a blue arrow appears, op

Fibonacci retracements are trend lines drawn between two significant points, usually between absolute lows and absolute highs, plotted on a chart. Intersecting horizontal lines are placed at the Fibonacci levels. Fibonacci retracements are useful tools that help traders identify support and resistance levels. With the information gathered, they can place orders, identify stop-loss levels, and set price targets. Although useful, traders often use other indicators to make more accurate assessments
Multi-timeframe signal trend indicator.
Detects the trend direction and is colored in the corresponding color.
It has three different sensitivity options
Can show trend direction on other timeframes
Has embedded audible and visual alerts on trend reversals.
Can send notifications to your phone or email.
Allows trend and counter-trend trading.
Works on all timeframes, all currency pairs, metals, indices and cryptocurrency.
It can be used for binary options.
Distinctive feature
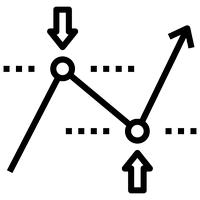
Cet indicateur affiche les niveaux optimaux de take profit et de stop loss. Ces niveaux sont calculés sur la base de données historiques. Au premier démarrage, l'indicateur est entraîné sur l'historique. Après cela, il évalue la probabilité que le prix dépasse tel ou tel niveau à l'avenir et sélectionne les options les plus optimales pour passer des ordres stop. Par exemple, les valeurs de take profit sont sélectionnées pour que le profit soit maximum et que la probabilité que le prix atteigne

RSI Signals is a simple dashboard type indicator that displays the values of the RSI (Relative Strength Index) oscillator on various instruments and time frames chosen by the user. In addition, it can be configured by the trader to show signals when the RSI is in an overbought/oversold condition, when it crosses these levels or when it crosses the 50 level, which is important in some strategies. It is simple and easy to set up. By itself, it should not be used as a trading system since RSI signa
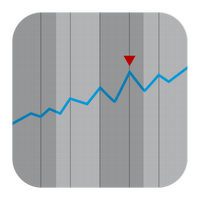
La série hypergéométrique est utilisée pour calculer les coefficients de poids de ce filtre. Cette approche permet d'obtenir un lissage assez intéressant de la série temporelle. Les poids de filtre hypergéométriques ne décroissent pas aussi vite que les moyennes mobiles pondérées exponentielles et linéaires, mais plus rapidement que les moyennes mobiles lissées. Pour cette raison, le comportement de ce filtre est à bien des égards similaire au comportement des moyennes mobiles. Cependant, il pr

Scalping Code is for trend scalping. It is simple to use and is profitable. It can work on any time frame and any asset. This indicator can be used on it's own or together with another system. The arrow does not repaint or recalculate.
The rules are as follows: A blue arrow above the moving average is a buy. An exit for the buy above the moving average is a red arrow or target. A red arrow below the moving average is a sell. An exit for the red below the moving average is a blue arro

50% off. Original price: $60 Support and Resistance zones indicator for MT4 is a multi-timeframe panel and alert that finds support and resistance zones and pivot points for all timeframes of MetaTrader 4 and gives alert when price has interaction with them. Download demo version (works on GBPUSD, EURJPY and NZDUSD symbols) Read the full description of scanner parameters in the blog page . Many unique features in one indicator:
Integrating support and resistance zones and pivot points in one

Indicator MT4 : DXMA(Direction index moving average)
Objective: To track price trends and price reversals.
How to set up Indicator DXMA : 1. The standard value is EMA 12 and EMA 26, you can set it as you like. 2. UTBx 14 is Universal Trend Boundary Index, standard value 14. 3. UTBx Method is a method for calculating the standard value is Exponential.
Meaning of symbols in indicators : 1. The line of the green group means the trend is up. 2. The line of the red group represents a down trend
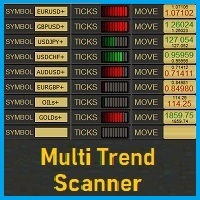
MultiTrend_Scanner is an indicator for the MT4 platform that is used to review trends on multiple symbols. We turn it on on any symbol, on any TF and we have a preview of the entire market. The current symbol is permanently assigned in the first segment of scanner. When adding another segment, you can manually enter any symbol. The quantity of added segments is unlimited. In each segment of a given symbol displayed are trends on different TFs. To calculate the strength of these trends are used
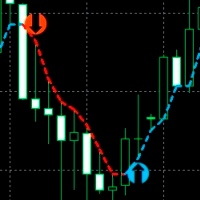
An indicator for accurately determining price reversal points on all timeframes and all currency pairs. With the help of technical analysis of the market and mathematical diagnostic models, this indicator determines the price reversal points and the current trend direction with great efficiency. The indicator displays this information on the chart in the form of arrows and lines. The arrows show the trend reversal points and the lines show the current trend direction. INDICATOR trades in real ti
This indicator is based on the same famous fractal indicator with a slight difference:
MetaTrader version 5 click here
Advantages:
Works on all instruments and time series,
Does not redraw its results,
Comparison depth is adjustable,
Works well with any popular strategy,
Adjust the power of fractals
Input settings:
Number of comparisons - The number of candles that each side selects for comparison.
Marker distance from the candlestick
This indicator is based on ParabolicSAR. This indicator does not change the trend easily and does not change the trend until it receives a clause and approval. This indicator can be used for trail stop or trend detection.
MT5 Version
benefits:
Works on all instruments and time series,
Does not redraw its results,
Comparison depth is adjustable,
Works well with any popular strategy,
The power of the areas is adjustable,
We assure you that we we
The Market Sessions Indicator for MT5 helps you predict market turnarounds by detecting major supply and demand areas. These pivot points tend to occur after a new session has started and the previous one is still open. It is also used to gauge how many points or pips the market moves on average during a session. This helps us to place better our take profits and stop losses. The indicator works on all forex pairs, gold, silver, commodities, stocks, indices and any other instrument that yo

The Stochastic Dashboard is multi currencies and multi timeframes dashboards. It shows the Stochastic direction for the chosen pairs/timeframes. For the Stochastic lovers and manual trader this indicator is a most indicator which can be used to determine the market direction for the pair(s) you are trading. Set it to one chart only and monitor from one place all the charts you want.
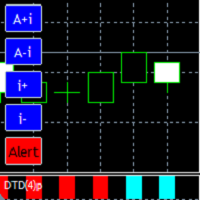
It is a very comfortable and easy to use indicator, as well as very powerful and precise. It is a digitalization of the Oscillometer indicator. Detects and visually shows us the beginning of a new trend . The way to present it, is by means of a two-color bar graph , one for the start of the uptrend, and one for the start of the downtrend . The parameter with which the indicator is built, is the maximum allowed amplitude of price oscillation. The indicator will follow the price checking its

Price pivot point indicator. The indicator shows with points on the chart the places where the price can turn in the opposite direction. When the indicator draws a red dot, it means that the price can turn its movement down. When the indicator draws a blue dot, then the price can turn its move up. This indicator can be used for both manual trading and automated trading by integrating it into your robot. To do this, the indicator has data exchange buffers.
Recommended currency pairs: XAUUSD EU
PAX Simple Trend Signals for MT4
Самый простой и лёгкий в работе индикатор для торговли по сигналам разворота тренда. Зелёными и красными линиями на ценовом графике отображаются направления тренда — растущий и падающий соответственно. Стрелка вначале линии тренда сигнализирует о развороте тренда.
Если на трендовой линии появилась стрелка такого же цвета — это сигнал на открытие нового ордера. Если на трендовой линии появилась стрелка противоположного цвета — это сигнал на закрытия всех орде

Un indicateur de trading professionnel avec des options en partie double. De précieuses lignes de canal lisses sur la fenêtre séparée, des lignes de tendance sur la fenêtre principale et des flèches de fenêtre et d'entrée séparées. Bon pour le trading de scalping dans les délais les plus courts. Même cela peut également fonctionner et fournir des signaux dans des délais plus longs pour des périodes de négociation à plus long terme.
RÉGLAGES DES INDICATEURS :
1. Mode signal. Il existe 2 opti
Advanced Trend System est un indicateur innovant utilisant un algorithme propriétaire qui vous permet de trouver des points d'inversion de tendance potentiels avec une forte probabilité et de recevoir des signaux pour entrer sur le marché au début d'une formation de tendance. L'indicateur suivra les conditions actuelles du marché, et seulement lorsque toutes les stratégies internes sont convenues et confluent à 100% les unes avec les autres, l'indicateur donnera un signal d'achat ou de vente. L
MT5 Version A versatile tool
You do not need any other tools with this tool.
You can enable or disable all indicators.
Their values are adjustable.
In the first line you will see a summary of your account status.
p: The amount of your profit or loss
BP: The amount of your daily profit based on the balance
EP: Equity daily earnings
WP: Your weekly profit
MP: Your monthly profit
The next line shows each of the time frames you selected.
Chikou: The Chikou process
KT: The trend of t

This indicator has as many dots as a Rollex watch..
Also in the kit we have 3 built-in indicators that are combined and configured in such a way that would give you a profit of 75% and that's not all
for your convenience, you can reconfigure it! Initially, it is configured for currency pairs, but if necessary, we can reconfigure it for cryptocurrency and also raw gold, whatever you want!
Not just an arrow indicator, but an Alligator in the world of the Market, then you will like how it sh

L'indicateur d'alarme d'inversion de la structure du marché détecte lorsqu'une tendance ou un mouvement de prix atteint la fin de son cycle de vie et est sur le point de s'inverser. Il vous avertit lorsque la structure du marché change, ce qui se produit généralement lorsqu'un renversement ou un ralentissement important est susceptible de se produire. Lorsqu'un nouveau haut ou bas est atteint autour d'un point d'épuisement possible, l'indicateur détecte les cassures et la dynamique des prix. L'i

Overview: With so much noise and distraction in the markets I wanted to create clarity for traders to have a simple, efficient, and fun trading experience. This is why I created Pipsurfer. Pipsurfer is an trend following indicator that visually shows you important Institutional Smart Money levels in the market and helps you to trace Market Structure in the markets. Most traders find it difficult to visually see trading elements such as trend, structure and momentum which are key for understandin

Cyclical indicator for trading and predicting the direction of the market. Shows the cyclical behavior of the price in the form of an oscillator.
Gives signals for opening deals when rebounding from the upper and lower boundaries of the oscillator. In the form of a histogram, it shows the smoothed strength of the trend.
Will complement any trading strategy, from scalping to intraday. The indicator does not redraw. Suitable for use on all symbols/instruments. Suitable time frames for short-term

Master Point is an indicator set that includes the most powerful and necessary tools for a trader, giving that very edge in the markets to be successful. An indicator that has an elegant and complete system that works very well in all markets (Forex, Crypto, Stocks, Indices) helps to find the best reversal points. It has tools such as trend reversal detection, pivot points, divergences, currency strength and 'candle strength'. All this makes the indicator a complete tool that does not require a
Apollo Binary Options Indicator est un indicateur de signal pour le trading d'options binaires. Le signal arrive à l'ouverture de la bougie actuelle et est valable jusqu'à sa fermeture. Le signal est accompagné d'une flèche ainsi que d'un message de signal directement sur votre carte. Le délai d'expiration de l'option recommandé est d'une bougie. Autrement dit, si le graphique est H1, le délai d'expiration sera de 1 heure. Si le graphique est M5, le délai d'expiration de l'option sera de 5 minut
Le MetaTrader Market est le meilleur endroit pour vendre des robots de trading et des indicateurs techniques.
Il vous suffit de développer une application pour la plateforme MetaTrader avec un design attrayant et une bonne description. Nous vous expliquerons comment publier votre produit sur Market pour le proposer à des millions d'utilisateurs de MetaTrader.
Vous manquez des opportunités de trading :
- Applications de trading gratuites
- Plus de 8 000 signaux à copier
- Actualités économiques pour explorer les marchés financiers
Inscription
Se connecter
Si vous n'avez pas de compte, veuillez vous inscrire
Autorisez l'utilisation de cookies pour vous connecter au site Web MQL5.com.
Veuillez activer les paramètres nécessaires dans votre navigateur, sinon vous ne pourrez pas vous connecter.