Regardez les tutoriels vidéo de Market sur YouTube
Comment acheter un robot de trading ou un indicateur
Exécutez votre EA sur
hébergement virtuel
hébergement virtuel
Test un indicateur/robot de trading avant d'acheter
Vous voulez gagner de l'argent sur Market ?
Comment présenter un produit pour qu'il se vende bien
Indicateurs techniques gratuits pour MetaTrader 4 - 24

Pip Show - MultiStrategy Trading The indicator is for free and you have to install it before you can use the Pip Show - MultiStrategy Trading EA. The use of the indicator is very simple, on green open buy positions and on red open sell positions. Its based on a MA calculation. Check out my fully automatic trading robot multistrategy-trading.com It has four parameters: Period, Divisor ("speed"), Price and TimeFrame Period - how many candles , backwards, are calculating Divisor - how "quick" is
FREE

This indicator works on this way: Trader should provided the n period "Number of Candle" ( the default period is 6) Then the indicator will calculate the number of pips in the last n period (not the current candle) And that is display on the chart With that the should confirmed his up trend or down trend analyse according to the number of pips in the last n candles( bullish or bearish) he has provided
FREE

This expert is designed to work in pairs with the same indicator. https://www.mql5.com/ru/market/product/34834
The expert does not display anything on the screen and does not trade.
It only performs calculations for the indicator, this is done to save your computer resources.
Since the expert works with symbols from Market Watch, there is no way to test it in the tester.
Instructions for use:
0) Select the required symbols in the Market Watch, which will be displayed in the indicator. (Not
FREE

Introduction This Indicator Is Based On Average Price/Maximum Price Moves, And Using Moving Bollinger Bands And Moving Averages.
The Advantage Of Using It With YOUR own Analysis Will Confirm Potential Supports And Resistances While it Compliments With Your Analysis
The Indicator Is Non-Repainting
AND Along With Our Special Trend METRE that Changes With The Conditions OF A Bullish Or Bearish Trend....
Recommend Time-Frames: H1 H4 M15
Usage: The Indicator Is Very Profitable I
FREE
RSI Currency Strength Meter uses RSI (Relative Strength Index) to monitor how strong a currency is, or in other words, if it's being bought or sold by the majority compared to the other currencies. It displays the strength-lines of the currencies of the pair (base and counter currency of the chart) with changeable solid lines. Also, you can add up to ONE additional currency (only 1 in the DEMO version, in REAL up to 5) to the "comparison pool" that already has the base and the profit (counter) c
FREE
It is the simplest indicator in existence. It has only one function: report the seconds elapsed since the last minute end in a very convenient way, with a label that can be moved in the chart, so that the trader does not have to take his eye off the forming candle. It is used on M1, but also on larger intervals, for those interested in opening/closing positions at the best time. Sometimes an intense movement in the last 10" of the minute gives indications of future trend, and can be used for sc
FREE

O Afastamento da Média Móvel, é uma poderosa ferramenta de análise técnica projetada para fornecer uma representação visual do afastamento entre o preço atual e uma média móvel específica. Este indicador, desenvolvido para o MetaTrader, oferece aos traders uma perspectiva clara das mudanças na dinâmica de preço em relação à tendência de médio prazo. Versão MT5: https://www.mql5.com/pt/market/product/111704
FREE
The indicator is a complex of MACD and OsMA, built according to the complex of several popular oscillators. This combination allows you to get the best out of both types of indicators. On the one hand, a quick response to changes in the market environment, on the other hand, effective market following and noise filtering. The indicator values on a fully formed candle are not redrawn.
FREE

The purpose of this new version of the MT4 standard indicator provided in your platform is to display in a sub-window multiple timeframes of the same indicator. See the example shown in the picture below. But the display isn’t like a simple MTF indicator. This is the real display of the indicator on its timeframe. Here's the options available in the FFx indicator: Select the timeframes to be displayed (M1 to Monthly) Define the width (number of bars) for each timeframe box Alert pop up/sound/ema
FREE
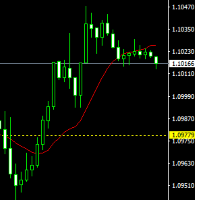
The indicator draws lines (with line objects) to the close prices of the previous day close, on selected timeframes. The indicator uses the closing price of the past day to draw a horizontal line, it can help you determine the direction of the market at the moment, which is necessary for making trades.. Parameters
Line Color Line style Line width Set on the top
FREE

MP Gradient Adaptive RSI oscillator uses AMA with the basic RSI to cover the retracements with minimum lag. Trigger line crossing the oscillator will provide an entry point for trader.
Settings: RSI period: period of the oscillator Sensitivity of the oscillator: controls the sensitivity of the oscillator to retracements, with higher values minimizing the sensitivity to retracements. RSI applied price: source input of the indicator Number of bars to draw: is used when the Fill Type option is n
FREE
The indicator analyzes the divergence of the current price with the Laguerre filter data. Indicator signals: Blue dot - short-term transactions to buy an asset are allowed. Red dot - short-term transactions to sell the asset are allowed. A big blue signal - if the price breaks the high of the bar on which the signal was given - a medium-term buy trade is opened. A big red signal - if the price breaks the low of the bar on which the signal was given - a medium-term sell trade is opened. The indic
FREE
(Google Traduction) Cet indicateur a été inspiré par l'intervalle réel moyen (ATR) de John Welles Wilder , mais avec quelques informations supplémentaires. De même, il calcule la moyenne mobile exponentielle de la vraie plage, mais en utilisant le poids alpha standard au lieu de Wilder . Il calcule également l'écart moyen de la moyenne de la plage et l'affiche sous forme de décalage. Cela permet non seulement d'identifier plus rapidement un changement, mais aussi son impact. (Original text) This
FREE

Currency Explorer is the absolute tool for traders that want to know with quantified certainty the currency strength & weakness of each currency and to trade these by using applicable strategies. Our machine learning models run and provide the strength/weakness of each currency based on multiple factors besides price action. It provides the trader with a QUANTIFIED result for the strength of the 8 most popular and major currencies (EUR, USD, JPY, GBP, AUD, NZD, CAD and CHF) with a scale from 0-1
FREE

A classic indicator with advanced features for more accurate display of the market situation. All settings of all moving averages are available, such as the moving average type and the priced used in its calculation. It is also possible to change the appearance of the indicator - line or histogram. Additional parameters provide the ability of fine tuning.
Distinctive features Does not redraw. Additional parameters for fine tuning. Displayed as a line or as a histogram. Works on all timeframes
FREE

This indicator is a histogram showing the trend based on 3 different moving averages. When all averages are set in ascending order, the indicator is green, and when in descending order, it is red. If the averages do not show a trend, the color is yellow. Additionally, each average can have different settings, such as Mode MA and Price MA. You can also set an alert and receive notifications on your phone.
To enable the alert and push notification, you need to activate them first in the MT4 setti
FREE
One of the standard ways to determine the direction of price movement at a particular moment is to calculate a linear regression for the values of such a price over a certain period of time. This indicator displays a line on the price chart based on the values of the linear regression of the selected price for the selected period of time. The indicator is as simple as possible and can be used within any trading strategy. The indicator is not redrawn on fully formed bars. Settings: Ind_Period - T
FREE
The indicator identifies the strength of the trend based on the points where the DeMarker indicator exceeds the overbought and oversold levels. The indicator does not redraw. This indicator:
Suitable for all markets; Not redrawn; Intuitive and simple; It can be useful for both beginners and experienced traders; Allows you to identify market entry points where there is a high probability of a significant price movement sufficient for a successful transaction; Settings: Ind_Period (>1) - peri
FREE
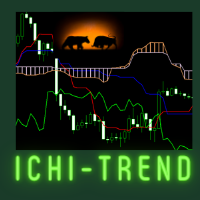
Welcome to our page This indicator is suitable for any time frame but our recommended time frames are 30M and above. Perfectly working with all pairs. Buy Call: When the candle has been crossed above the ichi cloud. (See the Screenshot Attachment) Sell Call: When the candle has been crossed below the ichi cloud. (See the Screenshot Attachment) Happy and profitable trade !!!
FREE

CCFp (Complex_Common_Frames percent) is a measure of currency strength.
Shows the total rate of change of “short-term moving average” and “long-term moving average” for each currency.
Supports eight major currencies: USD, EUR, JPY, CHF, GBP, AUD, CAD and NZD.
1). Displays the currency name at the right end of the graph.
2). You can change the display color of each currency.
3). Moving average smoothing type (ENUM_MA_METHOD) can be selected.
4). Price constant (ENUM_APPLIED_PRICE
FREE

O Chart Control é um indicador que permite de forma rapida e pratica alterar o timeframe e ativo do grafico, possibilitando que voce possa fazer todas as suas analises em apenas um grafico sem precisar abrir vários, além disso voce pode escolher o entre os temas claro e escuro para o qual melhor se adapta a sua preferencia.
MT5: https://www.mql5.com/pt/market/product/109444
FREE

The indicator detects the current trend using the following definition: A trend is a market situation when each subsequent peak is higher/lower than the previous one, as well as each subsequent bottom is higher/lower than the previous one. Exceeding all previous peaks/bottoms on the specified amount of bars by the current peak/bottom is considered to be a beginning of a new trend. The indicator paints bars according to an identified trend. The indicator does not repaint.
Settings:
Lines_Bre
FREE
This indicator displays on the price chart (coloring candles graphics) signals about the standard MACD crossing the zero value, as well as about crossing the signal line. The indicator does not redraw.
Custom Parameters: Fast_EMA_Period - fast moving average period; Slow_EMA_Period - slow moving average period; Signal_Period - signal line period; MACD_Price - the price at which the indicator is built;
FREE
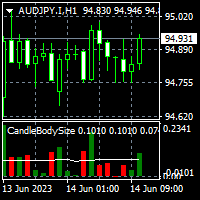
To get access to MT5 version please click here . This is the exact conversion from TradingView: "Candle body size" by "Syamay". This is a light-load processing indicator. This is a non-repaint indicator. Buffers are available for processing in EAs. All input fields are available. You can message in private chat for further changes you need. Thanks for downloading
FREE
Digital filters are (simplified) a way to smooth data. Unlike traditional moving averages, a digital filter will be more effective in most cases. This indicator allows you to identify the difference between the current price and its expected value calculated by the adaptive digital filter. Divergence moments are moments of price movement that can be used to open a trade. The indicator not only visually displays such moments in a separate window, but also allows you to send notifications to the u
FREE
This indicator displays DeMarker oscillator data for two different periods. The position of the histogram above zero indicates an increase in prices. The location of the histogram below zero indicates a fall in prices. On fully formed chart bars, the indicator is not redrawn. At the same time, the indicator values at 0 bar (the current bar, the bar that has not finished forming yet) may change. Thus, the indicator values at 0 bar should be ignored.
- Sale subject to all conditions:
Indica
FREE

The Retracement indicator shows the current and historical high, low and mid values. Optionally, it can also display major retracement levels. All these levels together form the significant levels of support and resistance. Therefore, it is essential to know them for every kind of trader.
Levels High Low Midpoint 76,4 % 61,8 % 38,2 % 23,6 %
Main features The indicator shows the actual levels of High, Low, Mid and selected retracements. Four optional retracement levels. Alert notificatio
FREE
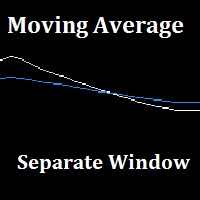
"Separate Moving Average" is a custom indicator made from the combination of 2 moving averages in a different window (the indicator window) for the goal of removing the clutter from the price chart, the indicator also has arrows to show the moving average cross either long or short. All the moving average parameters are customizable from the indicator input window.
FREE

The parabolic stop and reverse (PSAR) indicator was developed by J. Welles Wilder, Jr. as a tool to find price reversals which can be utilized as stop-loss levels as well as trade triggers. The notable difference about the PSAR indicator is the utilization of time decay. The PSAR indicator forms a parabola composed of small dots that are either above or below the trading price. When the parabola is below the stock price, it acts as a support and trail-stop area, while indicating bullish up t
FREE
This indicator is a moving average built using the triple exponential smoothing method (T3). The indicator is part of a series of indicators - T3 Line AM, T3 Momentum AM, T3 Candles AM, T3 Signal AM .
The indicator has minimal lag and allows you to effectively follow the trend direction. The indicator is not redrawn on fully formed bars. The indicator is supplemented with signals and notifications to the terminal and e-mail.
The application of the indicator is identical to the application o
FREE

This indicator colors candles in accordance with the projected price movement. The analysis is based on the values of the classic ADX. If the DMI+ line is above the DMI- line and the main ADX line grows - the candlestick is painted in color that signals a price growth; If the DMI+ line is below the DMI- line and the main ADX line grows - the candlestick is painted in color that signals a price fall. The indicator does not redraw on completed candlesticks. The forming candlestick can change its c
FREE
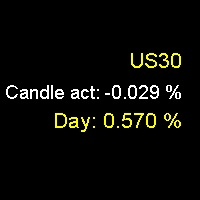
Daily Percentage and Current Candle Would you like to know how much an asset has risen or fallen in a day or in the last candle? Do you want a numerical reference for the strength and direction of price movement? Then, the Daily Percentage and Current Candle indicator is the tool you need. The Daily Percentage and Current Candle indicator shows you the percentage increase or decrease of an asset in the current day or in the last candle, depending on the timeframe you choose. The indicator allows
FREE

The indicator displays information about:
the name of the currency pair and timeframe. current price bid. time before the close of the candle. the current difference between the ask and bid (spread). Trading volume stats can also be displayed.
Displayed data
Name, account number, and account currency. A deposit in the account currency. Balance at the current time and a percentage of the balance. Current profit and its percentage. Current transaction and the percentage of the total deposit.
FREE
RTL Map (Reference Trend Line Map) - the indicator is based on a complex of digital technical indicators described in the article by Vladimir Kravchuk: " Digital indicators in the technical analysis of financial markets ". The indicator displays buy/sell signals on the price chart for such digital indicators of technical analysis as FTLM and STLM, as well as directly the lines of digital filters RSTL, SATL, RFTL, FATL. Signals are displayed on fully formed bars and are not redrawn. It is recomme
FREE

Investment Castle Volatility Index has the following features: 1. This indicator shows the volumes of the current symbol and the market volatility. 2. This indicator is built-in in the Investment Castle EA which works as volatility index for the EA dynamic distance and opposite start. 3. Parameters available for optimization for each pairs. 4. Works with any chart.
FREE

The LevelsPivotMT4 plots the pivot points and forms the support and resistance levels. The indicator does not repaint.
Default colors Yellow - pivot point. Green - resistance levels R1, R2, R3. Red - support levels S1, S2, S3. Installed similar to any standard indicator.
Analysis rules Trade the rebound from support or resistance lines. Accordingly, the target is the central line (the pivot point, yellow by default).
FREE
The product is based on J.F. Ehlers' Center of Gravity indicator. Center of Gravity actually has a zero lag and allows to define turning points precisely. The indicator is a result of Ehlers' research of adaptive filters. It identifies main pivot points almost without any lag. The indicator places signals on the price chart according to COG data. The indicator does not repaint.
Parameters:
Length - indicator calculation period; MaPrice - price used to calculate the indicator; Signal - ind
FREE

This scanner shows the trend values of the well known indicator Parabolic SAR for up to 30 instruments and 8 time frames. You can get alerts via MT4, Email and Push-Notification as soon as the direction of the trend changes. This is the FREE version of the indicator: Advanced Parabolic SAR Scanner The free version works only on EURUSD and GBPUSD!
Important Information How you can maximize the potential of the scanner, please read here: www.mql5.com/en/blogs/post/718074
You have many possibil
FREE

Market Dashboard FREE Indicator gives you advanced information’s about your selected Symbols in MarketWatch
Features
Daily Price Movements (M1 – D1) RSI Values with Highlight Function for your current Timeframe & H1 & H4 Profit per Symbol and traded lots (buy & sell) EMA 5 – 100 based on selected period Swap Information (which direction is positive) FIBO Info & Tracking (highlighted FIBO Levels close to current price – based on selected period) One Click ChartOpen this Version is limited to
FREE
Highly configurable Average True Range (ATR) indicator.
Features: Highly customizable alert functions (at levels, crosses, direction changes via email, push, sound, popup) Multi timeframe ability Color customization (at levels, crosses, direction changes) Linear interpolation and histogram mode options Works on strategy tester in multi timeframe mode (at weekend without ticks also) Adjustable Levels Parameters:
ATR Timeframe: You can set the lower/higher timeframes for ATR. ATR Bar Shift: y
FREE
This indicator displays candle prices on the chart based on moving average data. That is, the opening price is the opening price of the moving average, the closing price is the closing price of the moving average, and so on. This approach allows you to visualize the average price changes, eliminate the "noise" and get a picture more suitable for evaluation and decision making. The indicator does not redraw on fully formed bars. At the same time, the indicator can change its data on the zero bar
FREE

TLM Map AM (Trend Line Momentum Map) is an indicator developed based on a set of digital technical analysis indicators described in the article by Vladimir Kravchuk: " Digital indicators in the technical analysis of financial markets ". The indicator displays in a separate window a complex of digital technical analysis indicators such as FTLM and STLM. Recommended for use in conjunction with the RTL Map AM (Reference Trend Line Map) indicator. The indicator has no customizable parameters.
FREE

A ratio between 0 and 1 with the higher values representing a more efficient or trending market, It is used in the calculation of Perry J. Kaufman Adaptive Moving Average (KAMA), dividing the price change over a period by the absolute sum of the price movements that occurred to achieve that change. The Fractal Efficiency or also known as Efficiency Ratio was first published by Perry J. Kaufman in his book ‘Smarter Trading‘. This is mostly considered a filter for volatile markets none the less
FREE
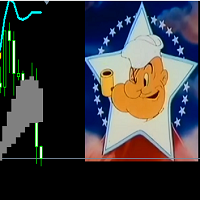
pappye indicator uses bolinger band to trigger it's signal ,it contain's pappye animation for alerting trading signals this alert is not continuous for the same arrow it will played 2 times only it could be used for any pair any time frame personally i prefer to inter a trade when there is to consecutive arrow in horizontal level after a breakout drift in a price but you could choose your way after trying the demo copy on your terminal
parameters fast : fast bolinger period slow : slow boli
FREE
The indicator analyzes the divergence of the current price with the Laguerre filter data. The indicator does not re-paint on formed bars. To confirm the indicator signal, wait till the price exceeds the High (for buying) or Low (for selling) of the bar, at which the indicator changed its color. The indicator is easy to apply and configure. It can be used as an element of any trend-following strategy. Configured parameters: T_Price - price for trend calculation; D_Price - current price against w
FREE
EasyTrend 2 AM is an indicator that allows you to open a position at the very beginning of a significant price movement. The second most important quality of the indicator is the ability to follow the trend as long as possible in order to obtain all potential profits while minimizing potential losses. The indicator allows you to notify the user about your signals by sending messages to the terminal and e-mail. This indicator does not repaint or not recalculate.
Signal of the indicator: red arr
FREE
The presented indicator is essentially a separate trading system. The indicator independently determines entry points and points for setting protective stop orders. This product can be useful for both beginners and experienced traders, since it is developed on the basis of solutions proven by time and by professional traders. On fully formed bars the indicator is not redrawn. The indicator has the ability to send notifications to the terminal and email. Technically, the indicator is a system of
FREE

Technically, the indicator represents the difference between two fractal adaptive moving averages. Fractal Adaptive Moving Average (FRAMA) is a smart adaptive moving average developed by John Ehlers. FRAMA takes price changes into account and closely follows the price level, remaining straight during price fluctuations. FRAMA takes advantage of the fact that markets are fractal and dynamically adjusts the lookback period based on this fractal geometry. The indicator has the ability to send notif
FREE

L'indicateur R Stoploss Signals est basé sur une tendance suivant une moyenne mobile exponentielle.
Cet indicateur forex génère des signaux de trading d'achat et de vente sous la forme de lignes bleues et rouges tracées sur le graphique d'activité.
Les lignes de couleur bleue indiquent que la tendance est à la hausse et c'est un signal pour acheter la paire de devises. Les lignes de couleur rouge indiquent que la tendance est à la baisse et c'est un signal pour vendre la paire de devises. U
FREE

GBP INDEX
The Currency Index Project is ONE part of a thorough Forex study. Many people do not know the theoretical basis that drives currency exchange rates to move on the market. With this set of tools you will be able to have a more complete view of the entire market by analyzing not only the single currency of an exchange, but all the exchange rates that make up that currency by looking at a single window!
The indicator faithfully represents the real index of a single currency present in
FREE

Acceleration/Deceleration Technical Indicator (AC) measures acceleration and deceleration of the current driving force. This indicator will change direction before any changes in the driving force, which, it its turn, will change its direction before the price. If you realize that Acceleration/Deceleration is a signal of an earlier warning, it gives you evident advantages. But, a classical AC indicator does not include any input parameter. In the source file we can see that this indicator are us
FREE
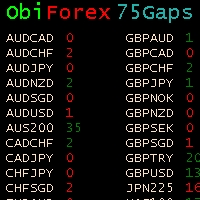
Gaps Size 75 - Market Gap Indicator The Gaps Size 75 indicator reveals the gaps between the current day and the previous day, aiding your trading decisions. It is designed for the "END OF WEEK GAPS" strategy, allowing you to identify potential opportunities. This indicator supports up to 75 currency pairs, with additional pairs available upon request. The columns are color-coded for easy interpretation. For inquiries regarding the weekend gaps strategy, kindly send a private message. Gaps Size 7
FREE

The indicator allows you to trade binary options. The recommended time frame is М1 and the expiration time is 1 minute. The indicator suitable for auto and manual trading. A possible signal is specified as a arrows above/under a candle. You should wait until the candle closes! Arrows are not re-painted Trade sessions: LONDON and NEWYORK section Currency pairs: GRB/USD Working time frame: M1 Expiration time: 1 minute. The indicator also shows good results when using the martingale strategy - "Mar
FREE
This indicator allows to hide CCI oscillator (on all MT4 timeframes) from a date define by the user, with a vertical line (Alone) or a panel (with "Hidden Candles"). Indicator Inputs: Period Apply To Information on "Commodity Channel Index" indicator is available here: https://www.metatrader4.com/en/trading-platform/help/analytics/tech_indicators/commodity_channel_index ************************************************************* Hey traders!! Give me your feeds! We are a community here and
FREE

The Keltner Channel indicator represents a channel along the moving average , with the width defined by calculating the average true range on the period of the moving average. This indicator can be applied for receiving signals, as well as a substitute for the Moving Average Envelopes indicator. Its advantage is the increased quality of channel width auto selection, which can be adjusted using the Size of channel in percent parameter.
Indicator Parameters Period of indicator - calculation peri
FREE

The demo version of the Colored Candles indicator - calculates the parameters of each candle, as well as its volume. After that, it paints the candles depending on their strength and direction. Bullish candles are colored green and bearish candles - red. The greater the power of the bulls or the bears, the brighter the color. You can change the colors if you want. The indicator helps to analyze the price movement, as well as market entry points. The more accurate signals are formed on the higher
FREE

Note: this product is a free limited version of the full featured product Currency Timeframe Strength Matrix . It only includes AUD, CAD, CHF currencies instead of all 8 currencies. It includes only 5S, 1M, 5M time frames instead of all 8 (5S, 1M, 5M, 15M, 30M, 1H, 4H, 1D).
What is it? The Currency TimeFrame Strength Matrix is a simple and comprehensive Forex map that gives a snapshot of what is happening in the Forex market at the very present time. It illustrates the strength and momentum
FREE

The VMA is an exponential moving average that adjusts its smoothing constant on the basis of market volatility. Its sensitivity grows as long as the volatility of the data increases. Based on the Chande's Momentum Oscillator, the VMA can automatically adjust its smoothing period as market conditions change, helping you to detect trend reversals and retracements much quicker and more reliable when compared to traditional moving averages.
FREE

Spin is an intrinsic form of angular momentum carried by elementary particles, composite particles (hadrons), and atomic nuclei.
Spin is one of two types of angular momentum in quantum mechanics, the other being orbital angular momentum. The orbital angular momentum operator is the quantum-mechanical counterpart to the classical angular momentum of orbital revolution and appears when there is periodic structure to its wavefunction as the angle varies.For photons, spin is the quantum-mechanica
FREE
Technical analysis indicator described in the article by Vladimir Kravchuk: " Digital indicators in the technical analysis of financial markets ".
In the proposed version, the indicator provides two types of signals: 1. Zero crossing; 2. Change of direction. To use it effectively, it is necessary to take into account the long-term trend and open a position only in its direction. It is recommended to use signal confirmation. A signal is considered confirmed if the current price has overcome the
FREE
This is a Indicator that alert if price closed above/below/touched the line. ---------------------DEMO VERSION----------------------- This will only run on GBPUSD and EURUSD currency pairs only. (Full Version works on all currency pairs ) Features/Settings: Timeframe supported: 1m, 5m 15m, 30m, 1H, 4H, 1D, 1WK, 1Mo Works on all currency pairs.
Candle Size in Pips: Alert based on Candle Full length or Candle Body Select Line style/width/color Alert type: Popup, Send to mobile, Email Input alert
FREE
Trend Note Indicator Suitable for multi time frame market direction prediction. Blue and red color indicate the buy and sell call respectively. Blue indicator is denote buy call and Red indicator denote the sell call. Happy trade!! this indicator is suitable for all time frame, but our recommended time frame to use 1hour and 4 hours, suitable for any chart.
FREE
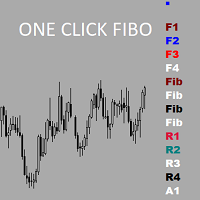
Утилита предназначена для упрощения графического анализа.Настроив один раз , можно сохранить в шаблон,все настройки сохранятся.В настройках меняются уровни фибоначчи , цвета,стили и толщина линий также текстовые метки на кнопках.Есть возможность расширить функционал , добавить временные зоны Фибоначчи ,Фибо арки ,линии по углу ,продление прямоугольных зон до текущей цены.Присылайте рекомендации,все можно осуществить в рамках бесплатной утилиты.
FREE

The WTR Dynamic Range Indicator is a powerful and deeply customizable range indicator that takes in account the average upward and downward movement of the price in the past trading days. This fully customizable indicator can be setted for a lot of uses and cases:
• Trend trading on level breakouts
• Spotting high probability targets for Take Profits
• Setting a multiple targets for position scaling out The WTR Dynamic Range Indicator calculates the average movements in the long side, the
FREE

Télécharge les données manquantes pour toutes les paires de devises disponibles dans la surveillance du marché. Très utile pour tester les EA et les stratégies et télécharger tout l'historique en une seule fois plutôt qu'individuellement. L'indicateur fonctionnera jusqu'à ce que toutes les données historiques des paires de devises sélectionnées aient été téléchargées. L'indicateur a plusieurs options : 1. Télécharger les données pour une seule paire 2. Télécharger pour la paire actuelle uniqueme
FREE
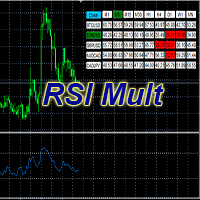
Standard Oscillator RSI (Relative Strength Index) with some additions.
Allows you to select up to 5 instruments.
Displaying indicator data from selected instruments for all time frames.
Fast switching to the selected instrument or time frame.
The RSI indicator shows good signals, but its readings still need to be filtered.
One such possible filter could be RSI from a higher period.
This version of the Oscillator is designed to make it easier to work with charts, namely, to reduce th
FREE

This indicator does not process the price chart data and does not provide trading signals. Instead, it is an application to compute and display the frequency response of many conventional indicators. Moving averages like the SMA, LWMA and EMA, and oscillators like the MACD, CCI, Awsome Osc, all have the form of digital filters. Electronic engineers use a special method to characterise the performance of these filters by studying their frequency response. Two important quantities of the frequ
FREE

Supertrend Moving Average A combination of Supertrend and Moving Average to create a converging trade setup Input parameters: signal mode: set it to true if you want to plug it into STAT (Signal Tester and Trader) arrow shift: distance between fast EMA line to arrow on chart turn on price line filter turn on moving average signal for converging setup k period d period s period averaging method Moving average period Averaging method upper level limit (Stochastic) lower level limit (Stochastic)
FREE

Индикатор показывает: открытые ордера по инструменту; количество ордеров; профит по Buy и Sell каждого инструмента; суммарный профит. Количество строк и столбцов по инструментам определяется автоматически, в зависимости от ширины окна. Индикатор обновляется по таймеру, время обновления задается в настройках. Устанавливать индикатор можно любой график вне зависимости от ТФ и пары. Клик по названию инструмента переключает текущий график на выбранный. Совместно со скриптом https://www.mql5.com/ru/
FREE

ContiStat restricted - Free DEMO version of the ContiStat indicator
Free version of the indicator is ment as DEMO of full paid version. Full functionality is available, however The indicator work only on M30 chart period . Find the ContiStat indicator for full functionality
Brief description The ContiStat indicator calculate statistic frequency of green (up) and red (down) movement in the chart and determine movement dynamics (silver curve). There are two key parameters to understand the Cont
FREE
Découvrez comment acheter un robot de trading sur le MetaTrader Market, le magasin d'applications de la plateforme MetaTrader.
e système de paiement de MQL5.community prend en charge les transactions via PayPal, les cartes bancaires et les systèmes de paiement populaires. Nous vous recommandons vivement de tester le robot de trading avant de l'acheter, pour une meilleure expérience client.
Vous manquez des opportunités de trading :
- Applications de trading gratuites
- Plus de 8 000 signaux à copier
- Actualités économiques pour explorer les marchés financiers
Inscription
Se connecter
Si vous n'avez pas de compte, veuillez vous inscrire
Autorisez l'utilisation de cookies pour vous connecter au site Web MQL5.com.
Veuillez activer les paramètres nécessaires dans votre navigateur, sinon vous ne pourrez pas vous connecter.