 MetaTrader 5
 Experts
 Indicateurs
 Scripts
 Bibliothèque
 Stockage
Rejoignez notre page de fans

Volume Strength Compass / BhanuCodeLab - indicateur pour MetaTrader 5

- Vues:
- 94
- Note:
- Publié:
- Mise à jour:
-
 Vous manquez des opportunités de trading :
- Applications de trading gratuites
- Plus de 8 000 signaux à copier
- Actualités économiques pour explorer les marchés financiers
Inscription Se connecterVous acceptez la politique du site Web et les conditions d'utilisation
Si vous n'avez pas de compte, veuillez vous inscrire -
 Besoin d'un robot ou d'un indicateur basé sur ce code ? Commandez-le sur Freelance
Aller sur Freelance
Besoin d'un robot ou d'un indicateur basé sur ce code ? Commandez-le sur Freelance
Aller sur Freelance
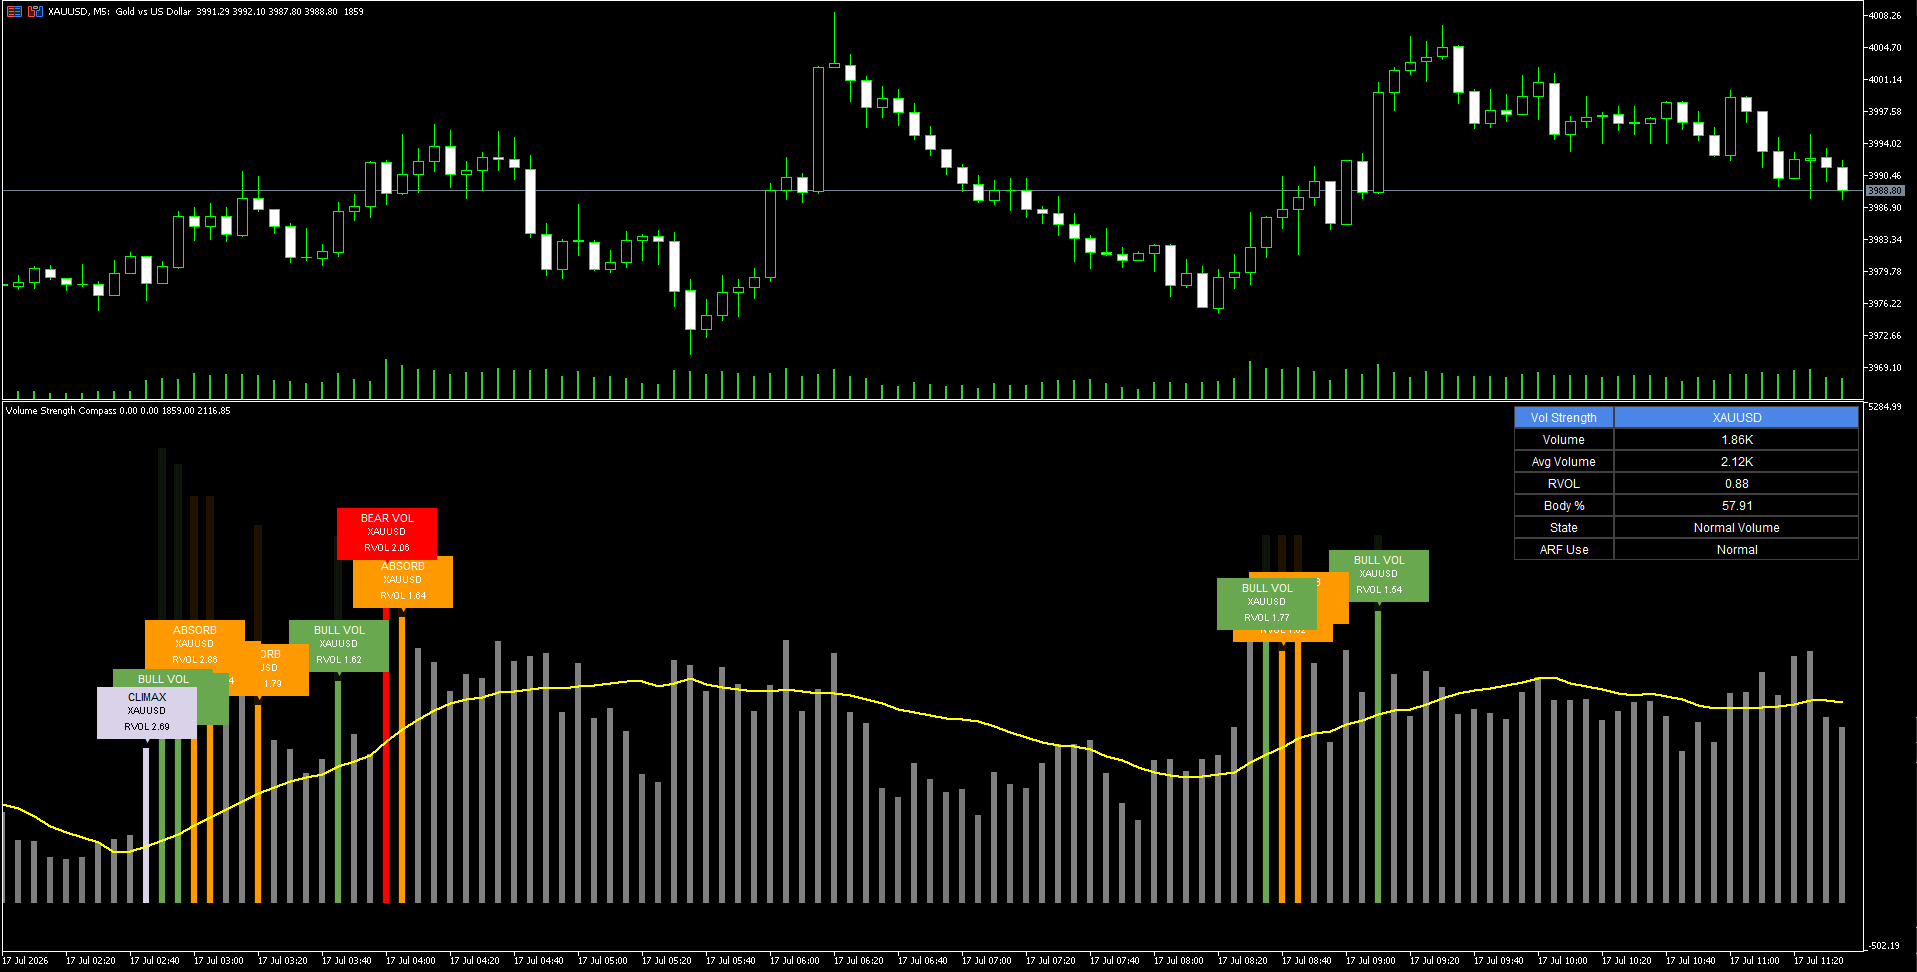
Cet indicateur sert à évaluer l'intensité de l'activité du marché derrière chaque bougie et à déterminer si cette activité a donné lieu à une tendance haussière ou baissière significative.
Il aide les traders à faire la distinction entre :
- une activité de marché normale
- un volume inhabituellement élevé ou faible
- une forte participation haussière
- une forte participation baissière
- un volume de climax
- absorption, où le volume est élevé mais l'évolution des cours est faible
Par exemple, une grande bougie haussière accompagnée d’un volume relatif élevé peut indiquer une véritable pression d’achat, tandis qu’une petite bougie accompagnée d’un volume très élevé peut suggérer une absorption ou un éventuel point de retournement.
Cela est particulièrement utile pour :
- Les traders axés sur l'action des cours, qui souhaitent obtenir une confirmation par le volume avant d'entrer sur le marché.
- Les traders de cassure, qui souhaitent vérifier si une cassure bénéficie d’une forte participation.
- Les traders de retournement, qui recherchent un point culminant ou une absorption à proximité des niveaux de support et de résistance.
- Les traders intrajournaliers et les scalpers, qui ont besoin d’informations rapides sur la vigueur actuelle du marché.
- Les traders de Forex et de CFD, qui utilisent principalement le volume par tick dans MetaTrader.
- Les traders de cryptomonnaies, d’actions et de contrats à terme, pour lesquels le volume réel peut être disponible.
- Les traders débutants, car le tableau de bord traduit les données brutes de volume en états simples tels que « Bull Good Volume », « Bear Good Volume », « Climax » ou « Absorption ».
Cet indicateur est particulièrement utile comme outil de confirmation, et non comme stratégie de trading à part entière. Les points d'entrée doivent toujours être combinés avec la direction de la tendance, les niveaux de support et de résistance, la structure du marché ou une autre méthode d'entrée.
Traduit de l’anglais par MetaQuotes Ltd.
Code original : https://www.mql5.com/en/code/75081
Candle Body-to-Wick Pressure Oscillator
Converts the body-to-wick makeup of every candle into a bounded conviction reading, then smooths it into an oscillator that flags buyer/seller pressure and automatically marks divergence against price.
Volume-Weighted Delta Divergence Oscillator
A normalized order-flow oscillator that estimates buy/sell volume pressure per bar, accumulates it into a rolling delta, and automatically flags regular bullish and bearish divergence against price swings.
SMMA Levels MTF / BhanuCodeLab
SMMA Levels MTF est un indicateur de moyenne mobile lissée (SMMA) multi-périodes destiné à MetaTrader 5. Cet indicateur calcule les valeurs SMMA à partir de plusieurs périodes sélectionnables et les affiche simultanément sur le graphique actuel.
Currency Strength Meter
Ranks the 8 major currencies by relative strength on a live on-chart panel, calculated from the average percentage change of every available cross pair — not just USD pairs — so weak/strong currencies are visible at a glance, independent of whichever chart you have open.