 MetaTrader 5
 Experts
 지표
지표
 스크립트
스크립트
 라이브러리
라이브러리
 보관함
보관함
당사 팬 페이지에 가입하십시오

Volume Strength Compass / BhanuCodeLab - MetaTrader 5용 지표

MQL4, MQL5, TradingView Pine Script, NinjaTrader/NinjaScript, TradeStation EasyLanguage, Python을 활용하여 개발합니다. Expert Advisor(EA), 사용자 정의 지표, 대시보드, 알림, 거래 관리 도구, 플랫폼 간 변환, 브로커 API 연동 및 완전한 트레이딩 전략 자동화를 개발합니다.
- 조회수:
- 29
- 평가:
- 게시됨:
- 업데이트됨:
-
 이 코드를 기반으로 한 로봇이나 지표가 필요하신가요? 프리랜스로 주문하세요
프리랜스로 이동
이 코드를 기반으로 한 로봇이나 지표가 필요하신가요? 프리랜스로 주문하세요
프리랜스로 이동

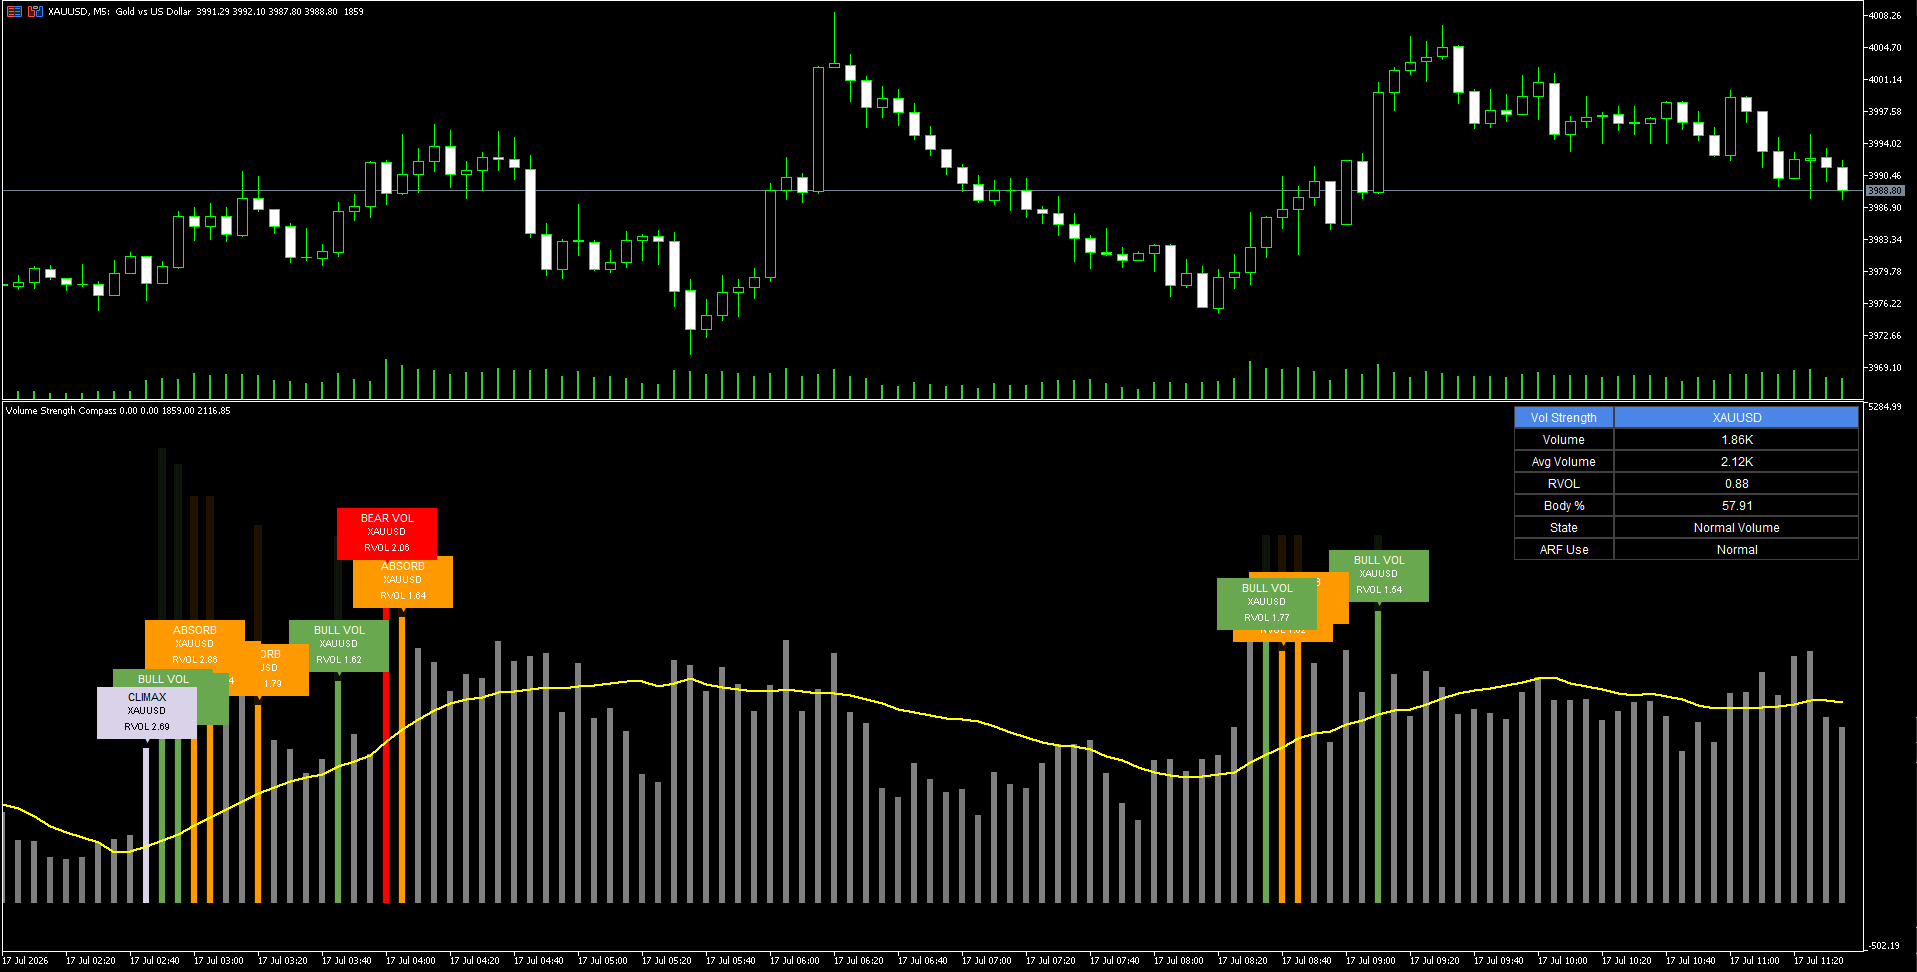
이 지표는 각 캔들 뒤에 숨겨진 시장 활동의 규모를 파악하고, 그 활동이 의미 있는 강세 또는 약세 결과를 낳았는지 여부를 파악하는 데 사용됩니다.
이는 트레이더가 다음을 구분하는 데 도움을 줍니다:
- 일반적인 시장 활동
- 비정상적으로 높거나 낮은 거래량
- 강력한 강세 참여
- 강한 약세 참여
- 클라이맥스 거래량
- 흡수 국면: 거래량은 많으나 가격 변동이 미미한 경우
예를 들어, 상대적 거래량이 높은 큰 상승 캔들은 진정한 매수 압력을 나타낼 수 있는 반면, 거래량이 매우 많지만 캔들이 작은 경우는 흡수 현상이나 잠재적인 반전 시점을 시사할 수 있습니다.
이는 특히 다음의 경우 유용합니다:
- 진입 전에 거래량 확인을 원하는가격 움직임(Price-action) 트레이더.
- 브레이크아웃 트레이더: 브레이크아웃에 강한 참여가 있는지 확인하고자 하는 경우.
- 지지선 및 저항선 부근에서 클라이맥스나 흡수 현상을 찾는반전 트레이더.
- 현재 시장 강세에 대한 신속한 정보가 필요한일중 트레이더 및 스캘퍼.
- 메타트레이더에서 주로 틱 거래량을 활용하는외환 및 CFD 트레이더.
- 실제 거래량이 확인 가능한암호화폐, 주식 및 선물 트레이더.
- 대시보드가 원시 거래량 데이터를 ‘강세 양호 거래량’, ‘약세 양호 거래량’, ‘클라이맥스’ 또는 ‘흡수’와 같은 간단한 상태로 변환해 주기 때문에초보 트레이더에게 적합합니다.
이 지표는 그 자체로 완전한 거래 전략이라기보다는 확인 도구로 사용하는 것이 가장 좋습니다. 진입 시점은 여전히 추세 방향, 지지선 및 저항선, 시장 구조 또는 다른 진입 방법과 결합하여 결정해야 합니다.
MetaQuotes Ltd에서 영어로 번역함.
원본 코드: https://www.mql5.com/en/code/75081
Candle Body-to-Wick Pressure Oscillator
Converts the body-to-wick makeup of every candle into a bounded conviction reading, then smooths it into an oscillator that flags buyer/seller pressure and automatically marks divergence against price.
Volume-Weighted Delta Divergence Oscillator
A normalized order-flow oscillator that estimates buy/sell volume pressure per bar, accumulates it into a rolling delta, and automatically flags regular bullish and bearish divergence against price swings.
SMMA Levels MTF / BhanuCodeLab
SMMA Levels MTF는 MetaTrader 5용 다중 시간대 평활 이동 평균(SMMA) 지표입니다. 이 지표는 선택 가능한 여러 시간대의 SMMA 값을 계산하여 현재 차트에 함께 표시합니다.
Currency Strength Meter
Ranks the 8 major currencies by relative strength on a live on-chart panel, calculated from the average percentage change of every available cross pair — not just USD pairs — so weak/strong currencies are visible at a glance, independent of whichever chart you have open.