Piyush Lalsingh Ratnu / Perfil
Piyush Lalsingh Ratnu
- Trader & Analyst en Piyush Ratnu Financial Market Research
- Emiratos Árabes Unidos
- 234
- Información
|
3 años
experiencia
|
0
productos
|
0
versiones demo
|
|
0
trabajos
|
0
señales
|
0
suscriptores
|
Amigos
14
Solicitudes
Enviadas
Piyush Lalsingh Ratnu
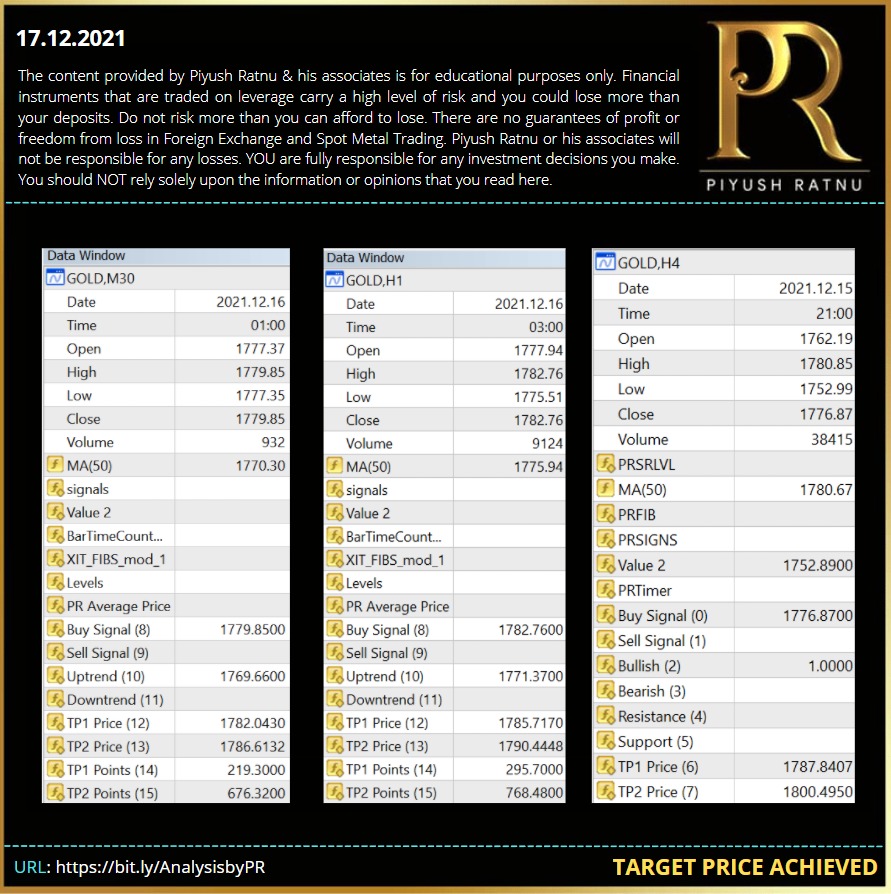
Target 1 and 2: M30 H1 and H4 successfully achieved as per the trading alerts generated on 16.12.2021 after FOMC at 1777 zone. In my analysis too, I had mentioned a reversal might trigger 1777, 1796 and 1808, today GOLD is at 1803/4. Accuracy proved once again. Those who followed analysis, am sure made handsome profits.
All the traders who are holding BUY positions in GOLD from 1752/1777/1796 price range are suggested to close the trades in net profit right now. CMP 1803.33
I expect a down rally ahead. WHY?
Gold is in R zone now.
Fundamentals will now drive it to new range, subject to announcements and new statements, will be better to observe the momentum and ranges first.
Gold is near pivot too, I prefer to enter in trades at levels, rather than near mid ranges/pivot ranges.
Since today is Friday, it is wise to close all trades in current profits to avoid weekend swap charges and stress during weekend.
Join TELEGRAM channel for latest updates and market analysis:
If you are on Telegram,
Copy this url and paste in browser: https://lnkd.in/dch4WQnk
#PiyushRatnu #BullionTrading #Trading #Dubai

Piyush Lalsingh Ratnu
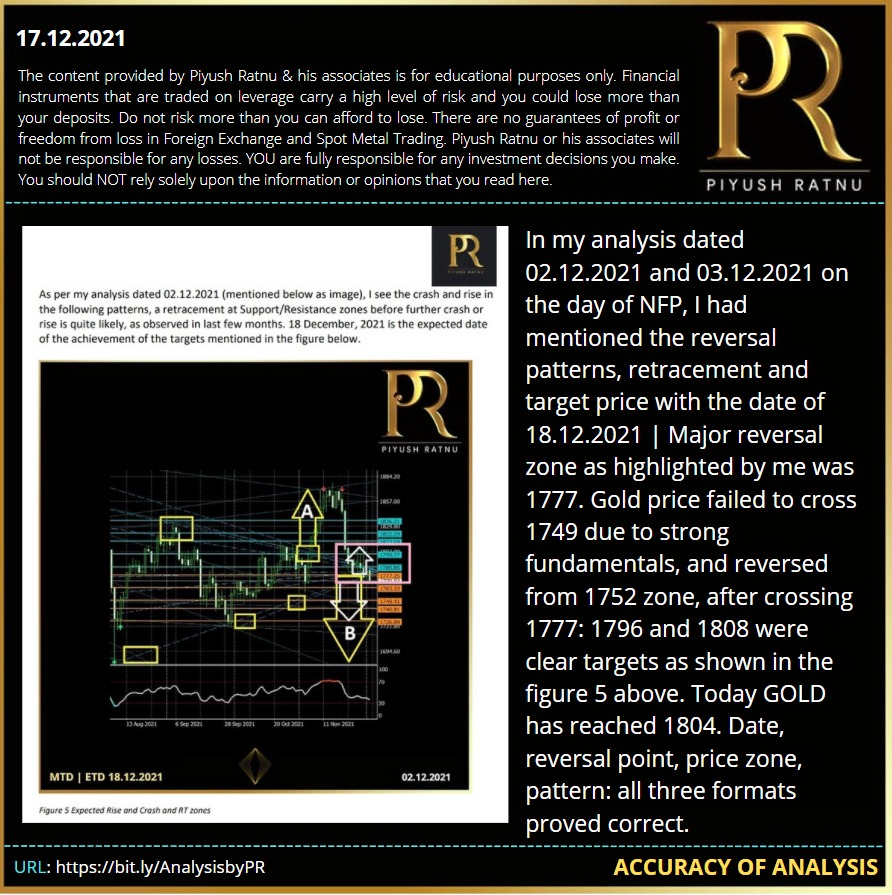
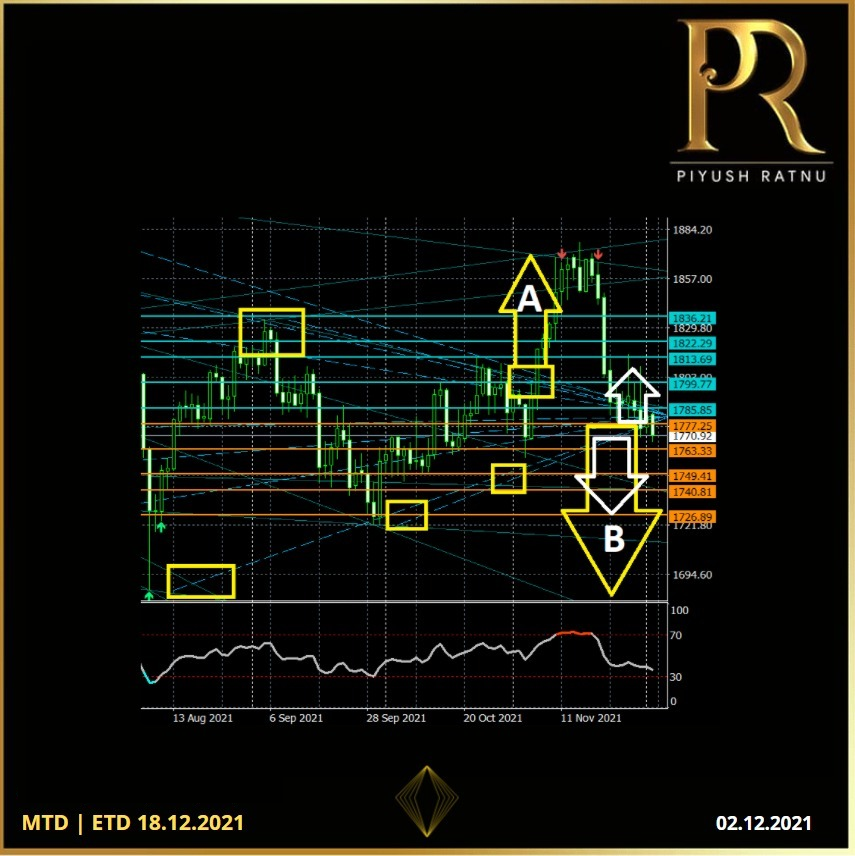
In my analysis dated 02.12.2021 and 03.12.2021 on the day of NFP, I had mentioned the reversal patterns, retracement and target price with the date of 18.12.2021 | Major reversal zone as highlighted by me was 1777. Gold couldnt cross 1749, and reversed from 1752 zone, after crossing 1777: 1796 and 1808 were clear targets as shown in the figure 5 above. Today GOLD has reached 1804. Date, reversal point, price zone, pattern: all three formats proved correct.
Join TELEGRAM channel for latest updates and market analysis: If you are on Telegram, Copy this url and paste in browser: https://bit.ly/AnalysisbyPR #PiyushRatnu #BullionTrading #Trading #Dubai
Join TELEGRAM channel for latest updates and market analysis: If you are on Telegram, Copy this url and paste in browser: https://bit.ly/AnalysisbyPR #PiyushRatnu #BullionTrading #Trading #Dubai

Piyush Lalsingh Ratnu
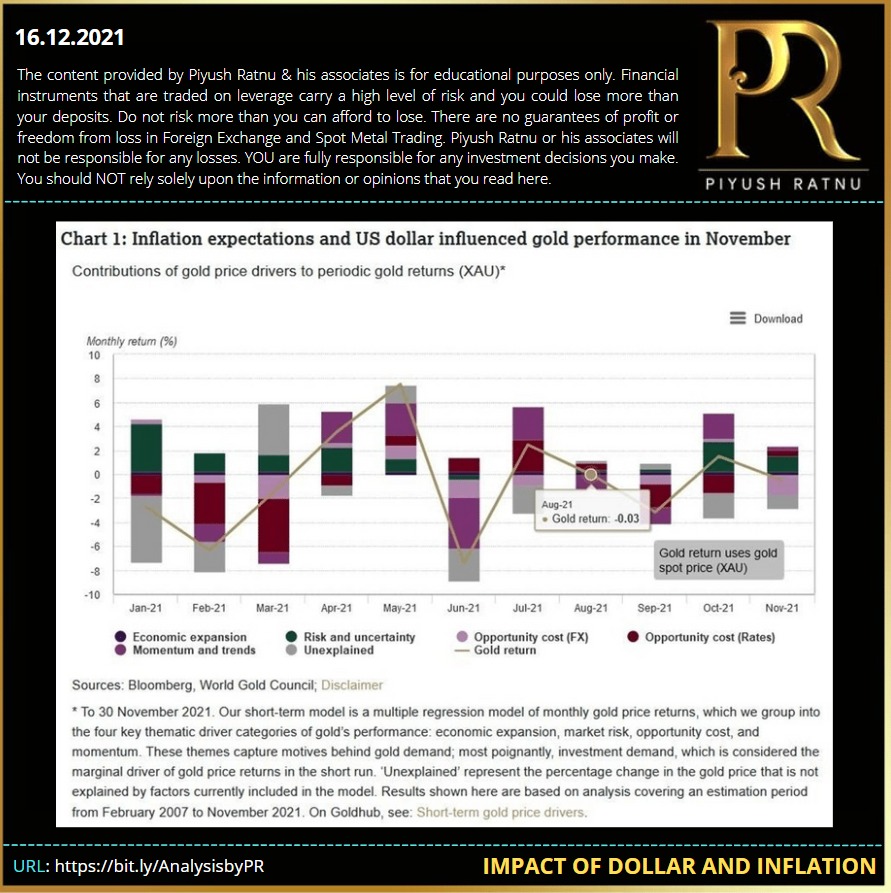
Gold struck by the strong dollar
nvestors seem unsure about what to do with gold amid high levels of uncertainty in the market. The Federal Reserve has finally admitted that the high-level inflation we've been seeing is not transitory, but investors are left to try to guess what the central bank will do next.
Meanwhile, signals from within the gold market are mixed, as exchange-traded funds recorded inflows for the first month since July, despite the roughly flat gold price in November. The yellow metal has been unable to pick up momentum this month, staggering around amid weak economic data, a fluctuating dollar, and the type of uncertainty that usually drives its price higher.
The problem for gold right now is that it can't seem to find the momentum to keep rising with all that's going on. The yellow metal appears range-bound between $1,775 and $1,790. Breakeven inflation climbed 2.7% intra-month in November, the highest level since 2005. The World Gold council added that investors remain focused on inflation and central banks' possible reactions to it, which remain a strong influence on the price of gold.
The organization expects investors to remain preoccupied with inflation and regulators' potential responses to it for the rest of the year. Last week, Fed Chairman Jerome Powell stated that the word "transitory" is no longer applicable to the current inflation rate and suggested that the central bank could start tapering its asset-buying program sooner than previously expected. As a result, investors will also be watching the pace of expected interest rate hikes.
The focus is now on tomorrow's inflation reading, although the gold market has been struggling to respond to rising inflation. The big problem for gold right now is the strong dollar, which is holding the yellow metal back toward the lower boundaries of this week's trading range. Now some market watchers are expecting a recession in 2023 due to accelerated tightening by the Fed.
Join TELEGRAM channel for latest updates and market analysis:
If you are on Telegram,
Copy this url and paste in browser: https://bit.ly/AnalysisbyPR
#PiyushRatnu #BullionTrading #Trading #Dubai

Piyush Lalsingh Ratnu
Gold pared all the daily losses and rose to new daily highs as Federal Reserve Chair Jerome Powell's press conference was deemed not as hawkish by the markets following the central banks' decision to double its tapering pace.
Powell told reporters on Wednesday that data developments, including the latest inflation and employment numbers out of the U.S., warranted this evolution in monetary policy.
"The unemployment rate [is projected] to fall to 3.5% by the end of the year … while inflation will run above our 2% goal well into next year," he said. "Price increases are spreading to broader goods and services. We are attentive to risks that persist in real wage growth."
Powell clarified that the risk of persistently higher inflation is now greater, which justifies the accelerating tapering pace.
Prior to the press conference, the Fed announced that it would be doubling its tapering pace to $30 billion a month. This change will conclude the Fed's asset-purchasing program in early 2022.
The updated dot-plot also revealed that officials project three quarter-point increases in the benchmark federal funds rate in 2022.
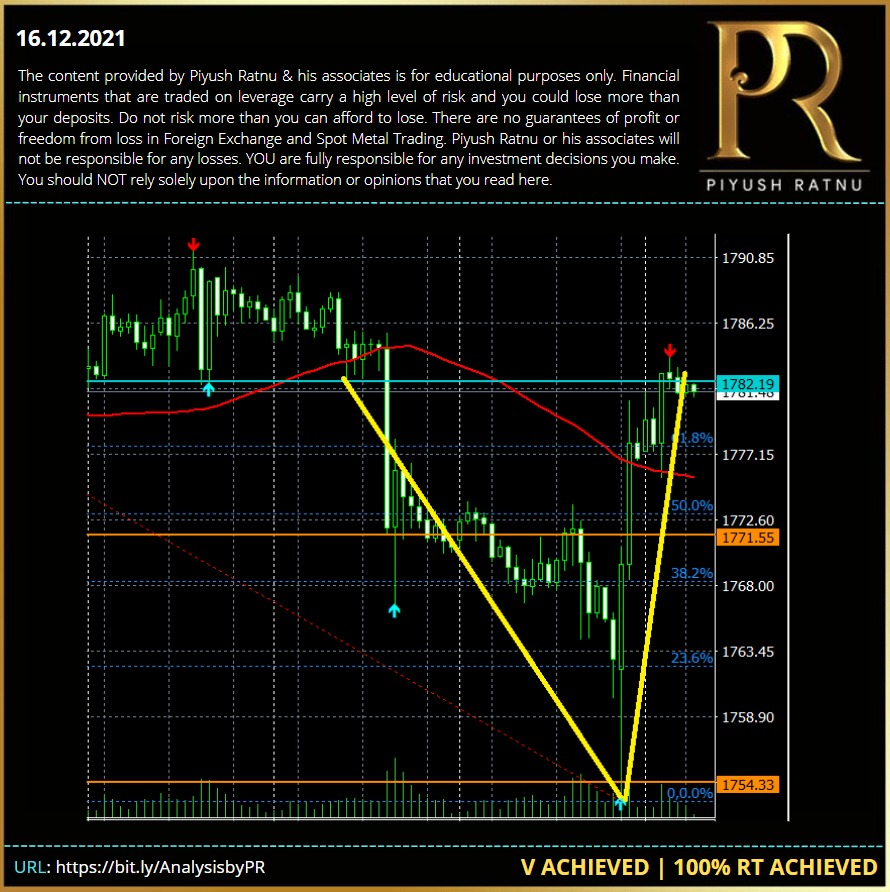
GOLD: crash: $1782-$1752, reversal: $1752-1782:
$60 movement completed in last 12 hours.
Join TELEGRAM channel for latest updates and market analysis:
If you are on Telegram,
Copy this url and paste in browser: https://bit.ly/AnalysisbyPR
#PiyushRatnu #BullionTrading #Trading #Dubai

Piyush Lalsingh Ratnu
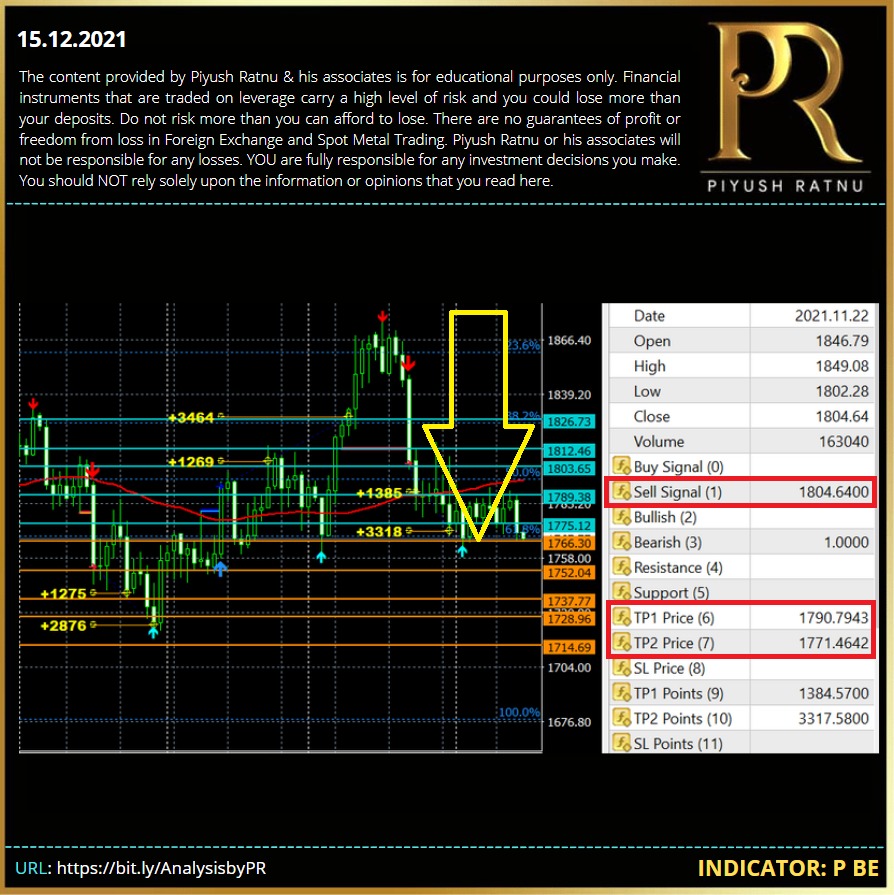
As alerted on Monday, 13.12.2021:
GOLD crashed from 1791 till 1777 and 1767 (today's S1: 1766) and yesterday's low was 1766 too.
Am sure those who took trades at 1790 zone, made decent profits.
Join TELEGRAM channel for latest updates and market analysis:
If you are on Telegram,
Copy this url and paste in browser: https://bit.ly/AnalysisbyPR
#PiyushRatnu #BullionTrading #Trading #Dubai

Piyush Lalsingh Ratnu
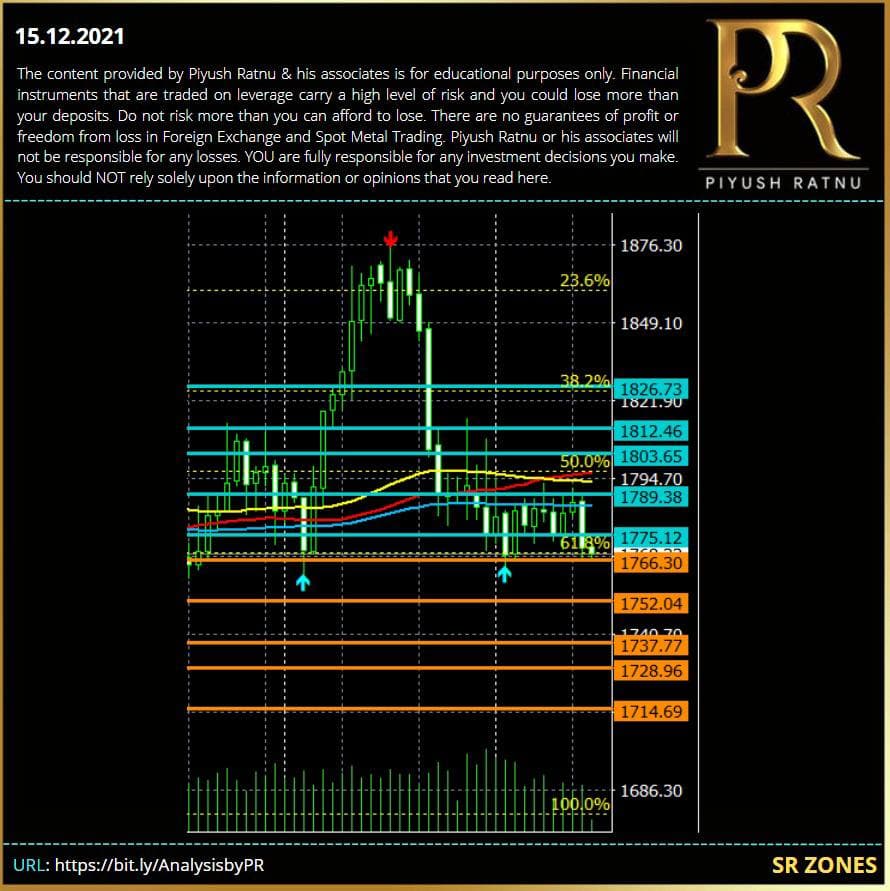
As indicated on 13.12.2021: a SELL signal was generated by a set of indicators including our algorithm, and GOLD crashed from 1790 zone till 1777/1769 | TP1 and 2 achieved on H1 chart based alert too.
Gold held onto its worst daily loss since the end of November as investors weighed the latest U.S. inflation data and counted down to the conclusion of the final Federal Reserve meeting of the year later Wednesday.
Prices paid to U.S. producers posted a record annual increase of almost 10% in November, a surge that will sustain a pipeline of inflationary pressures well into 2022. This is boosting the case for the Fed to tighten monetary policy, which is weighing on non-interest bearing assets such as precious metals.
Fed policy makers could announce a doubling of the pace of its bond-buying taper and lay out a steeper path of expected interest rate hikes, according to Bloomberg Economics.
Bullion is heading for its first annual loss in three years amid diminishing monetary support from central banks, although uncertainties surrounding the impact of the new virus variant could stoke demand for haven assets. The World Health Organization is concerned that omicron is being dismissed as mild, even as it spreads at a faster rate than any previous strain of Covid-19.
As alerted on Monday, 13.12.2021:
GOLD crashed from 1791 till 1777 and 1767 (today's S1: 1766) and yesterday's low was 1766 too. Am sure those who took trades at 1790 zone, made decent profits.
It's a late night event today, quite close to market closing timing, a sudden rise and dip in volumes might trigger repetition of volatility in Asian session too.
There is less space to exit in RT based trades, as per the past track record, the momentum and volatility is experienced for 30 minutes after Interest Rate Decision, the impact of FOMC is faced during the speech, Q&A session and for another 45-90 minutes after the Q&A session. However since the market closing timing will be closer, I don't think traders will get enough space or time duration to hedge or exit in Net average, specially traders like me who trade more on retracement based price zone/FIB zones.
It will be worth observing, where and where to get in the trading positions inorder to exit in NET positions.
Though, I won't hesitate to avoid trading today completely, in case I feel a extension of crash or price rise pattern might happen in Asian and London session next day, further getting extended to NYSE opening tomorrow.
So, summarising the same: fundamentals make technicals, so I will not rely merely on technical analysis and patterns to predict the market movement today, it is always wise to observe, analyse and then trade rather than predicting the movement on the basis of various facts. Because sometimes it doesn't matter how many facts you consider, one small fact can change the complete trading scenario and can result in huge losses.
As per my analysis,
Scenario A: The crash zone stops are:
1745
1717
1685
1666
Further extension might trigger price to 1590 zone
Scenario B: The rise stops are:
1796 (1803 R3)
1818 (1812 R4)
1832 (1826 R5)
Further extension might trigger price to 1866/1888 zones
Year end, US China tensions, Inflation, YCC, Dollar strength, Festival - Holiday season ahead, New Year Exchange opening session, DOT plot, Rate projection and many other factors will be impacting Dollar and Gold both together in parallel/opposite and sometimes in a proportionate way.
Hence trading carefully during this session, is very important.
Aggressive trades, wrong decisions can put the complete account in big difficulty.
NAP should be the main focus, money should not be.
Saving the principle amount is the main motto.
Making higher profits is not my motive today.
Because I want to start my New Year with a clean slate, not with a floating loss.
Not to forget, last year, In January, first 20 days, Gold crashed till 1777 from price range of 1966. In such one direction based market movements, there are high chances that traders can lose their entire principle.
Wishing us ALL THE BEST!
Join TELEGRAM channel for latest updates and market analysis:
Copy this url and paste in browser: https://bit.ly/AnalysisbyPR
#PiyushRatnu #BullionTrading #Trading #Dubai

Piyush Lalsingh Ratnu
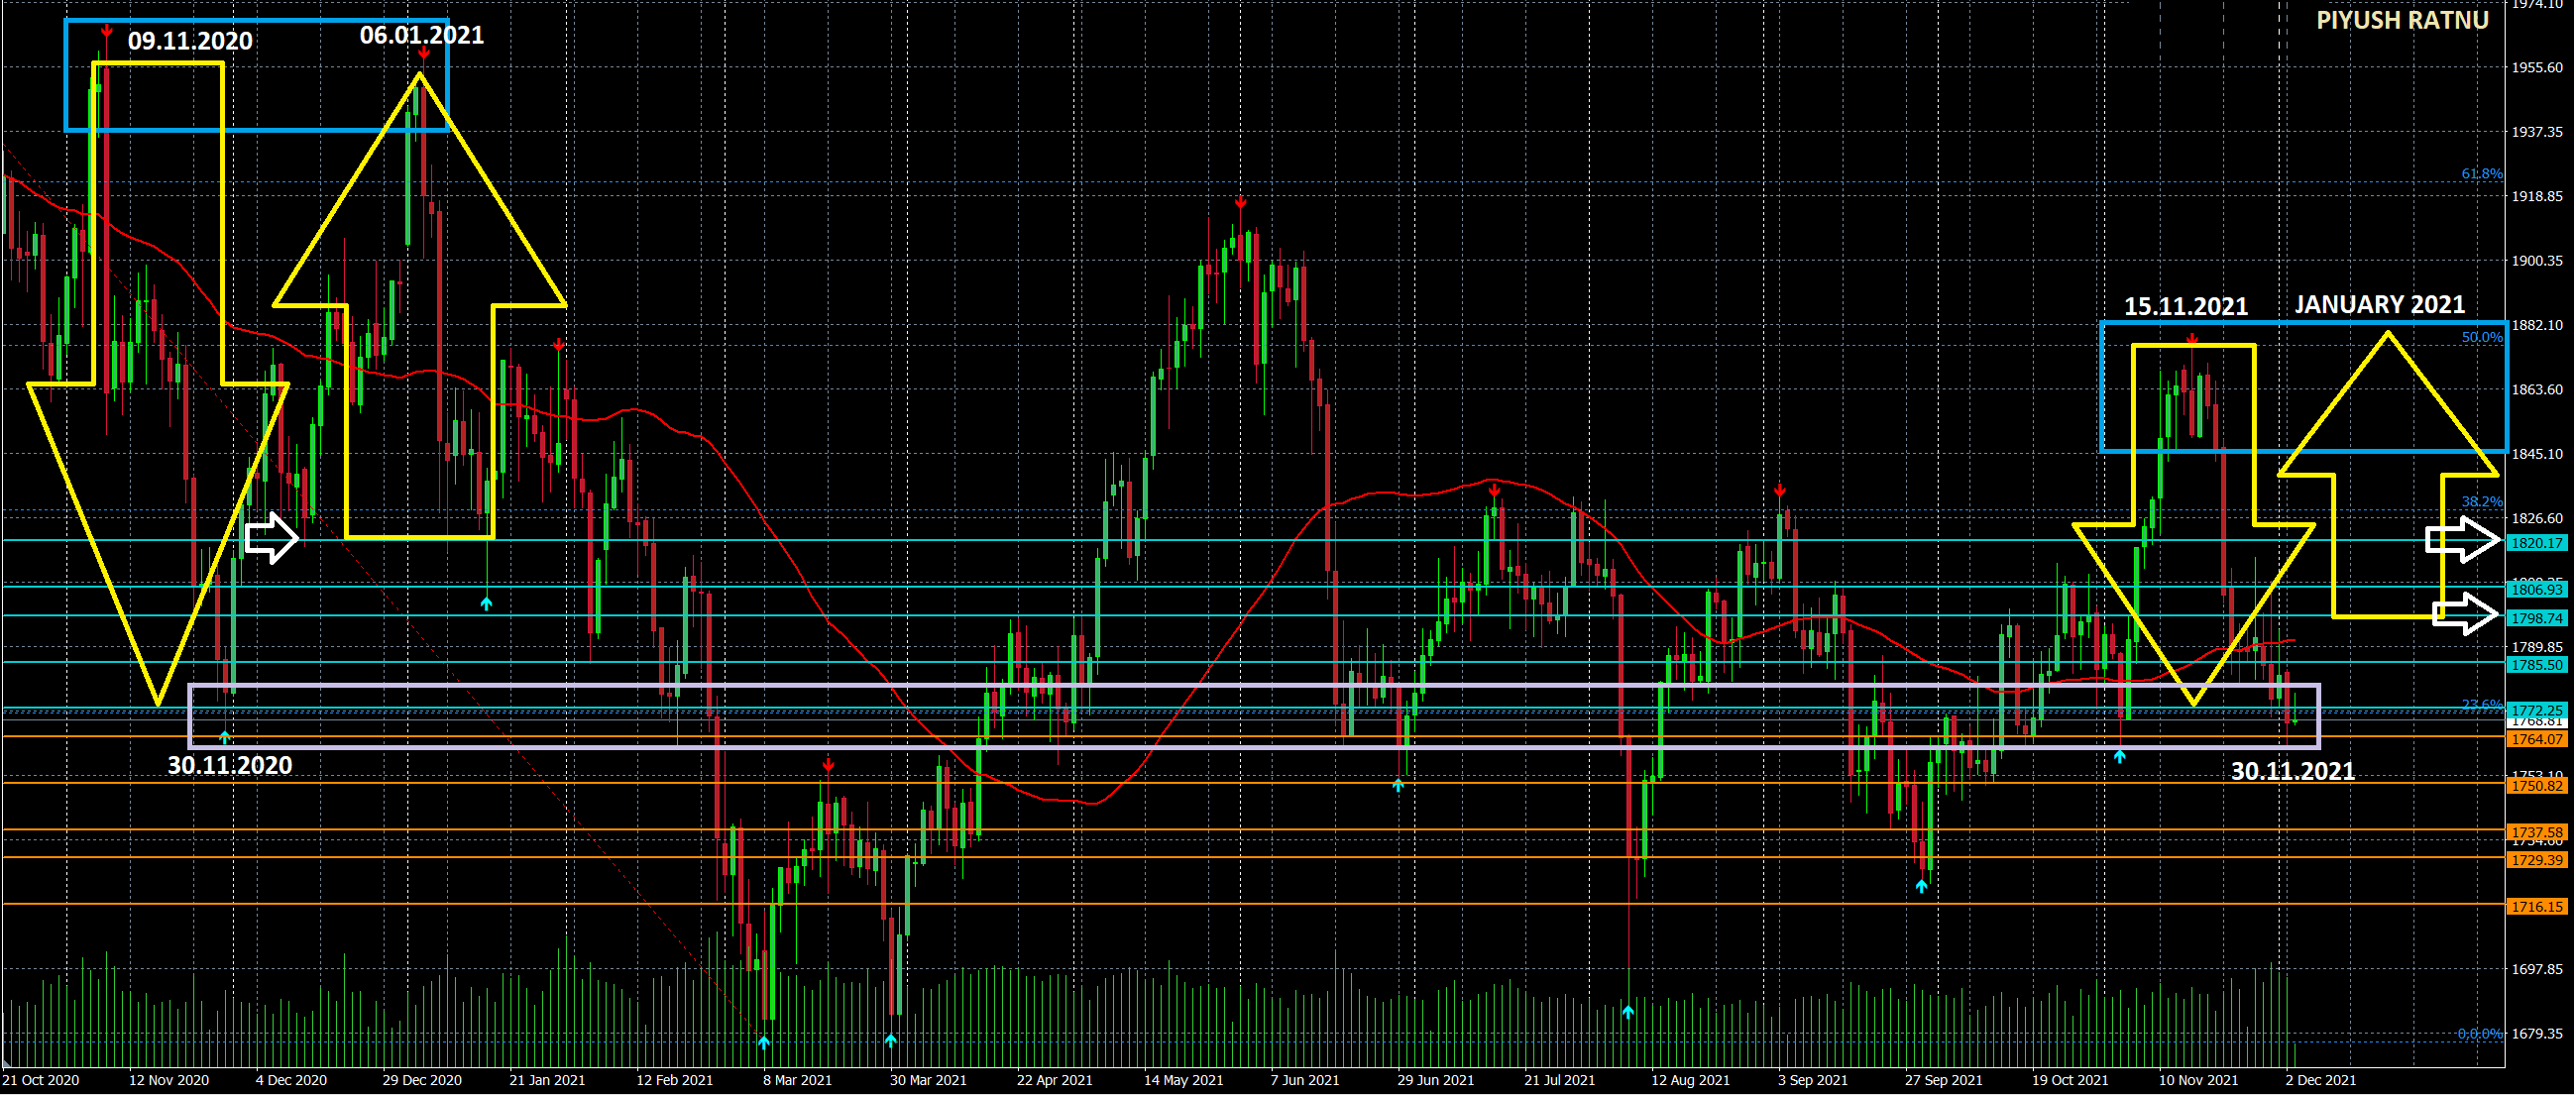
Repetition of November 2020 patterns, likely?
From the technical point of view if we analyse and check the price movement last year during November, 2020 as compared to November 2021, there is quite a similarity between both till now with a gap of 4 days to be precise. In my earlier analysis I had mentioned the high possibilities of crash in first and second week of November 2021, followed by reversal/rise in first-second week of December 2021 as per the past data mapping of last 6 years. Last year I had published in my analysis 16 December, 2020 as a date from which Gold might start rising and Gold did rise till the price above $1955 till 06 January, 2021 before crashing further from this price point.
Before we all get overconfident, let us not forget as unexpected as it sounds, but Gold had dropped to earth-shattering levels after the US NFP data published on 06 August & 09 August 2021 which proved to be a lot stronger than expected. The price crash was observed from $1832 (ADP) to $1684 (09 August, 2021). As a result, the precious metal again repeated its history by crashing on 9th August 2021, repeating a similar pattern acknowledging its 2020's $150+ fall on 8th August well announced in advance by me.
In the same pattern, I won’t be surprised if a repetition is formed this December, 2021 – January, 2022 too. As I had mentioned earlier price patterns on specific dates remained same multiple times unless triggered by fundamentals or geo-political tensions. It will be worth observing the price movement and SR zones based price action this NFP.
Join TELEGRAM channel for latest updates and market analysis:
Copy this url and paste in browser: https://bit.ly/AnalysisbyPR
#PiyushRatnu #BullionTrading #Trading #Dubai

Piyush Lalsingh Ratnu
Spot Gold on NFP: $1717/1707 or $1808/1818?
Non-Farm Payrolls numbers are all set to be released today. Let us first understand the Co-relation between NFP and XAUUSD:
The strongest negative correlation is seen 15-30 minutes after the release. One hour after the release, strong reversal or extension of trend and price movement might be observed on NYSE opening. Higher retracement/trend expansion from the CMP at the time of NFP data release can be observed until next four hours after the release with retrace target of 23.6 Fibonacci retracement on M1, M5 and M15 charts in sequence.
Further, on next Monday opening trend might extend or retrace depending on multiple factors like market sentiments, additional data, statement, CPI expectations (to be released next week for many countries), hence exiting the trades today itself in net profit is always a wise idea.
Current Scenario:
Gold price staged an impressive bounce from four-week lows of $1,770 on Wednesday to reach as high as $1,809 before reversing sharply to finish the day at $1,779. The up and down price movement extended into gold trading so far this week, as volatility returned on the back of the uncertainty surrounding the Omicron covid variant and Fed Chair Jerome Powell’s hawkish shift on the monetary policy normalization.
On a global scale, central banks' interest in gold is picking up this year. Earlier this week, markets digested the news that the central bank of Singapore increased its gold reserves by 20% this year, buying gold for the first time in two decades. This boosted Singapore's total gold reserves to a reported 153.76 tons.
The Irish central bank is adding gold to its reserves after a 12-year hiatus, and inflation worries. Overall, global gold reserves rose by 333.2 tons during the first half of the year, according to the data provided by the World Gold Council. Other notable purchasers were Thailand, Brazil and Hungary.
Will banks buy a sinking Gold, a question that comes in my mind.
Core key factors that are impacting Gold since last 10 days:
A faster wind-down of the bond-buying program is widely seen as opening the door to earlier interest rates hikes, which would raise the opportunity cost of holding non-yielding gold.
In his second day of testimony in Congress on Wednesday, Powell said the Fed needed to be ready to respond to the possibility that inflation might not recede in the second half of 2022 and the central bank would consider a faster tapering of its bond purchases at its meeting this month.
Gold plumbed a one-month low on Thursday as U.S. Federal Reserve Chairman Jerome Powell's comments on the need to tame inflation bolstered bets for faster monetary policy tightening and offset Omicron-driven safe-haven inflows into bullion.
U.S. Treasury Secretary Janet Yellen said on Thursday that lowering Trump-era tariffs on imported goods from China through a revived exclusion process could help ease some inflationary pressures, but would be no "game-changer”.
Political risks associated with the pending U.S. mid-term elections, U.S. fiscal drag, fairly steadfast central banks gold purchases, and a significantly slower pace of U.S. and global recovery are additional factors which may see investor rekindle their interest in gold very soon.
Real interest rate trends which were driven by inflation developments, Fed policy signals, and nominal rates, led to these gold price fluctuations. For most of 2021, investor ETF, CTA, and derivatives positioning were very much skewed toward the shortening of exposure
Considering this framework and the fact that the market is pricing a Fed funds hike as early as next summer, the current investor bias toward the short end of exposure has driven prices down to $1,755 recently. But summer of 2022 may be much too early for the Fed to pull the trigger on Fed Funds hikes, given the fact that nonfarm payrolls remain some 4-5 million below pre-Covid levels in the U.S.
Fundamental Summary:
Rising home prices are good indications that sustained inflation across the board is rearing its ugly head. If people expect goods price inflation to rise and remain high in the future, they will adjust their wage, rental and credit agreements.
Owners of assets, which increase in price, benefit while the holders of money suffer: They can buy fewer assets for their money
The idea that the Fed is closer to a rate hike is dampening the demand for the non-yielding inflation hedge that is the yellow metal. Strong jobs on Friday could be the nail in the coffin for gold and support the greenback higher in anticipation of a faster rate of tapering from the Fed.
The hope for the resulting higher potential growth, non-accelerating inflation rate of unemployment, may all leave the U.S. central bank comfortable keeping the economy running hot for longer. This would be a very gold-accretive real interest rate environment. The best case for gold is high but decelerating inflation.
Technical Summary:
Multiple times Gold price got rejected at 1808 and 1796 zone. 1777 acting as tough support. A crash below 1777 will trigger price to 1745/1717/1685 zones. However a reversal from 1777 can trigger the price to 1796/1808/1818/1832 stops in sequence. NFP will prove as a game changer for Gold price in the first and second week of December 2021.
SR ZONES:
Support at:
$1764
$1750-$1737 ($1745 zone)
$1729-$1716 ($1717 zone)
$1666 zone ahead
Resistance at:
$1772
$1785 - $1798 ($1796 zone)
$1806 - $1820 ($1818 zone)
$ 1832 zone ahead
SMA 50
H1: $1777
H4: $1787
D1: $1792
W1: $1800
SOC 1555 SET
H1: Marching Towards OB zone
H4: OS zone
D1: OS zone
W1: Near OB zone
IMPORTANT DATES FOR GOLD TRADERS:
03.12.2021: NFP
14/15.12 : FOMC | STATEMENTS
GARTLEY PATTERN SCANNER:
Possible scenario on the basis of GPS:
A: crash can extend till $1729-$1717 zone
B: rise might extend till $1796/$1818 zone.
MULTI-DIAGONALS + SR zones + FRACTALS
Possible scenarios:
A: Crash Stops: $1737 - $1717 - $1685
B: Rise Stops: $1796 - $1808 - $1818
POSSIBILITIES OF GOLDEN CROSS:
Gold’s daily chart is hinting at a potential reversal in the ongoing downtrend, with the 50-Daily Moving Average (DMA) having crossed the 200-DMA from below. A golden cross will be confirmed if the above averages maintain the formation on a daily closing basis.
What is a Golden Cross:
The golden cross occurs when a short-term moving average crosses over a major long-term moving average to the upside and is interpreted by analysts and traders as signalling a definitive upward turn in a market. Basically, the short-term average trends up faster than the long-term average, until they cross.
Technical Analysis Summary:
As per my analysis dated 02.12.2021 (mentioned below as image), I see the crash and rise in the following patterns, a retracement at Support/Resistance zones before further crash or rise is quite likely, as observed in last few months. 18 December, 2021 is the expected date of the achievement of the targets mentioned in the figure below.
It is always wise to PLAN THE TRADE, and then TRADE THE PLAN! Hence it is suggested to first observe the crash or rise with specific zones and levels in mind on the basis of various fundamental and technical parameters, before entering a trade in a specific direction with a target of net average profit.
I wish you all the best for today & everyday!
Join TELEGRAM channel for latest updates and market analysis:
Copy this url and paste in browser: https://bit.ly/AnalysisbyPR
#PiyushRatnu #BullionTrading #Trading #Dubai

Piyush Lalsingh Ratnu
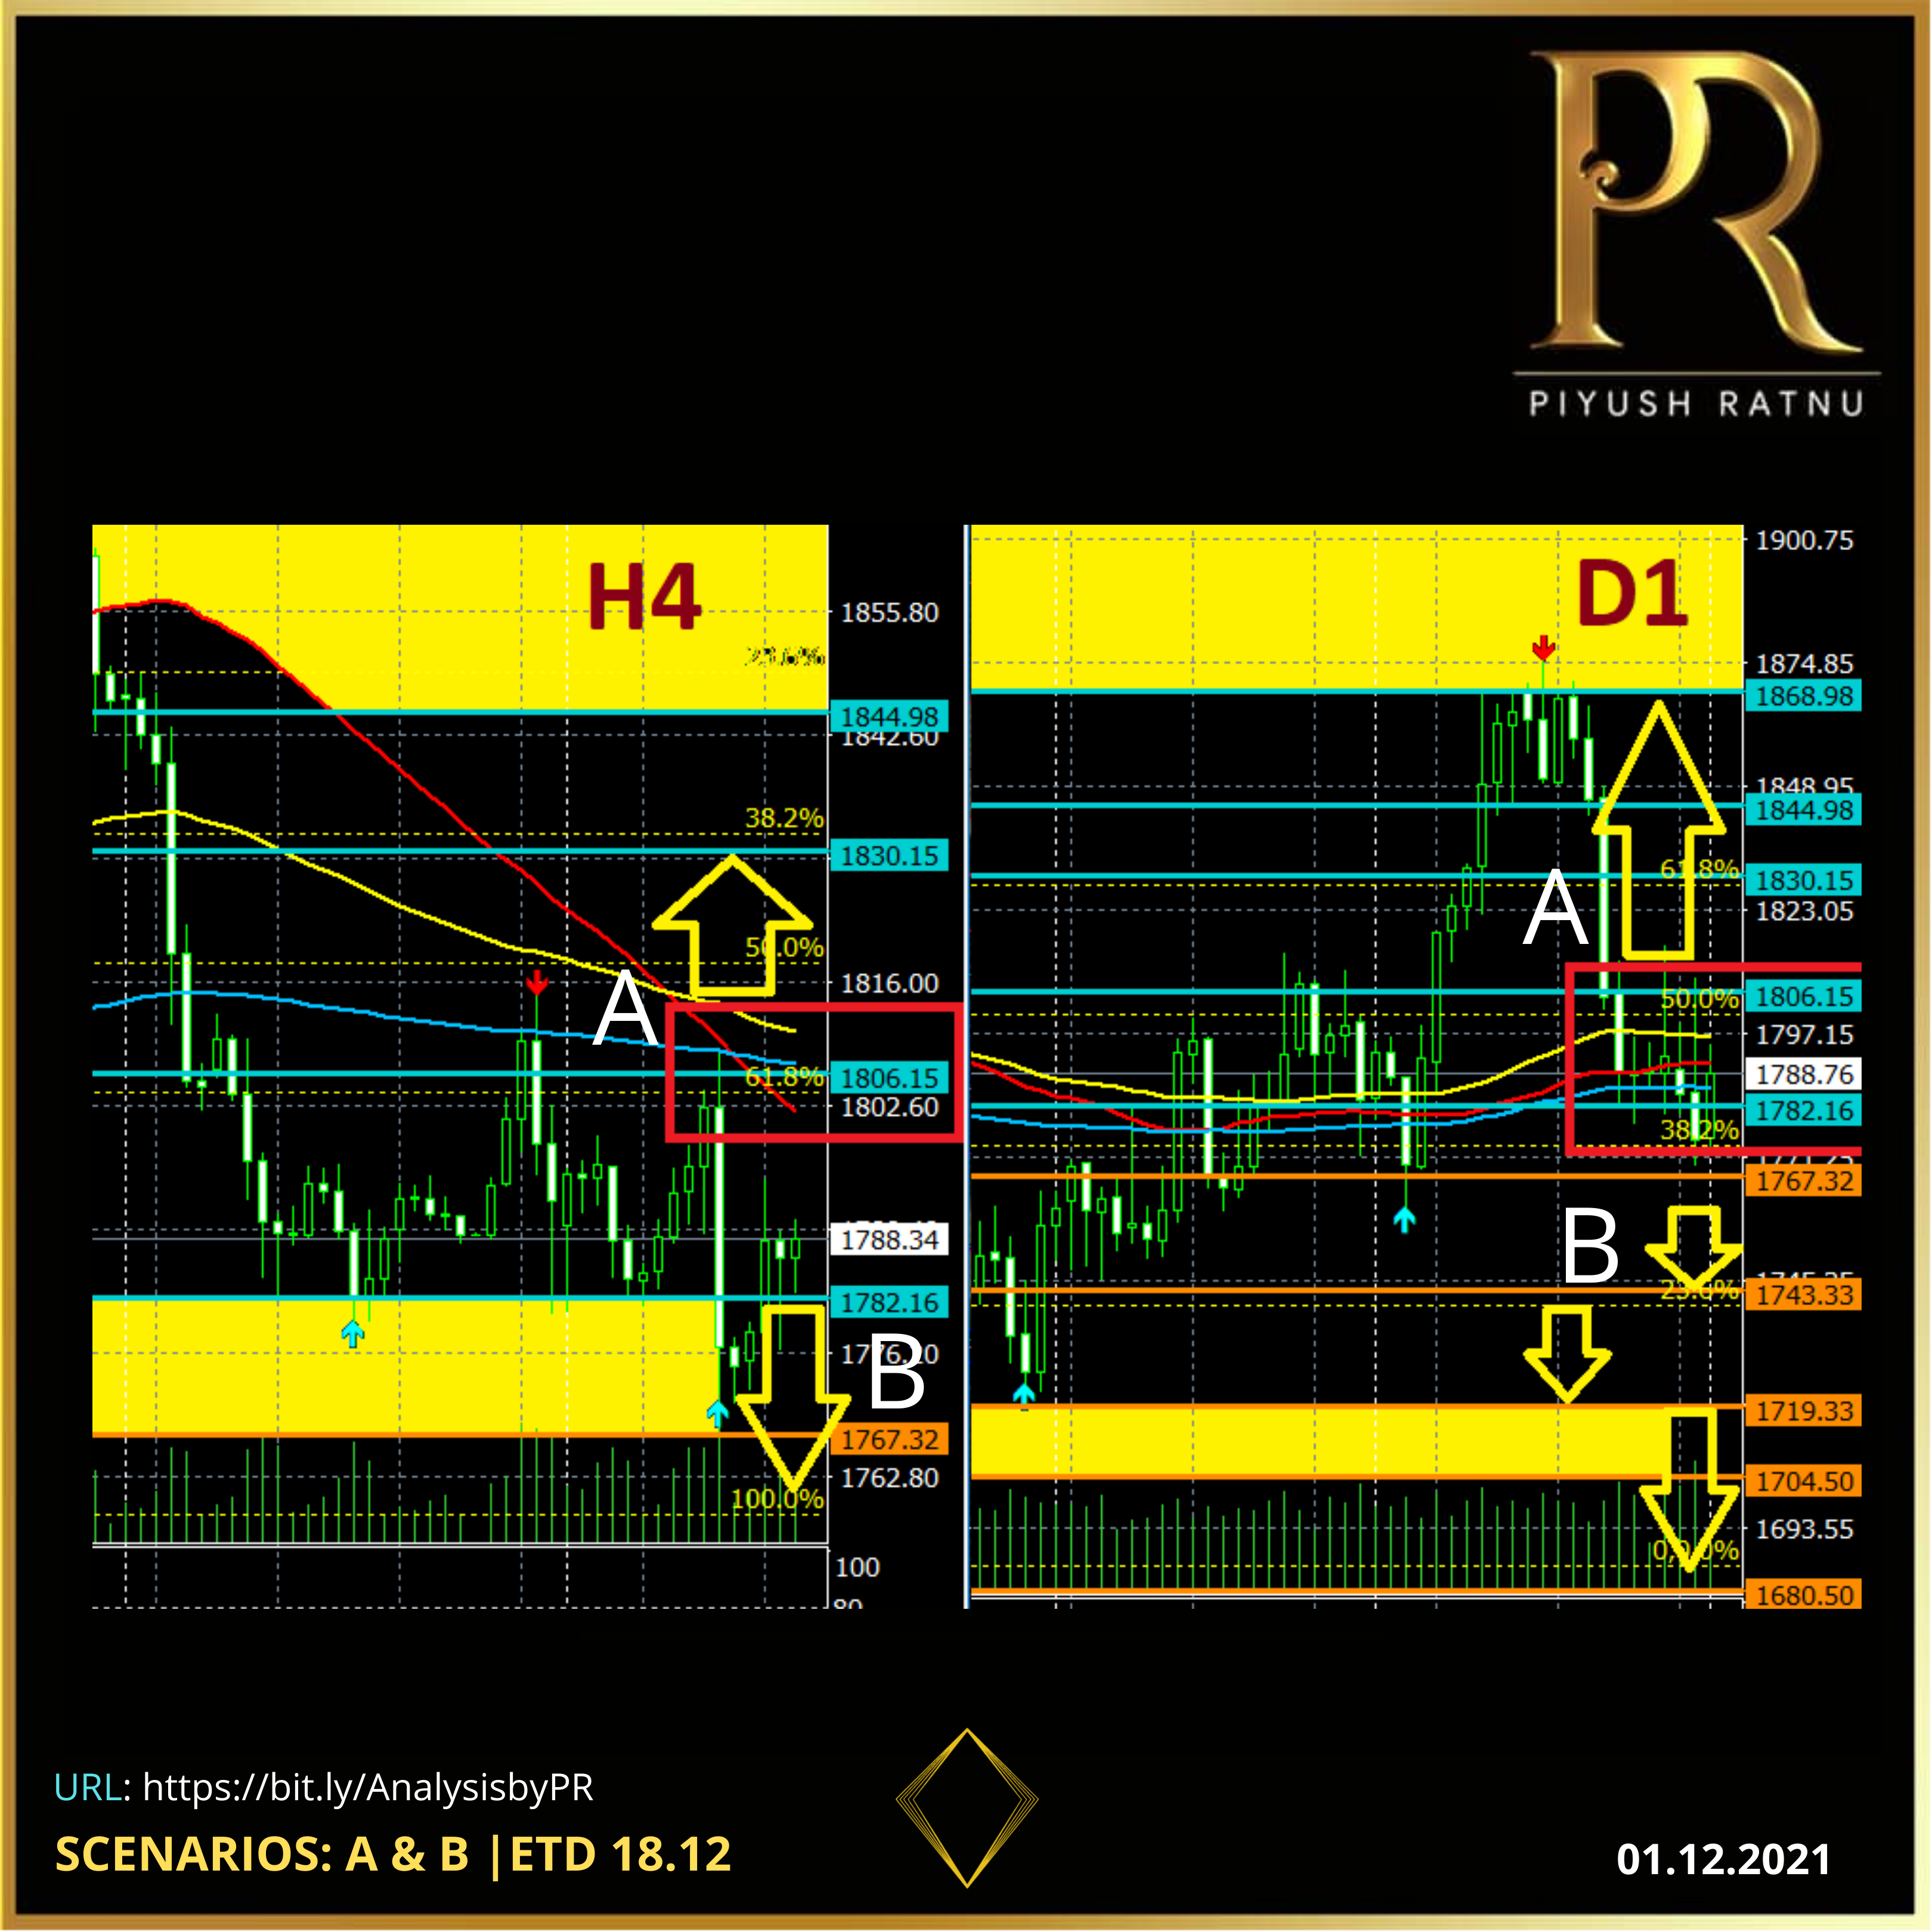
This week:
I had mentioned on Monday, Mr. Powell’s testimony is one of the key market movers this week. The impact observed yesterday was worth a good set of trades. And we traded well! Selling above 1808 and buying below 1777 on 30.11.2021 have us handsome returns.
Today:
STOCKS HIGH today as per data + Powell testifies + Yellen speech + Economic Data = HIGH VOLATILITY after 25 minutes from now.
Avoid pile ups. Observe SR zones.
NFP on 03.12.2021: $45-70 expected.
Holding the trades is NOT a good idea.
1769-1745 OR 1808-1818
Looks as the next target depending on the data and more fundamentals yet to be published.
Entering near PIVOT 1774 (1777 zone) not a good idea.
ETD 18.12.2021 | GOLD
NFP on 03.12.2021 | FED MEET 14-15.12
Join TELEGRAM channel for latest updates and market analysis:
Copy this url and paste in browser: https://bit.ly/AnalysisbyPR
#PiyushRatnu #BullionTrading #Trading #Dubai

Piyush Lalsingh Ratnu

The Omicron COVID-19 variant has a 'very high' risk of infection surges, according to WHO
In a technical brief released on Monday, the World Health Organisation said the new Omicron variant is likely to spread internationally and could have "severe consequences" for some parts of the world. The variant has a high number of mutations which is part of the reason the "overall global risk related to the new variant ...is assessed as very high".
Uncertainty might trigger volumes and price UP in GOLD.
Gold near Pivot Point CMP 1796 (r) zone.
US S 28%
JPY S 48%
AUD S 91%
I suggest all traders to be extra cautious today, markets have opened after long weekend, additional volumes can stir price in one direction, as per current candle patterns and volatility: price trap looks quite tight between 1796-1790, the breach of the same will result in 1808-1818 zone or 1777-1745 zone.
Pre session NY: will be worth observing, decent movement was observed during Asian and London session pre/opening pressures.
Avoid pile ups, exit in net average - keep principle safe.
14-17 December: I am expecting good volatility of upto $75-90 in total. One wrong set in wrong direction can result in higher floating loss.
This week: One must observe:
Mr. Powell Testifies today
Mr. Biden's statement on COVID SA Strain
WHO statements on COVID restrictions
Lockdown status at various countries
COVID numbers | death rate
Inflation data
XAUXAG Ratio
DXY | US10YT | US Futures
SR zones
ISM PMI data
Join TELEGRAM channel for latest updates and market analysis:
Copy this url and paste in browser: https://bit.ly/AnalysisbyPR
#PiyushRatnu #BullionTrading #Trading #Dubai

Piyush Lalsingh Ratnu
1866-1832-1818-1808-1796-1777
Repetition: History repeated once again.
Join TELEGRAM channel for latest updates and market analysis:
Copy this url and paste in browser: https://bit.ly/AnalysisbyPR
#PiyushRatnu #BullionTrading #Trading #Dubai
Repetition: History repeated once again.
Join TELEGRAM channel for latest updates and market analysis:
Copy this url and paste in browser: https://bit.ly/AnalysisbyPR
#PiyushRatnu #BullionTrading #Trading #Dubai
Piyush Lalsingh Ratnu
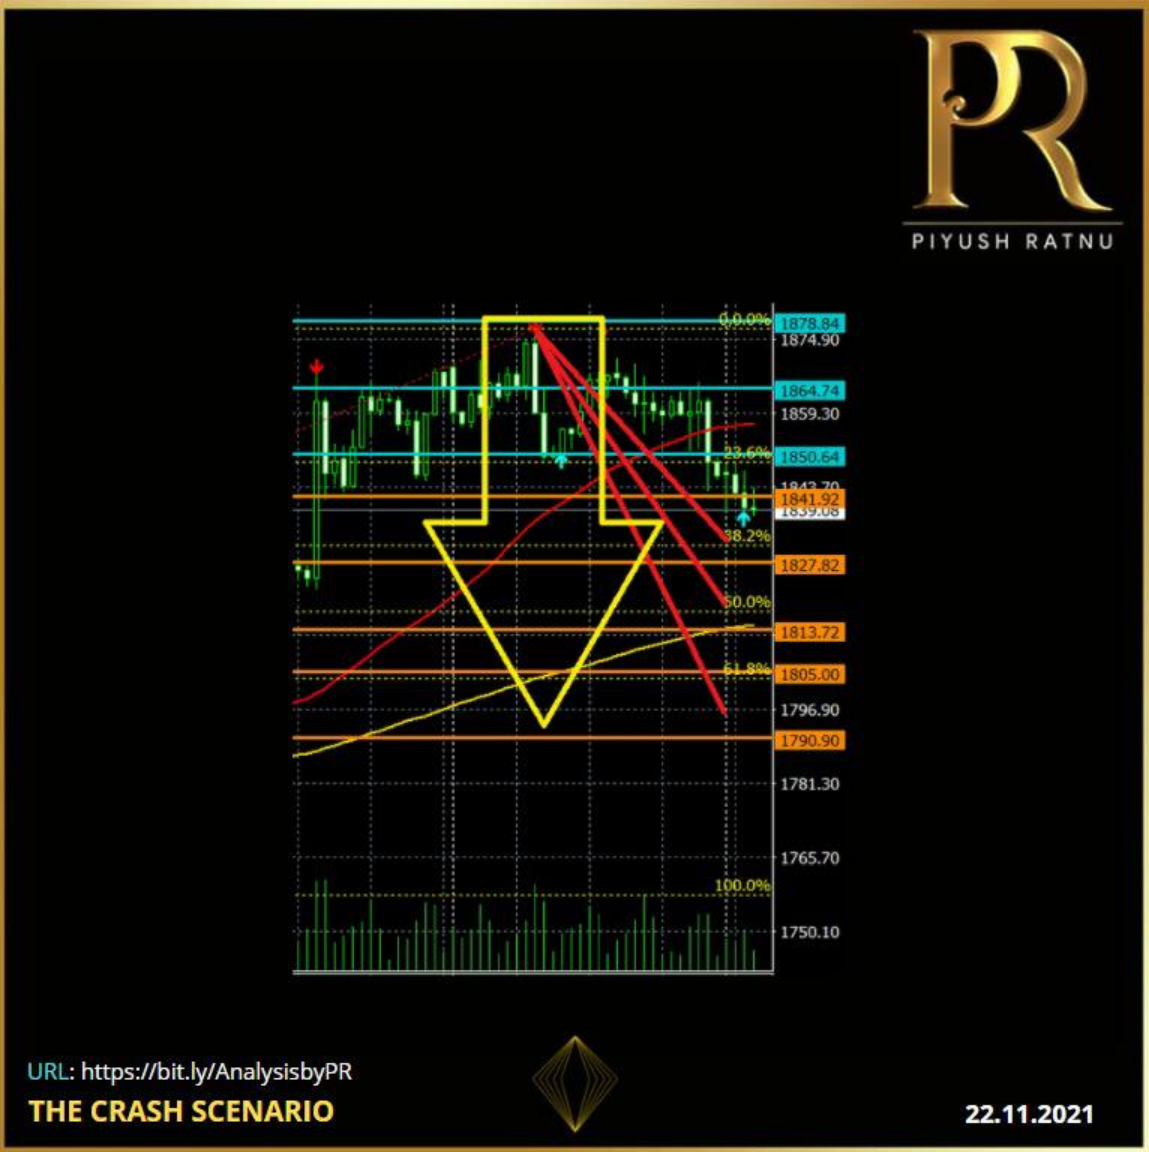
THE Crash SCENARIO: 22.11.2021
Join TELEGRAM channel for latest updates and market analysis:
Copy this url and paste in browser: https://bit.ly/AnalysisbyPR
#PiyushRatnu #BullionTrading #Trading #Dubai
Join TELEGRAM channel for latest updates and market analysis:
Copy this url and paste in browser: https://bit.ly/AnalysisbyPR
#PiyushRatnu #BullionTrading #Trading #Dubai

Piyush Lalsingh Ratnu
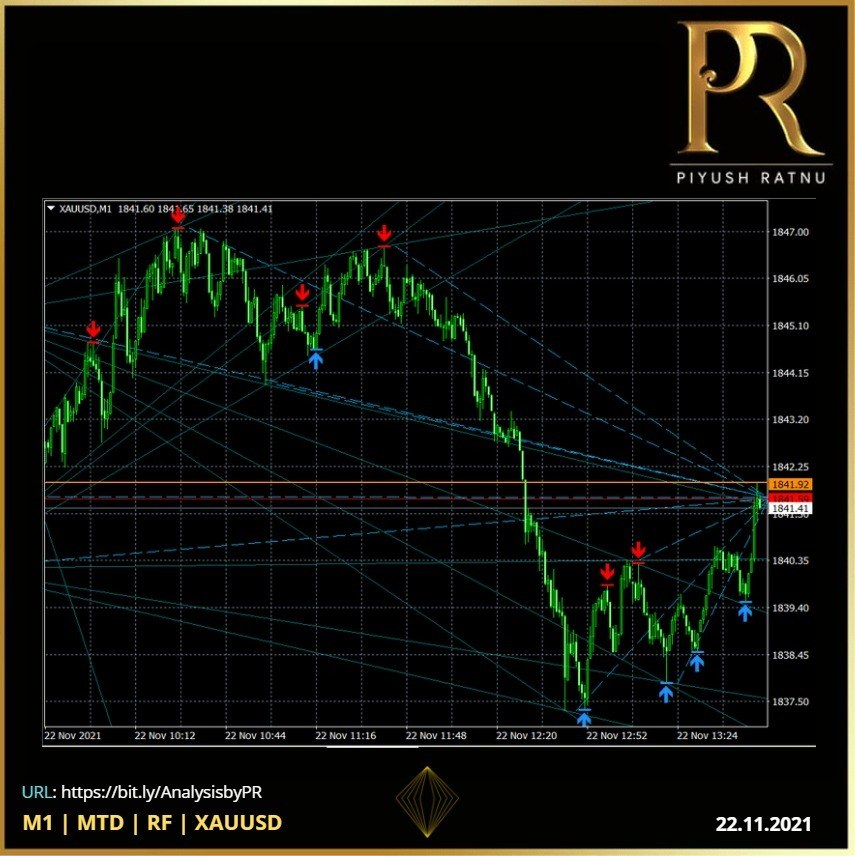
Launched new algorithm successfully.
Combination of 36 parameters | Exclusively for SPOT GOLD.
First set of BUY trades: Entry levels suggested by Algorithm.
Net Average: 400 pips in 30 minutes.
Join TELEGRAM channel for latest updates and market analysis:
Copy this url and paste in browser: https://bit.ly/AnalysisbyPR
#PiyushRatnu #BullionTrading #Trading #Dubai

Piyush Lalsingh Ratnu

The coordinated effort to lower energy prices: WHY?
Core bonds rose yesterday with USTs outperforming the Bund, shrugging off a tailed US 20y bond sale. The US yield curve bull flattened with changes ranging from -1.8 bps (2y) to -5.3 bps (30y). US housing starts disappointed in contrast to building permits, suggesting demand is solid but material and labour shortages weigh on construction. In addition, Brent oil prices fell towards the $80/b neckline after word got out that US President Biden wants the Federal Trade Commission to use all tools to examine fuel price wrongdoing.
Markets took it as another hint the US will eventually release some of the strategic oil reserves to ease prices. The oil price decline was a key driver for faltering inflation expectations (-3 to -4 bps) in the US. German yields closed flat on face value but real yields (10y) hit a new all-time low at -2.25% in underlying dynamics. This was the main reason for EUR/USD’s lackluster performance even though the greenback corrected in general.
Two stories feature Asian dealings this morning. Japanese stocks erase previous losses after newspaper Nikkei reported the new Japanese fiscal stimulus package would amount to 55.7tn yen compared to the 40tn previously estimated. Chances of government support being ramped up rose after Q3 GDP figures last week disappointed heavily. The yen loses out vs. USD and EUR. A survey by the RBNZ showing inflation expectations rose to a decade high spurred rate hike bets and lifts the kiwi dollar (cfr. infra). Core bonds and other dollar pairs trade flat.
Reuters reports that China is working on the release of crude oil reserves although the country’s National Food and Strategic Reserves Administration kept silence on the US’ request to disclose any details. The Biden administration is lobbying countries like China, India and Japan to consider releasing stockpiles in a coordinated effort to lower energy prices. My question is WHY>?:
The unusual request comes after OPEC+ on several occasions declined to meet Biden’s request to speed up production increases. Brent crude since yesterday fell from $82/barrel to just below $80/b. The latter serves as a technical neckline of a short term double top formation with targets near $74/b.
IMPACT on GOLD: OBVIOUSLY, YES!
Those who missed my analysis and past data records published by me earlier highlighting the co-relation between US Dollar Strength, Oil and GOLD as core factors.
GOLD
Gold price staged an impressive comeback on Wednesday and reversed 75% of Tuesday's sell-off, mainly helped by a sharp pullback in the US Treasury yields across the curve.
Discouraging US housing data also added to the greenback’s misery, as investors started to rethink the Fed’s rate hike expectations. The negative sentiment around Wall Street indices also helped the recovery in gold price.
This Thursday, gold price is holding onto the recent advance, biding time before initiating the next upswing. The weakness in the US dollar alongside the yields continues to underpin gold price. The risk-off trading in the Asian equities amid looming China’s property sector concerns and global inflation risks continue to boost’s gold appeal as a safe-haven as well as an inflation hedge.
The Fed speculation and inflation concerns will continue to play out, influencing the dynamics in the yields and gold price. Data-wise, the US weekly Jobless Claims will draw some attention amid a sparse docket and a slew of Fed speak.
Gold price is likely to trade in a familiar range between $1,845 and $1,866/1872 in the day, until the bulls find a strong foothold above the June 14 tops of $1,878 resulting in a rally to $1888/1907 price zone.
On the reversal side, a breach below 1832 can trigger the price to 1818/1777 zone once again.
BULL CROSS
The 100-Daily Moving Average (DMA) has pierced through the 200-DMA from below, representing a bull cross, adding credence to the bullish outlook on gold price.
YIELDS
Worries over the global economic recovery resurfaced, as investors fretted over the implications of earlier than previously thought monetary policy tightening to tackle the rearing inflation beast. The dour market mood ramped up the safe-haven flows into gold and the US Treasuries, weighing heavily on the yields.
Join TELEGRAM channel for latest updates and market analysis:
Copy this url and paste in browser: https://bit.ly/AnalysisbyPR

Piyush Lalsingh Ratnu
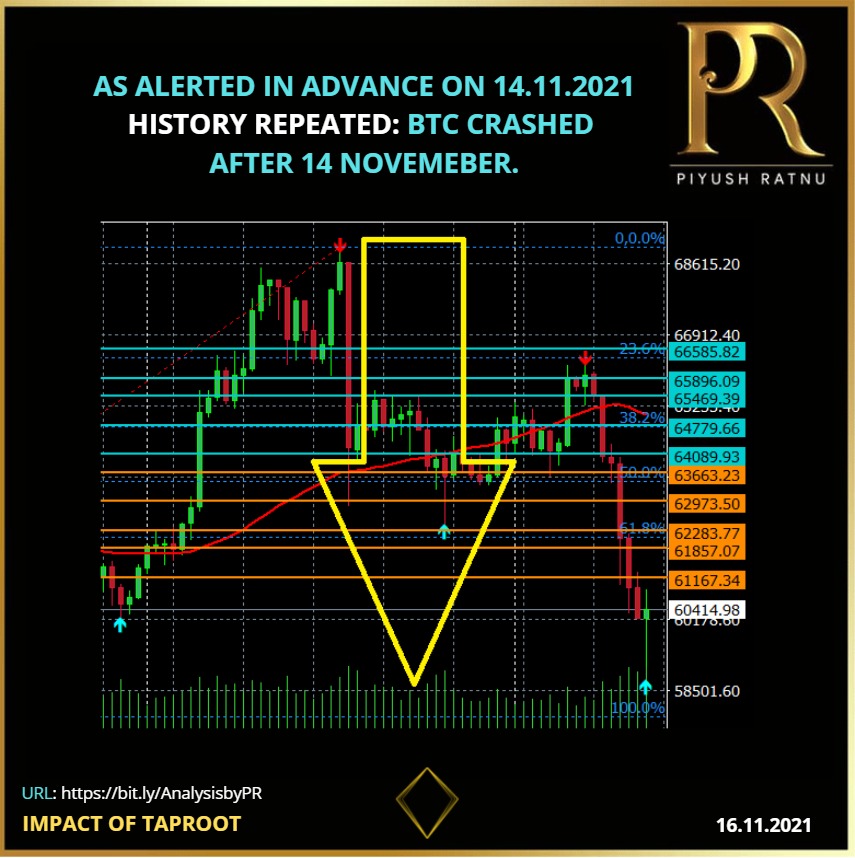
AS ALERTED IN ADVANCE ON 14.11.2021
HISTORY REPEATED: BTC CRASHED AFTER 14 NOVEMEBER.
Join TELEGRAM channel for latest updates and market analysis:
Copy this url and paste in browser: https://bit.ly/AnalysisbyPR
HISTORY REPEATED: BTC CRASHED AFTER 14 NOVEMEBER.
Join TELEGRAM channel for latest updates and market analysis:
Copy this url and paste in browser: https://bit.ly/AnalysisbyPR

Piyush Lalsingh Ratnu
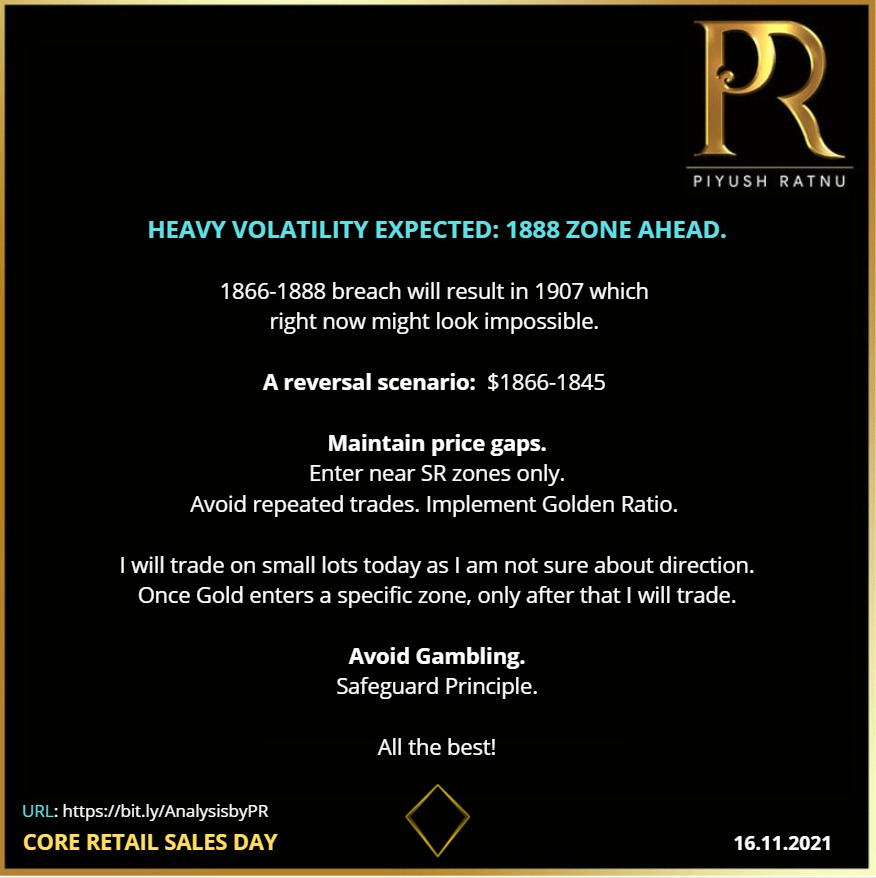
Heavy volatility expected: 1888 zone ahead.
1866-1888 breach will result in 1907 which
right now might look impossible.
A reversal scenario: $1866-1845
Maintain price gaps.
Enter near SR zones only.
Avoid repeated trades. Implement Golden Ratio.
I will trade on small lots today as I am not sure about direction.
Once Gold enters a specific zone, only after that I will trade.
Avoid Gambling.
Safeguard Principle.
All the best! Join TELEGRAM channel for latest updates and market analysis: Copy this url and paste in browser: https://bit.ly/AnalysisbyPR

Piyush Lalsingh Ratnu

Join TELEGRAM channel for latest updates and market analysis:
Copy this url and paste in browser: https://bit.ly/AnalysisbyPR
Copy this url and paste in browser: https://bit.ly/AnalysisbyPR

Piyush Lalsingh Ratnu
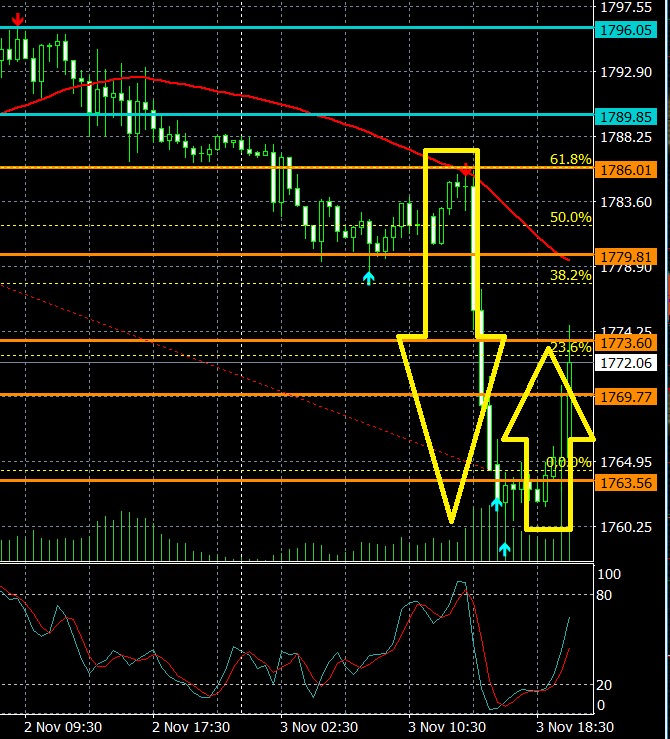
As published in Analysis.
Crash from 1796 to 1777 and 1758 achieved. RT achieved 23.6% on M30 chart | 38.2% on M15 | M15 SMA further | 50% RT achieved on M5.
Read my Analysis on GOLD published at 13.29 hours today:
https://bit.ly/Gold1818or1756
Crash from 1796 to 1777 and 1758 achieved. RT achieved 23.6% on M30 chart | 38.2% on M15 | M15 SMA further | 50% RT achieved on M5.
Read my Analysis on GOLD published at 13.29 hours today:
https://bit.ly/Gold1818or1756

Piyush Lalsingh Ratnu
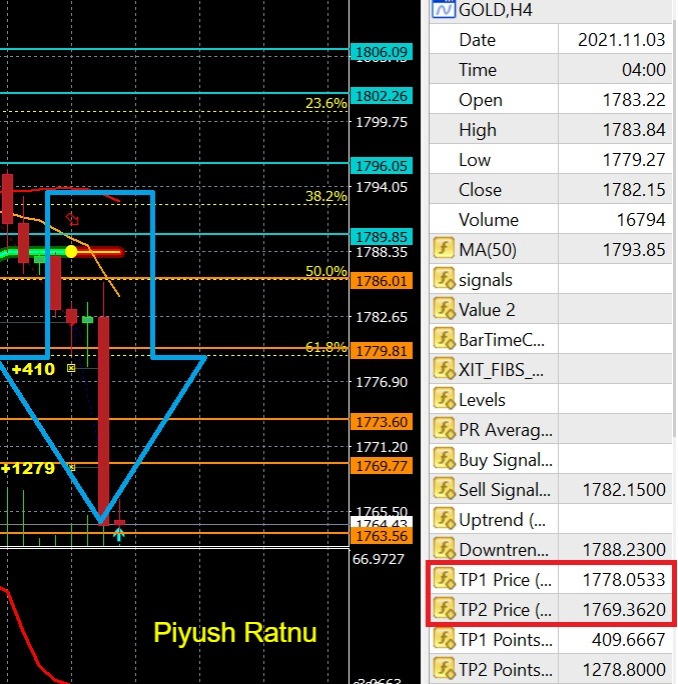
TARGET 1 and 2 achieved | GOLD | 03.11.2021 | Alert generated at 04.00 hours | Set: 323
Email at info@piyushratnu.com for more details, Analysis and LIVE Feed
CMP 1763
Email at info@piyushratnu.com for more details, Analysis and LIVE Feed
CMP 1763

Piyush Lalsingh Ratnu

Today Gold price achieved D1 SMA 50 (1778) after crashing from H4 SMA 50. 1756/1721 and 1808-1818/1832 levels are the next major Support and Resistance zone. Tapering related statements can push gold up or down $45-90. All three major equity indexes in the US hit new record highs on Tuesday, and GOLD once again made a failed attempt to achieve $1800 mark and crashed back from $1796 Resistance zone to $1778 Support zone today morning.
The FOMC meeting for November began yesterday and will conclude today. Most importantly, it will be the statement and following press conference by Chairman Powell that will draw the most attention. The statement will contain information about when the Federal Reserve will begin tapering their $120 billion monthly asset purchases. The press conference will clarify any ambiguities found within the statement itself.
It is highly believed that the Fed will announce the onset of tapering tomorrow. They have already defined that tapering will reduce asset purchases by $15 billion each month. The reduction will be composed of $10 billion of U.S. bonds and $5 billion of MBS. Since the Federal Reserve has been buying $80 billion each month of U.S. debt instruments, it will take a total of eight months to complete the tapering process.
That means that if they begin tapering in November, they will not complete the tapering process until June 2022. It is also important to note that they will not begin lift-off until they have completed tapering.
Worried foreign central banks boost gold reserves
After sitting on the side-lines for much of last year, central bank appetite for gold has resumed, in part due to inflationary pressures globally along with disruptions in the energy market.
Russia recently reached a milestone record for its gold reserves, now ranking fifth in the world for the size of its holdings. Russia now holds well over 20% of its reserves in gold! This represents nearly 2,300 tons of gold now held by the totalitarian nation, and that figure is likely to increase substantially in the years ahead.
Meanwhile, the central banks of Serbia, Hungary, Thailand, France, and Germany have added gold to their reserves in recent months. Brazil even bought 41.8 tons recently.
The heavy gold accumulation by central banks points to an ongoing shift away from the Federal Reserve Note “dollar” as the global reserve currency of choice and points to the ongoing shift in global economic dynamics.
The decline and fall of the U.S. dollar as a world reserve currency could mark a key turning point in financial history. Fiat currencies and the debt instruments denominated in them may fall in tandem. Investments in precious metals stand to rise.
Today is FED interest rate announcement and FOMC. In addition, this Friday NFP and Unemployment rate will be published, which brings another huge volatility in Gold price. This week is crucial and retail traders might lose their principle amount if they are stuck in wrong direction.
Analysing Relevant Data plays a crucial role in decision making during such highly volatile economic events:
Observe Resistance & Support zones
Observe Fibonacci Retracement zones
Observe Session shifts
Observe Dollar Index
Observe US10YT – US 10 Year Yield
Observe XAUXAG Ratio
Observe USDJPY price
Observe Yen strength
Observe US Dollar strength
Observe COT on Spot GOLD
Gold council report regarding Supply and Demand stats of Gold
Observe Chairman Powell’s statement
Observe US Monetary Policy
The next big day for the high volatility action in GOLD will be NFP Day:
NFP on 05 November, 2021
Participation rate on 05 November, 2021
Unemployment rate on 05 November, 2021
Resistance zone:
1789 | 1796 (1796 zone) | 1802 - 1806 (1808 zone) | 1812 (1818 zone)
Support zone:
1786 – 1779 - 1773 (1777 zone) | 1769 - 1763
As per past data:
Resistance zone:
1808/1818/1832/1866/1888
Support zone:
1777/1735/1717/1685
SOC Parameters:
H1 Over Sold
H4 Over Sold
D1 at 45.0
RISE above 1796: 23.6% FIB level + H4 SMA zone + Resistance 2: a strong zone of retracement before the further rise to 1808-1818 price levels.
CRASH till 1750: 1763 Last support level + 61.8% at 1756: a strong zone of retracement before the further crash to 1721 – 1717 price levels.
SMA 50 Levels:
M30: $ 1787.00
H1: $ 1788.78
H4: $1793.65
D1: $ 1780.45
All the above data needs to be observed carefully to derive co-relation and trace the further movement of Gold in this and next week. The first and second week in November has always proved itself as a choppy week. Last year too due to elections, Gold crashed in first and second week more than $100.
This week is unique in it’s own way since FED interest rate day, FOMC and NFP – all three economic events of utmost importance are scheduled this week. The only certainty about today's FOMC conclusion is that we will see increased volatility as market participants attempt to read between the lines of the Federal Reserve statement and chairman Powell's press conference.
I wish you ALL THE BEST for today!
WARNING: Information on these pages contains forward-looking statements that involve risks and uncertainties. Markets and instruments profiled on this page are for informational purposes only and should not in any way come across as a recommendation to buy or sell in these assets. You should do your own thorough research before making any investment decisions. Piyush Ratnu does not in any way guarantee that this information is free from mistakes, errors, or material misstatements. It also does not guarantee that this information is of a timely nature. Investing in Open Markets involves a great deal of risk, including the loss of all or a portion of your investment, as well as emotional distress. All risks, losses and costs associated with investing, including total loss of principal, are your responsibility. The author will not be held responsible for information that is found at the end of links posted on this page. The author do not provide personalized recommendations. The author makes no representations as to the accuracy, completeness, or suitability of this information. The author will not be liable for any errors, omissions or any losses, injuries or damages arising from this information and its display or use. The author is not a registered investment advisor and nothing in this article is intended to be investment advice.

: