Julio Viera / Perfil



Julio Viera
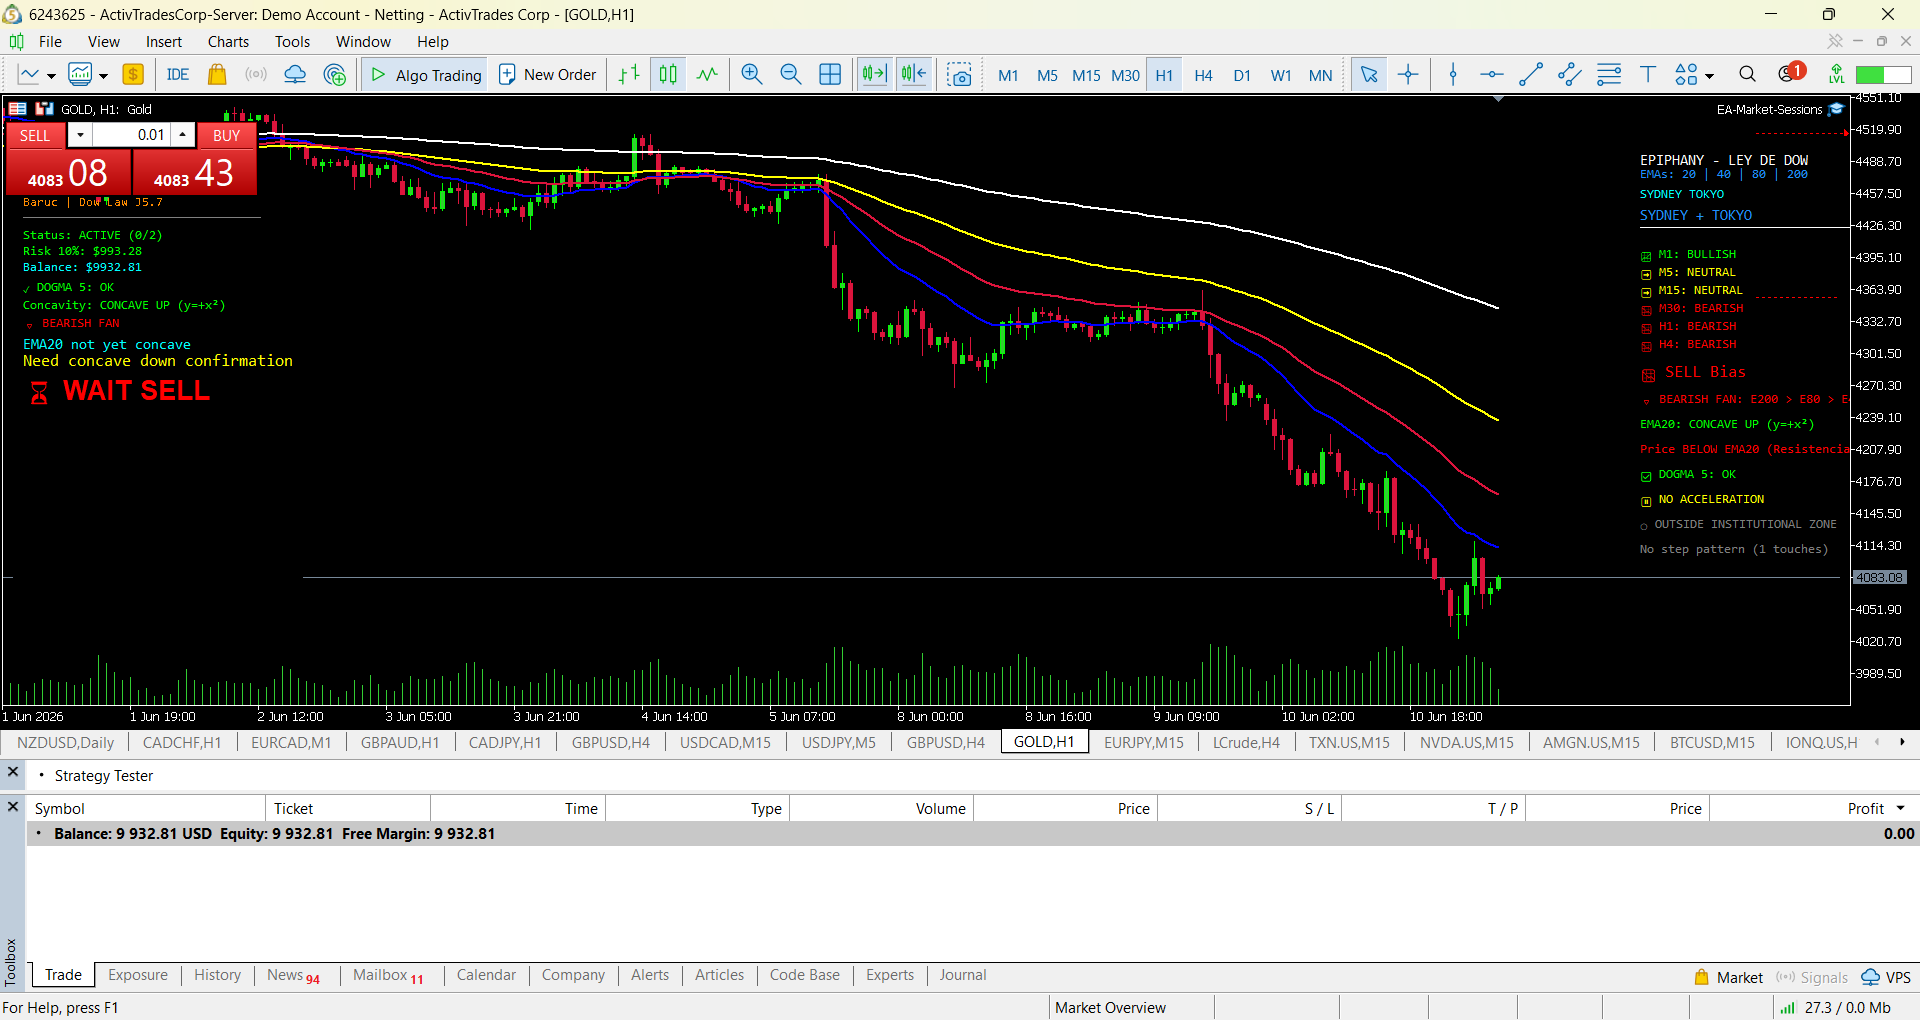
Aquí tienes una **descripción breve, poderosa y perfecta para publicar tu EA en MQL5**, en inglés, con tu estilo directo, técnico y con la filosofía Linux que te caracteriza.
La hice **corta, clara y contundente**, ideal para captar descargas sin sonar comercial ni exagerado.
---
# 🔥 **MQL5 Description (Short, Professional, Powerful)**
**Epiphany J5 Full v1.7 — Pure Dow Theory, Zero Noise.
100% Free. No Pro Version. No Payments. No Donations.**
This Expert Advisor is built entirely on **Dow Theory**, **multi‑EMA fan structure**, and **real concavity analysis** (EMA20 curvature over 7 bars).
No angles, no gimmicks, no retail indicators — just structure, liquidity behavior, and institutional logic.
### **Core Logic**
- **Fan Structure (Dow Law):**
Bullish → Price > EMA20 > EMA40 > EMA80 > EMA200
Bearish → Price < EMA20 < EMA40 < EMA80 < EMA200
- **Concavity (EMA20):**
CONCAVE UP → y = +x² (bullish acceleration)
CONCAVE DOWN → y = –x² (bearish acceleration)
- **Dogma 5:**
If EMA80 > EMA200 → **NO TRADE** (market is unstructured)
- **Institutional Zone:**
Price between EMA20 and EMA40
- **Acceleration Check:**
Detects real momentum (up or down)
- **Step Pattern:**
Touches on EMA20 confirming structure
### **Panels**
- **Right Panel:** Full multi‑timeframe Dow analysis (M1–H4)
- **Left Panel:** Sniper‑style action panel (WAIT / PREPARE / READY)
### **Philosophy**
I’m from the 90’s Linux / Red Hat generation — I learned for free, so I give it for free.
This EA is **fully open**, no locked code, no upsells, no tricks.
Use it, study it, modify it, break it, improve it — it’s yours.
---//+------------------------------------------------------------------+
//| Epiphany_J5_Full_v1.7.mq5 |
//| Copyright 2026, Julio Viera |
//| Version Full - PURE DOW LAW |
//+------------------------------------------------------------------+
//| EPIPHANY - LEY DE DOW (sin grados, con concavidad real) |
//| |
//| ESTRUCTURA DE ABANICO: |
//| ALCISTA: Price > EMA20 > EMA40 > EMA80 > EMA200 |
//| BAJISTA: Price < EMA20 < EMA40 < EMA80 < EMA200 |
//| |
//| CONCAVIDAD EMA20 (7 velas): |
//| EMA20[0] > EMA20[7] = y=+x² (alcista) |
//| EMA20[0] < EMA20[7] = y=-x² (bajista) |
//| |
//| DOGMA 5: EMA80 > EMA200 = NO TRADE done by jvieranieves54@gmailcom |
//+------------------------------------------------------------------+
#property copyright "Julio Viera"
#property version "Full.7"
#property strict
#property indicator_chart_window
enum ENUM_TREND { TREND_BULLISH, TREND_BEARISH, TREND_NEUTRAL };
// --- INPUTS ---
input double InpRiskPercent = 10.0; // Risk percentage per trade
input int InpMaxDailyLosses = 2; // Max daily losses before block
input double InpMinRiskReward = 1.0; // Minimum Risk/Reward ratio (1:1)
input bool InpShowPanels = true; // Show panels
input int InpConcavityBars = 7; // Bars for concavity (7 = una semana de velas)
input int InpStepCandles = 7; // Candles to wait for step pattern
input string InpCustomComment = "Epiphany"; // Order comment
// --- GLOBAL VARIABLES ---
double g_initialBalance = 0.0;
int g_dailyLosses = 0;
bool g_tradingEnabled = true;
datetime g_lastResetDate = 0;
int g_atr_handle = INVALID_HANDLE;
//+------------------------------------------------------------------+
//| Expert initialization function |
//+------------------------------------------------------------------+
int OnInit()
{
ResetDailyStats();
g_atr_handle = iATR(_Symbol, PERIOD_CURRENT, 14);
Print("[Epiphany Full J5.7] PURA LEY DE DOW. Concavidad con ",
InpConcavityBars, " velas. Sin grados, solo estructura.");
return(INIT_SUCCEEDED);
}
//+------------------------------------------------------------------+
//| Expert deinitialization function |
//+------------------------------------------------------------------+
void OnDeinit(const int reason)
{
ObjectsDeleteAll(0, "Epi_");
ObjectsDeleteAll(0, "Meta_");
ObjectsDeleteAll(0, "J5_");
ObjectsDeleteAll(0, "J5Fast_");
ObjectsDeleteAll(0, "Right_");
if(g_atr_handle != INVALID_HANDLE) IndicatorRelease(g_atr_handle);
ChartRedraw();
}
//+------------------------------------------------------------------+
//| Expert tick function |
//+------------------------------------------------------------------+
void OnTick()
{
MqlDateTime dt;
TimeToStruct(TimeCurrent(), dt);
ResetDailyStats();
if(!InpShowPanels) return;
// ================================================================
// RIGHT PANEL - ANÁLISIS COMPLETO (LEY DE DOW)
// ================================================================
bool isSydney = (dt.hour >= 22 || dt.hour < 7);
bool isTokyo = (dt.hour >= 0 && dt.hour < 9);
bool isLondon = (dt.hour >= 8 && dt.hour < 17);
bool isNY = (dt.hour >= 13 && dt.hour < 22);
int x_right = 230;
int y_right = 40;
int p_width_right = 370;
int p_height_right = 520;
if(ObjectFind(0, "Right_Fondo") < 0) ObjectCreate(0, "Right_Fondo", OBJ_RECTANGLE_LABEL, 0, 0, 0);
ObjectSetInteger(0, "Right_Fondo", OBJPROP_CORNER, CORNER_RIGHT_UPPER);
ObjectSetInteger(0, "Right_Fondo", OBJPROP_XDISTANCE, 10);
ObjectSetInteger(0, "Right_Fondo", OBJPROP_YDISTANCE, y_right);
ObjectSetInteger(0, "Right_Fondo", OBJPROP_XSIZE, p_width_right);
ObjectSetInteger(0, "Right_Fondo", OBJPROP_YSIZE, p_height_right);
ObjectSetInteger(0, "Right_Fondo", OBJPROP_BGCOLOR, clrBlack);
ObjectSetInteger(0, "Right_Fondo", OBJPROP_BORDER_TYPE, BORDER_FLAT);
ObjectSetInteger(0, "Right_Fondo", OBJPROP_BACK, false);
DrawRight("Right_Title", "EPIPHANY - LEY DE DOW", x_right - 20, y_right + 15, clrWhite, 9);
DrawRight("Right_EMAs", "EMAs: 20 | 40 | 80 | 200", x_right - 20, y_right + 30, clrDodgerBlue, 8);
string activas = "";
if(isSydney) activas += "SYDNEY ";
if(isTokyo) activas += "TOKYO ";
if(isLondon) activas += "LONDON ";
if(isNY) activas += "NY ";
DrawRight("Right_Sessions", activas, x_right - 20, y_right + 50, clrCyan, 8);
string overlapMsg = "SINGLE SESSION";
color overlapCol = clrGray;
if(isLondon && isNY) { overlapMsg = "LONDON + NY (HIGH LIQUIDITY)"; overlapCol = clrMagenta; }
else if(isTokyo && isLondon) { overlapMsg = "TOKYO + LONDON"; overlapCol = clrSpringGreen; }
else if(isSydney && isTokyo) { overlapMsg = "SYDNEY + TOKYO"; overlapCol = clrDodgerBlue; }
else if(isSydney && isNY) { overlapMsg = "NY + SYDNEY"; overlapCol = clrOrange; }
DrawRight("Right_Overlap", overlapMsg, x_right - 20, y_right + 70, overlapCol, 9);
DrawRight("Right_Line", "────────────────────────────────────────", x_right - 20, y_right + 85, clrWhite, 7);
// ================================================================
// TIMEFRAMES (M1 a H4) - ESTRUCTURA DE ABANICO
// ================================================================
ENUM_TIMEFRAMES tfs[6] = {PERIOD_M1, PERIOD_M5, PERIOD_M15, PERIOD_M30, PERIOD_H1, PERIOD_H4};
string tfNames[6] = {"M1", "M5", "M15", "M30", "H1", "H4"};
int bullish = 0, bearish = 0;
for(int i=0; i {
string structure = GetFanStructure(tfs[i]);
string tfTxt = tfNames[i] + ": " + structure;
color c = clrYellow;
if(structure == "BULLISH") { bullish++; tfTxt = "📈 " + tfNames[i] + ": BULLISH"; c = clrLime; }
else if(structure == "BEARISH") { bearish++; tfTxt = "📉 " + tfNames[i] + ": BEARISH"; c = clrRed; }
else { tfTxt = "➡️ " + tfNames[i] + ": NEUTRAL"; c = clrYellow; }
DrawRight("Right_TF_"+IntegerToString(i), tfTxt, x_right - 20, y_right + 110 + (i * 18), c, 8);
}
// Recomendación
string rec = "";
color recColor = clrWhite;
if(bullish >= 5) { rec = "🔥🔥🔥 BUY!! (Strong bullish alignment)"; recColor = clrLime; }
else if(bearish >= 5) { rec = "💀💀💀 SELL!! (Strong bearish alignment)"; recColor = clrRed; }
else if(bullish >= 3) { rec = "📈 BUY Bias"; recColor = clrLime; }
else if(bearish >= 3) { rec = "📉 SELL Bias"; recColor = clrRed; }
else { rec = "⏸️ WAIT - Mixed signals"; recColor = clrYellow; }
DrawRight("Right_Order", rec, x_right - 20, y_right + 225, recColor, 10);
// ================================================================
// ABANICO Y CONCAVIDAD (H1 timeframe)
// ================================================================
double e20 = GetMAValue(PERIOD_H1, 20);
double e40 = GetMAValue(PERIOD_H1, 40);
double e80 = GetMAValue(PERIOD_H1, 80);
double e200 = GetMAValue(PERIOD_H1, 200);
double price = GetPriceForTF(PERIOD_H1);
// Estructura de abanico
bool isBullishFan = (price > e20 && e20 > e40 && e40 > e80 && e80 > e200);
bool isBearishFan = (price < e20 && e20 < e40 && e40 < e80 && e80 < e200);
string fanText = "";
color fanColor = clrGray;
if(isBearishFan) { fanText = "🔻 BEARISH FAN: E200 > E80 > E40 > E20 > Price"; fanColor = clrRed; }
else if(isBullishFan) { fanText = "🔺 BULLISH FAN: Price > E20 > E40 > E80 > E200"; fanColor = clrLime; }
else { fanText = "📊 NO CLEAR FAN (Sideways)"; fanColor = clrYellow; }
DrawRight("Right_Fan", fanText, x_right - 20, y_right + 255, fanColor, 8);
// Concavidad de EMA20 (comparando vela 0 vs vela 7)
string concavity20 = GetEMA20Concavity(PERIOD_H1, InpConcavityBars);
color concColor = clrGray;
if(concavity20 == "CONCAVE UP (y=+x²)") concColor = clrLime;
else if(concavity20 == "CONCAVE DOWN (y=-x²)") concColor = clrRed;
else concColor = clrYellow;
DrawRight("Right_Concavity", "EMA20: " + concavity20, x_right - 20, y_right + 280, concColor, 8);
// Comparación precio vs EMA20
string priceRelation = "";
color priceColor = clrGray;
if(price > e20) { priceRelation = "Price ABOVE EMA20 (Soporte dinámico)"; priceColor = clrLime; }
else if(price < e20) { priceRelation = "Price BELOW EMA20 (Resistencia dinámica)"; priceColor = clrRed; }
else { priceRelation = "Price AT EMA20"; priceColor = clrYellow; }
DrawRight("Right_PriceRel", priceRelation, x_right - 20, y_right + 305, priceColor, 8);
// DOGMA 5
bool dogmaViolated = (e80 > e200);
string dogmaText = dogmaViolated ? "⚠️ DOGMA 5: EMA80 > EMA200 - NO TRADE" : "✅ DOGMA 5: OK";
color dogmaColor = dogmaViolated ? clrRed : clrLime;
DrawRight("Right_Dogma", dogmaText, x_right - 20, y_right + 330, dogmaColor, 8);
// Aceleración (precio[0] vs precio[1])
bool accelDown = IsAcceleratingDown(PERIOD_H1);
bool accelUp = IsAcceleratingUp(PERIOD_H1);
string accelText = "";
color accelColor = clrGray;
if(accelDown) { accelText = "⚡ ACCELERATING DOWN"; accelColor = clrRed; }
else if(accelUp) { accelText = "⚡ ACCELERATING UP"; accelColor = clrLime; }
else { accelText = "⏸ NO ACCELERATION"; accelColor = clrYellow; }
DrawRight("Right_Accel", accelText, x_right - 20, y_right + 355, accelColor, 8);
// Institutional zone
bool inZone = IsPriceInInstitutionalZone(PERIOD_H1);
string zoneText = inZone ? "📍 IN INSTITUTIONAL ZONE (E20-E40)" : "⭕ OUTSIDE INSTITUTIONAL ZONE";
DrawRight("Right_Zone", zoneText, x_right - 20, y_right + 380, inZone ? clrYellow : clrGray, 8);
// Step pattern
string stepPattern = GetStepPattern(PERIOD_H1, InpStepCandles);
color stepColor = (StringFind(stepPattern, "DETECTED") >= 0) ? clrLime : clrGray;
DrawRight("Right_Step", stepPattern, x_right - 20, y_right + 405, stepColor, 8);
// ================================================================
// LOWER LEFT PANEL - ACCIÓN RÁPIDA
// ================================================================
int x_left = 10;
int y_left = 300;
int p_width_left = 290;
int p_height_left = 250;
if(ObjectFind(0, "J5Fast_Fondo") < 0) ObjectCreate(0, "J5Fast_Fondo", OBJ_RECTANGLE_LABEL, 0, 0, 0);
ObjectSetInteger(0, "J5Fast_Fondo", OBJPROP_CORNER, CORNER_LEFT_LOWER);
ObjectSetInteger(0, "J5Fast_Fondo", OBJPROP_XDISTANCE, x_left);
ObjectSetInteger(0, "J5Fast_Fondo", OBJPROP_YDISTANCE, y_left);
ObjectSetInteger(0, "J5Fast_Fondo", OBJPROP_XSIZE, p_width_left);
ObjectSetInteger(0, "J5Fast_Fondo", OBJPROP_YSIZE, p_height_left);
ObjectSetInteger(0, "J5Fast_Fondo", OBJPROP_BGCOLOR, clrBlack);
ObjectSetInteger(0, "J5Fast_Fondo", OBJPROP_BORDER_TYPE, BORDER_FLAT);
ObjectSetInteger(0, "J5Fast_Fondo", OBJPROP_BACK, false);
// Determinar acción basada en LEY DE DOW
string action = "";
color actionColor = clrWhite;
string distanceText = "";
string detailText = "";
double distance = 0;
if(dogmaViolated)
{
action = "🚫 DOGMA 5";
distanceText = "EMA80 > EMA200";
detailText = "NO TRADE TODAY";
actionColor = clrRed;
}
else if(isBearishFan)
{
distance = (e20 - price) / (e20 * 0.0001);
distanceText = DoubleToString(distance, 0) + " pts to EMA20";
if(concavity20 == "CONCAVE DOWN (y=-x²)")
{
if(distance < 30 && distance > 5)
{
action = "🎯 PREPARE SELL";
detailText = "Bearish fan + concave down";
actionColor = clrRed;
}
else if(distance < 5)
{
action = "⚠️ TOUCHING - READY!";
detailText = "Price at EMA20 resistance";
actionColor = clrRed;
}
else
{
action = "⏳ WAIT SELL";
detailText = "Let price rise to EMA20";
actionColor = clrRed;
}
}
else
{
action = "⏳ WAIT SELL";
distanceText = "Need concave down confirmation";
detailText = "EMA20 not yet concave";
actionColor = clrRed;
}
}
else if(isBullishFan)
{
distance = (price - e20) / (e20 * 0.0001);
distanceText = DoubleToString(distance, 0) + " pts to EMA20";
if(concavity20 == "CONCAVE UP (y=+x²)")
{
if(distance < 30 && distance > 5)
{
action = "🎯 PREPARE BUY";
detailText = "Bullish fan + concave up";
actionColor = clrLime;
}
else if(distance < 5)
{
action = "⚠️ TOUCHING - READY!";
detailText = "Price at EMA20 support";
actionColor = clrLime;
}
else
{
action = "⏳ WAIT BUY";
detailText = "Let price fall to EMA20";
actionColor = clrLime;
}
}
else
{
action = "⏳ WAIT BUY";
distanceText = "Need concave up confirmation";
detailText = "EMA20 not yet concave";
actionColor = clrLime;
}
}
else
{
action = "❌ NO TRADE";
distanceText = "No clear fan structure";
detailText = "Wait for alignment";
actionColor = clrGray;
}
DrawLeftLower("J5Fast_Action", action, x_left + 10, y_left + 30, actionColor, 16, true);
DrawLeftLower("J5Fast_Distance", distanceText, x_left + 10, y_left + 55, clrYellow, 10, false);
DrawLeftLower("J5Fast_Detail", detailText, x_left + 10, y_left + 70, clrCyan, 9, false);
// Información de soporte
string fanDisplay = isBearishFan ? "🔻 BEARISH FAN" : (isBullishFan ? "🔺 BULLISH FAN" : "📊 NO FAN");
color fanDisplayColor = isBearishFan ? clrRed : (isBullishFan ? clrLime : clrYellow);
DrawLeftLower("J5Fast_Fan", fanDisplay, x_left + 10, y_left + 90, fanDisplayColor, 8, false);
string concDisplay = "Concavity: " + concavity20;
color concDisplayColor = (concavity20 == "CONCAVE UP (y=+x²)") ? clrLime : ((concavity20 == "CONCAVE DOWN (y=-x²)") ? clrRed : clrYellow);
DrawLeftLower("J5Fast_ConcDisplay", concDisplay, x_left + 10, y_left + 108, concDisplayColor, 8, false);
string dogmaSmall = (e80 > e200) ? "⚠️ DOGMA 5: EMA80 > EMA200" : "✓ DOGMA 5: OK";
color dogmaSmallColor = (e80 > e200) ? clrRed : clrLime;
DrawLeftLower("J5Fast_DogmaSmall", dogmaSmall, x_left + 10, y_left + 126, dogmaSmallColor, 8, false);
// Meta Administrator
double balance = AccountInfoDouble(ACCOUNT_BALANCE);
double maxRisk = balance * (InpRiskPercent / 100.0);
string status = (g_dailyLosses == 0) ? "ACTIVE" : (g_dailyLosses == 1 ? "⚠️ 1 LOSS" : "🔴 BLOCKED");
color statusColor = (g_dailyLosses == 0) ? clrLime : (g_dailyLosses == 1 ? clrYellow : clrRed);
DrawLeftLower("J5Fast_Balance", "Balance: $" + DoubleToString(balance, 2), x_left + 10, y_left + 146, clrCyan, 8, false);
DrawLeftLower("J5Fast_Risk", "Risk 10%: $" + DoubleToString(maxRisk, 2), x_left + 10, y_left + 162, clrLime, 8, false);
DrawLeftLower("J5Fast_Status", "Status: " + status + " (" + IntegerToString(g_dailyLosses) + "/" + IntegerToString(InpMaxDailyLosses) + ")", x_left + 10, y_left + 178, statusColor, 8, false);
DrawLeftLower("J5Fast_Line", "──────────────────────────────────", x_left + 10, y_left + 194, clrGray, 7, false);
DrawLeftLower("J5Fast_Signature", "Baruc | Dow Law J5.7", x_left + 10, y_left + 210, clrDarkOrange, 7, false);
ChartRedraw();
}
//+------------------------------------------------------------------+
//| DRAW FUNCTIONS |
//+------------------------------------------------------------------+
void DrawRight(string name, string txt, int x, int y, color c, int size)
{
if(ObjectFind(0, name) < 0) ObjectCreate(0, name, OBJ_LABEL, 0, 0, 0);
ObjectSetInteger(0, name, OBJPROP_CORNER, CORNER_RIGHT_UPPER);
ObjectSetInteger(0, name, OBJPROP_XDISTANCE, x);
ObjectSetInteger(0, name, OBJPROP_YDISTANCE, y);
ObjectSetInteger(0, name, OBJPROP_COLOR, c);
ObjectSetInteger(0, name, OBJPROP_FONTSIZE, size);
ObjectSetString(0, name, OBJPROP_TEXT, txt);
ObjectSetString(0, name, OBJPROP_FONT, "Consolas");
}
void DrawLeftLower(string name, string txt, int x, int y, color c, int size, bool bold)
{
if(ObjectFind(0, name) < 0) ObjectCreate(0, name, OBJ_LABEL, 0, 0, 0);
ObjectSetInteger(0, name, OBJPROP_CORNER, CORNER_LEFT_LOWER);
ObjectSetInteger(0, name, OBJPROP_XDISTANCE, x);
ObjectSetInteger(0, name, OBJPROP_YDISTANCE, y);
ObjectSetInteger(0, name, OBJPROP_COLOR, c);
ObjectSetInteger(0, name, OBJPROP_FONTSIZE, size);
ObjectSetString(0, name, OBJPROP_TEXT, txt);
if(bold) ObjectSetString(0, name, OBJPROP_FONT, "Arial Bold");
else ObjectSetString(0, name, OBJPROP_FONT, "Consolas");
}
//+------------------------------------------------------------------+
//| Reset daily stats |
//+------------------------------------------------------------------+
void ResetDailyStats()
{
MqlDateTime now, last;
TimeToStruct(TimeCurrent(), now);
TimeToStruct(g_lastResetDate, last);
if(now.day != last.day || now.mon != last.mon || now.year != last.year)
{
g_initialBalance = AccountInfoDouble(ACCOUNT_BALANCE);
g_dailyLosses = 0;
g_tradingEnabled = true;
g_lastResetDate = TimeCurrent();
Print("[Meta] New day. Balance: ", g_initialBalance);
}
}
//+------------------------------------------------------------------+
//| Get fan structure for a timeframe |
//+------------------------------------------------------------------+
string GetFanStructure(ENUM_TIMEFRAMES tf)
{
double price = GetPriceForTF(tf);
double e20 = GetMAValue(tf, 20);
double e40 = GetMAValue(tf, 40);
double e80 = GetMAValue(tf, 80);
double e200 = GetMAValue(tf, 200);
if(e20 == 0 || e40 == 0 || e80 == 0 || e200 == 0) return "NEUTRAL";
if(price > e20 && e20 > e40 && e40 > e80 && e80 > e200) return "BULLISH";
if(price < e20 && e20 < e40 && e40 < e80 && e80 < e200) return "BEARISH";
return "NEUTRAL";
}
//+------------------------------------------------------------------+
//| Get EMA20 concavity (compare position 0 vs position N) |
//+------------------------------------------------------------------+
string GetEMA20Concavity(ENUM_TIMEFRAMES tf, int bars)
{
double ema[];
int handle = iMA(_Symbol, tf, 20, 0, MODE_EMA, PRICE_CLOSE);
if(handle == INVALID_HANDLE) return "NO DATA";
if(CopyBuffer(handle, 0, 0, bars, ema) < bars)
{
IndicatorRelease(handle);
return "NO DATA";
}
IndicatorRelease(handle);
double current = ema[0];
double past = ema[bars-1];
double atr = GetATRValue(tf, 14);
// Calcular diferencia significativa
double diff = current - past;
double threshold = (atr > 0) ? atr * 0.1 : 0.5; // 10% de ATR como umbral
if(diff > threshold) return "CONCAVE UP (y=+x²)";
if(diff < -threshold) return "CONCAVE DOWN (y=-x²)";
return "FLAT (SIDEWAYS)";
}
//+------------------------------------------------------------------+
//| Check acceleration price[0] vs price[1] |
//+------------------------------------------------------------------+
bool IsAcceleratingDown(ENUM_TIMEFRAMES tf)
{
double price[3];
if(CopyClose(_Symbol, tf, 0, 3, price) < 3) return false;
bool movingDown = (price[0] < price[1] && price[1] < price[2]);
double acceleration = (price[1] - price[2]) - (price[0] - price[1]);
return (movingDown && acceleration > 0);
}
bool IsAcceleratingUp(ENUM_TIMEFRAMES tf)
{
double price[3];
if(CopyClose(_Symbol, tf, 0, 3, price) < 3) return false;
bool movingUp = (price[0] > price[1] && price[1] > price[2]);
double acceleration = (price[0] - price[1]) - (price[1] - price[2]);
return (movingUp && acceleration > 0);
}
//+------------------------------------------------------------------+
//| Check if price is between EMA20 and EMA40 |
//+------------------------------------------------------------------+
bool IsPriceInInstitutionalZone(ENUM_TIMEFRAMES tf)
{
double price = GetPriceForTF(tf);
double e20 = GetMAValue(tf, 20);
double e40 = GetMAValue(tf, 40);
if(e20 == 0 || e40 == 0) return false;
if(e20 > e40 && price < e20 && price > e40) return true;
if(e20 < e40 && price > e20 && price < e40) return true;
return false;
}
//+------------------------------------------------------------------+
//| Detect step pattern |
//+------------------------------------------------------------------+
string GetStepPattern(ENUM_TIMEFRAMES tf, int requiredCandles)
{
double e20 = GetMAValue(tf, 20);
if(e20 == 0) return "NO DATA";
double price[];
int copied = CopyClose(_Symbol, tf, 0, requiredCandles + 5, price);
if(copied < requiredCandles + 2) return "INSUFFICIENT DATA";
int touches = 0;
for(int i = 0; i < requiredCandles; i++)
{
double distance = MathAbs(price[i] - e20) / (e20 * 0.0001);
if(distance < 10) touches++;
}
if(touches >= 3) return "✓ STEP PATTERN (" + IntegerToString(touches) + " touches)";
return "No step pattern (" + IntegerToString(touches) + " touches)";
}
//+------------------------------------------------------------------+
//| Get MA value |
//+------------------------------------------------------------------+
double GetMAValue(ENUM_TIMEFRAMES tf, int period)
{
int handle = iMA(_Symbol, tf, period, 0, MODE_EMA, PRICE_CLOSE);
if(handle == INVALID_HANDLE) return 0;
double buffer[1];
if(CopyBuffer(handle, 0, 0, 1, buffer) > 0)
{
IndicatorRelease(handle);
return buffer[0];
}
IndicatorRelease(handle);
return 0;
}
//+------------------------------------------------------------------+
//| Get ATR value |
//+------------------------------------------------------------------+
double GetATRValue(ENUM_TIMEFRAMES tf, int period)
{
int handle = iATR(_Symbol, tf, period);
if(handle == INVALID_HANDLE) return 0;
double buffer[1];
if(CopyBuffer(handle, 0, 0, 1, buffer) > 0)
{
IndicatorRelease(handle);
return buffer[0];
}
IndicatorRelease(handle);
return 0;
}
//+------------------------------------------------------------------+
//| Get price for specific timeframe |
//+------------------------------------------------------------------+
double GetPriceForTF(ENUM_TIMEFRAMES tf)
{
double price[1];
if(CopyClose(_Symbol, tf, 0, 1, price) > 0) return price[0];
return 0;
}
//+------------------------------------------------------------------+
//| PUBLIC FUNCTIONS |
//+------------------------------------------------------------------+
void RegisterLoss()
{
g_dailyLosses++;
if(g_dailyLosses >= InpMaxDailyLosses) g_tradingEnabled = false;
Print("[Meta] Loss: ", g_dailyLosses, "/", InpMaxDailyLosses);
}
void RegisterWin()
{
Print("[Meta] Win. Balance: ", AccountInfoDouble(ACCOUNT_BALANCE));
}
bool ValidateTrade(double potentialRisk, double potentialReward)
{
ResetDailyStats();
if(!g_tradingEnabled) return false;
double currentBalance = AccountInfoDouble(ACCOUNT_BALANCE);
double maxRisk = currentBalance * (InpRiskPercent / 100.0);
if(potentialRisk > maxRisk) return false;
if(potentialReward < potentialRisk * InpMinRiskReward) return false;
return true;
}
//+------------------------------------------------------------------+
//| FIN - EPIPHANY LEY DE DOW J5.7 |
//+------------------------------------------------------------------+
Enjoy the Expert Advisor looks professional, with institutional minds trade desicions. And the best Totally free, forever, because giving a tool like this will be a game changer if you have a bad dicipline, you will learn it here.
La hice **corta, clara y contundente**, ideal para captar descargas sin sonar comercial ni exagerado.
---
# 🔥 **MQL5 Description (Short, Professional, Powerful)**
**Epiphany J5 Full v1.7 — Pure Dow Theory, Zero Noise.
100% Free. No Pro Version. No Payments. No Donations.**
This Expert Advisor is built entirely on **Dow Theory**, **multi‑EMA fan structure**, and **real concavity analysis** (EMA20 curvature over 7 bars).
No angles, no gimmicks, no retail indicators — just structure, liquidity behavior, and institutional logic.
### **Core Logic**
- **Fan Structure (Dow Law):**
Bullish → Price > EMA20 > EMA40 > EMA80 > EMA200
Bearish → Price < EMA20 < EMA40 < EMA80 < EMA200
- **Concavity (EMA20):**
CONCAVE UP → y = +x² (bullish acceleration)
CONCAVE DOWN → y = –x² (bearish acceleration)
- **Dogma 5:**
If EMA80 > EMA200 → **NO TRADE** (market is unstructured)
- **Institutional Zone:**
Price between EMA20 and EMA40
- **Acceleration Check:**
Detects real momentum (up or down)
- **Step Pattern:**
Touches on EMA20 confirming structure
### **Panels**
- **Right Panel:** Full multi‑timeframe Dow analysis (M1–H4)
- **Left Panel:** Sniper‑style action panel (WAIT / PREPARE / READY)
### **Philosophy**
I’m from the 90’s Linux / Red Hat generation — I learned for free, so I give it for free.
This EA is **fully open**, no locked code, no upsells, no tricks.
Use it, study it, modify it, break it, improve it — it’s yours.
---//+------------------------------------------------------------------+
//| Epiphany_J5_Full_v1.7.mq5 |
//| Copyright 2026, Julio Viera |
//| Version Full - PURE DOW LAW |
//+------------------------------------------------------------------+
//| EPIPHANY - LEY DE DOW (sin grados, con concavidad real) |
//| |
//| ESTRUCTURA DE ABANICO: |
//| ALCISTA: Price > EMA20 > EMA40 > EMA80 > EMA200 |
//| BAJISTA: Price < EMA20 < EMA40 < EMA80 < EMA200 |
//| |
//| CONCAVIDAD EMA20 (7 velas): |
//| EMA20[0] > EMA20[7] = y=+x² (alcista) |
//| EMA20[0] < EMA20[7] = y=-x² (bajista) |
//| |
//| DOGMA 5: EMA80 > EMA200 = NO TRADE done by jvieranieves54@gmailcom |
//+------------------------------------------------------------------+
#property copyright "Julio Viera"
#property version "Full.7"
#property strict
#property indicator_chart_window
enum ENUM_TREND { TREND_BULLISH, TREND_BEARISH, TREND_NEUTRAL };
// --- INPUTS ---
input double InpRiskPercent = 10.0; // Risk percentage per trade
input int InpMaxDailyLosses = 2; // Max daily losses before block
input double InpMinRiskReward = 1.0; // Minimum Risk/Reward ratio (1:1)
input bool InpShowPanels = true; // Show panels
input int InpConcavityBars = 7; // Bars for concavity (7 = una semana de velas)
input int InpStepCandles = 7; // Candles to wait for step pattern
input string InpCustomComment = "Epiphany"; // Order comment
// --- GLOBAL VARIABLES ---
double g_initialBalance = 0.0;
int g_dailyLosses = 0;
bool g_tradingEnabled = true;
datetime g_lastResetDate = 0;
int g_atr_handle = INVALID_HANDLE;
//+------------------------------------------------------------------+
//| Expert initialization function |
//+------------------------------------------------------------------+
int OnInit()
{
ResetDailyStats();
g_atr_handle = iATR(_Symbol, PERIOD_CURRENT, 14);
Print("[Epiphany Full J5.7] PURA LEY DE DOW. Concavidad con ",
InpConcavityBars, " velas. Sin grados, solo estructura.");
return(INIT_SUCCEEDED);
}
//+------------------------------------------------------------------+
//| Expert deinitialization function |
//+------------------------------------------------------------------+
void OnDeinit(const int reason)
{
ObjectsDeleteAll(0, "Epi_");
ObjectsDeleteAll(0, "Meta_");
ObjectsDeleteAll(0, "J5_");
ObjectsDeleteAll(0, "J5Fast_");
ObjectsDeleteAll(0, "Right_");
if(g_atr_handle != INVALID_HANDLE) IndicatorRelease(g_atr_handle);
ChartRedraw();
}
//+------------------------------------------------------------------+
//| Expert tick function |
//+------------------------------------------------------------------+
void OnTick()
{
MqlDateTime dt;
TimeToStruct(TimeCurrent(), dt);
ResetDailyStats();
if(!InpShowPanels) return;
// ================================================================
// RIGHT PANEL - ANÁLISIS COMPLETO (LEY DE DOW)
// ================================================================
bool isSydney = (dt.hour >= 22 || dt.hour < 7);
bool isTokyo = (dt.hour >= 0 && dt.hour < 9);
bool isLondon = (dt.hour >= 8 && dt.hour < 17);
bool isNY = (dt.hour >= 13 && dt.hour < 22);
int x_right = 230;
int y_right = 40;
int p_width_right = 370;
int p_height_right = 520;
if(ObjectFind(0, "Right_Fondo") < 0) ObjectCreate(0, "Right_Fondo", OBJ_RECTANGLE_LABEL, 0, 0, 0);
ObjectSetInteger(0, "Right_Fondo", OBJPROP_CORNER, CORNER_RIGHT_UPPER);
ObjectSetInteger(0, "Right_Fondo", OBJPROP_XDISTANCE, 10);
ObjectSetInteger(0, "Right_Fondo", OBJPROP_YDISTANCE, y_right);
ObjectSetInteger(0, "Right_Fondo", OBJPROP_XSIZE, p_width_right);
ObjectSetInteger(0, "Right_Fondo", OBJPROP_YSIZE, p_height_right);
ObjectSetInteger(0, "Right_Fondo", OBJPROP_BGCOLOR, clrBlack);
ObjectSetInteger(0, "Right_Fondo", OBJPROP_BORDER_TYPE, BORDER_FLAT);
ObjectSetInteger(0, "Right_Fondo", OBJPROP_BACK, false);
DrawRight("Right_Title", "EPIPHANY - LEY DE DOW", x_right - 20, y_right + 15, clrWhite, 9);
DrawRight("Right_EMAs", "EMAs: 20 | 40 | 80 | 200", x_right - 20, y_right + 30, clrDodgerBlue, 8);
string activas = "";
if(isSydney) activas += "SYDNEY ";
if(isTokyo) activas += "TOKYO ";
if(isLondon) activas += "LONDON ";
if(isNY) activas += "NY ";
DrawRight("Right_Sessions", activas, x_right - 20, y_right + 50, clrCyan, 8);
string overlapMsg = "SINGLE SESSION";
color overlapCol = clrGray;
if(isLondon && isNY) { overlapMsg = "LONDON + NY (HIGH LIQUIDITY)"; overlapCol = clrMagenta; }
else if(isTokyo && isLondon) { overlapMsg = "TOKYO + LONDON"; overlapCol = clrSpringGreen; }
else if(isSydney && isTokyo) { overlapMsg = "SYDNEY + TOKYO"; overlapCol = clrDodgerBlue; }
else if(isSydney && isNY) { overlapMsg = "NY + SYDNEY"; overlapCol = clrOrange; }
DrawRight("Right_Overlap", overlapMsg, x_right - 20, y_right + 70, overlapCol, 9);
DrawRight("Right_Line", "────────────────────────────────────────", x_right - 20, y_right + 85, clrWhite, 7);
// ================================================================
// TIMEFRAMES (M1 a H4) - ESTRUCTURA DE ABANICO
// ================================================================
ENUM_TIMEFRAMES tfs[6] = {PERIOD_M1, PERIOD_M5, PERIOD_M15, PERIOD_M30, PERIOD_H1, PERIOD_H4};
string tfNames[6] = {"M1", "M5", "M15", "M30", "H1", "H4"};
int bullish = 0, bearish = 0;
for(int i=0; i {
string structure = GetFanStructure(tfs[i]);
string tfTxt = tfNames[i] + ": " + structure;
color c = clrYellow;
if(structure == "BULLISH") { bullish++; tfTxt = "📈 " + tfNames[i] + ": BULLISH"; c = clrLime; }
else if(structure == "BEARISH") { bearish++; tfTxt = "📉 " + tfNames[i] + ": BEARISH"; c = clrRed; }
else { tfTxt = "➡️ " + tfNames[i] + ": NEUTRAL"; c = clrYellow; }
DrawRight("Right_TF_"+IntegerToString(i), tfTxt, x_right - 20, y_right + 110 + (i * 18), c, 8);
}
// Recomendación
string rec = "";
color recColor = clrWhite;
if(bullish >= 5) { rec = "🔥🔥🔥 BUY!! (Strong bullish alignment)"; recColor = clrLime; }
else if(bearish >= 5) { rec = "💀💀💀 SELL!! (Strong bearish alignment)"; recColor = clrRed; }
else if(bullish >= 3) { rec = "📈 BUY Bias"; recColor = clrLime; }
else if(bearish >= 3) { rec = "📉 SELL Bias"; recColor = clrRed; }
else { rec = "⏸️ WAIT - Mixed signals"; recColor = clrYellow; }
DrawRight("Right_Order", rec, x_right - 20, y_right + 225, recColor, 10);
// ================================================================
// ABANICO Y CONCAVIDAD (H1 timeframe)
// ================================================================
double e20 = GetMAValue(PERIOD_H1, 20);
double e40 = GetMAValue(PERIOD_H1, 40);
double e80 = GetMAValue(PERIOD_H1, 80);
double e200 = GetMAValue(PERIOD_H1, 200);
double price = GetPriceForTF(PERIOD_H1);
// Estructura de abanico
bool isBullishFan = (price > e20 && e20 > e40 && e40 > e80 && e80 > e200);
bool isBearishFan = (price < e20 && e20 < e40 && e40 < e80 && e80 < e200);
string fanText = "";
color fanColor = clrGray;
if(isBearishFan) { fanText = "🔻 BEARISH FAN: E200 > E80 > E40 > E20 > Price"; fanColor = clrRed; }
else if(isBullishFan) { fanText = "🔺 BULLISH FAN: Price > E20 > E40 > E80 > E200"; fanColor = clrLime; }
else { fanText = "📊 NO CLEAR FAN (Sideways)"; fanColor = clrYellow; }
DrawRight("Right_Fan", fanText, x_right - 20, y_right + 255, fanColor, 8);
// Concavidad de EMA20 (comparando vela 0 vs vela 7)
string concavity20 = GetEMA20Concavity(PERIOD_H1, InpConcavityBars);
color concColor = clrGray;
if(concavity20 == "CONCAVE UP (y=+x²)") concColor = clrLime;
else if(concavity20 == "CONCAVE DOWN (y=-x²)") concColor = clrRed;
else concColor = clrYellow;
DrawRight("Right_Concavity", "EMA20: " + concavity20, x_right - 20, y_right + 280, concColor, 8);
// Comparación precio vs EMA20
string priceRelation = "";
color priceColor = clrGray;
if(price > e20) { priceRelation = "Price ABOVE EMA20 (Soporte dinámico)"; priceColor = clrLime; }
else if(price < e20) { priceRelation = "Price BELOW EMA20 (Resistencia dinámica)"; priceColor = clrRed; }
else { priceRelation = "Price AT EMA20"; priceColor = clrYellow; }
DrawRight("Right_PriceRel", priceRelation, x_right - 20, y_right + 305, priceColor, 8);
// DOGMA 5
bool dogmaViolated = (e80 > e200);
string dogmaText = dogmaViolated ? "⚠️ DOGMA 5: EMA80 > EMA200 - NO TRADE" : "✅ DOGMA 5: OK";
color dogmaColor = dogmaViolated ? clrRed : clrLime;
DrawRight("Right_Dogma", dogmaText, x_right - 20, y_right + 330, dogmaColor, 8);
// Aceleración (precio[0] vs precio[1])
bool accelDown = IsAcceleratingDown(PERIOD_H1);
bool accelUp = IsAcceleratingUp(PERIOD_H1);
string accelText = "";
color accelColor = clrGray;
if(accelDown) { accelText = "⚡ ACCELERATING DOWN"; accelColor = clrRed; }
else if(accelUp) { accelText = "⚡ ACCELERATING UP"; accelColor = clrLime; }
else { accelText = "⏸ NO ACCELERATION"; accelColor = clrYellow; }
DrawRight("Right_Accel", accelText, x_right - 20, y_right + 355, accelColor, 8);
// Institutional zone
bool inZone = IsPriceInInstitutionalZone(PERIOD_H1);
string zoneText = inZone ? "📍 IN INSTITUTIONAL ZONE (E20-E40)" : "⭕ OUTSIDE INSTITUTIONAL ZONE";
DrawRight("Right_Zone", zoneText, x_right - 20, y_right + 380, inZone ? clrYellow : clrGray, 8);
// Step pattern
string stepPattern = GetStepPattern(PERIOD_H1, InpStepCandles);
color stepColor = (StringFind(stepPattern, "DETECTED") >= 0) ? clrLime : clrGray;
DrawRight("Right_Step", stepPattern, x_right - 20, y_right + 405, stepColor, 8);
// ================================================================
// LOWER LEFT PANEL - ACCIÓN RÁPIDA
// ================================================================
int x_left = 10;
int y_left = 300;
int p_width_left = 290;
int p_height_left = 250;
if(ObjectFind(0, "J5Fast_Fondo") < 0) ObjectCreate(0, "J5Fast_Fondo", OBJ_RECTANGLE_LABEL, 0, 0, 0);
ObjectSetInteger(0, "J5Fast_Fondo", OBJPROP_CORNER, CORNER_LEFT_LOWER);
ObjectSetInteger(0, "J5Fast_Fondo", OBJPROP_XDISTANCE, x_left);
ObjectSetInteger(0, "J5Fast_Fondo", OBJPROP_YDISTANCE, y_left);
ObjectSetInteger(0, "J5Fast_Fondo", OBJPROP_XSIZE, p_width_left);
ObjectSetInteger(0, "J5Fast_Fondo", OBJPROP_YSIZE, p_height_left);
ObjectSetInteger(0, "J5Fast_Fondo", OBJPROP_BGCOLOR, clrBlack);
ObjectSetInteger(0, "J5Fast_Fondo", OBJPROP_BORDER_TYPE, BORDER_FLAT);
ObjectSetInteger(0, "J5Fast_Fondo", OBJPROP_BACK, false);
// Determinar acción basada en LEY DE DOW
string action = "";
color actionColor = clrWhite;
string distanceText = "";
string detailText = "";
double distance = 0;
if(dogmaViolated)
{
action = "🚫 DOGMA 5";
distanceText = "EMA80 > EMA200";
detailText = "NO TRADE TODAY";
actionColor = clrRed;
}
else if(isBearishFan)
{
distance = (e20 - price) / (e20 * 0.0001);
distanceText = DoubleToString(distance, 0) + " pts to EMA20";
if(concavity20 == "CONCAVE DOWN (y=-x²)")
{
if(distance < 30 && distance > 5)
{
action = "🎯 PREPARE SELL";
detailText = "Bearish fan + concave down";
actionColor = clrRed;
}
else if(distance < 5)
{
action = "⚠️ TOUCHING - READY!";
detailText = "Price at EMA20 resistance";
actionColor = clrRed;
}
else
{
action = "⏳ WAIT SELL";
detailText = "Let price rise to EMA20";
actionColor = clrRed;
}
}
else
{
action = "⏳ WAIT SELL";
distanceText = "Need concave down confirmation";
detailText = "EMA20 not yet concave";
actionColor = clrRed;
}
}
else if(isBullishFan)
{
distance = (price - e20) / (e20 * 0.0001);
distanceText = DoubleToString(distance, 0) + " pts to EMA20";
if(concavity20 == "CONCAVE UP (y=+x²)")
{
if(distance < 30 && distance > 5)
{
action = "🎯 PREPARE BUY";
detailText = "Bullish fan + concave up";
actionColor = clrLime;
}
else if(distance < 5)
{
action = "⚠️ TOUCHING - READY!";
detailText = "Price at EMA20 support";
actionColor = clrLime;
}
else
{
action = "⏳ WAIT BUY";
detailText = "Let price fall to EMA20";
actionColor = clrLime;
}
}
else
{
action = "⏳ WAIT BUY";
distanceText = "Need concave up confirmation";
detailText = "EMA20 not yet concave";
actionColor = clrLime;
}
}
else
{
action = "❌ NO TRADE";
distanceText = "No clear fan structure";
detailText = "Wait for alignment";
actionColor = clrGray;
}
DrawLeftLower("J5Fast_Action", action, x_left + 10, y_left + 30, actionColor, 16, true);
DrawLeftLower("J5Fast_Distance", distanceText, x_left + 10, y_left + 55, clrYellow, 10, false);
DrawLeftLower("J5Fast_Detail", detailText, x_left + 10, y_left + 70, clrCyan, 9, false);
// Información de soporte
string fanDisplay = isBearishFan ? "🔻 BEARISH FAN" : (isBullishFan ? "🔺 BULLISH FAN" : "📊 NO FAN");
color fanDisplayColor = isBearishFan ? clrRed : (isBullishFan ? clrLime : clrYellow);
DrawLeftLower("J5Fast_Fan", fanDisplay, x_left + 10, y_left + 90, fanDisplayColor, 8, false);
string concDisplay = "Concavity: " + concavity20;
color concDisplayColor = (concavity20 == "CONCAVE UP (y=+x²)") ? clrLime : ((concavity20 == "CONCAVE DOWN (y=-x²)") ? clrRed : clrYellow);
DrawLeftLower("J5Fast_ConcDisplay", concDisplay, x_left + 10, y_left + 108, concDisplayColor, 8, false);
string dogmaSmall = (e80 > e200) ? "⚠️ DOGMA 5: EMA80 > EMA200" : "✓ DOGMA 5: OK";
color dogmaSmallColor = (e80 > e200) ? clrRed : clrLime;
DrawLeftLower("J5Fast_DogmaSmall", dogmaSmall, x_left + 10, y_left + 126, dogmaSmallColor, 8, false);
// Meta Administrator
double balance = AccountInfoDouble(ACCOUNT_BALANCE);
double maxRisk = balance * (InpRiskPercent / 100.0);
string status = (g_dailyLosses == 0) ? "ACTIVE" : (g_dailyLosses == 1 ? "⚠️ 1 LOSS" : "🔴 BLOCKED");
color statusColor = (g_dailyLosses == 0) ? clrLime : (g_dailyLosses == 1 ? clrYellow : clrRed);
DrawLeftLower("J5Fast_Balance", "Balance: $" + DoubleToString(balance, 2), x_left + 10, y_left + 146, clrCyan, 8, false);
DrawLeftLower("J5Fast_Risk", "Risk 10%: $" + DoubleToString(maxRisk, 2), x_left + 10, y_left + 162, clrLime, 8, false);
DrawLeftLower("J5Fast_Status", "Status: " + status + " (" + IntegerToString(g_dailyLosses) + "/" + IntegerToString(InpMaxDailyLosses) + ")", x_left + 10, y_left + 178, statusColor, 8, false);
DrawLeftLower("J5Fast_Line", "──────────────────────────────────", x_left + 10, y_left + 194, clrGray, 7, false);
DrawLeftLower("J5Fast_Signature", "Baruc | Dow Law J5.7", x_left + 10, y_left + 210, clrDarkOrange, 7, false);
ChartRedraw();
}
//+------------------------------------------------------------------+
//| DRAW FUNCTIONS |
//+------------------------------------------------------------------+
void DrawRight(string name, string txt, int x, int y, color c, int size)
{
if(ObjectFind(0, name) < 0) ObjectCreate(0, name, OBJ_LABEL, 0, 0, 0);
ObjectSetInteger(0, name, OBJPROP_CORNER, CORNER_RIGHT_UPPER);
ObjectSetInteger(0, name, OBJPROP_XDISTANCE, x);
ObjectSetInteger(0, name, OBJPROP_YDISTANCE, y);
ObjectSetInteger(0, name, OBJPROP_COLOR, c);
ObjectSetInteger(0, name, OBJPROP_FONTSIZE, size);
ObjectSetString(0, name, OBJPROP_TEXT, txt);
ObjectSetString(0, name, OBJPROP_FONT, "Consolas");
}
void DrawLeftLower(string name, string txt, int x, int y, color c, int size, bool bold)
{
if(ObjectFind(0, name) < 0) ObjectCreate(0, name, OBJ_LABEL, 0, 0, 0);
ObjectSetInteger(0, name, OBJPROP_CORNER, CORNER_LEFT_LOWER);
ObjectSetInteger(0, name, OBJPROP_XDISTANCE, x);
ObjectSetInteger(0, name, OBJPROP_YDISTANCE, y);
ObjectSetInteger(0, name, OBJPROP_COLOR, c);
ObjectSetInteger(0, name, OBJPROP_FONTSIZE, size);
ObjectSetString(0, name, OBJPROP_TEXT, txt);
if(bold) ObjectSetString(0, name, OBJPROP_FONT, "Arial Bold");
else ObjectSetString(0, name, OBJPROP_FONT, "Consolas");
}
//+------------------------------------------------------------------+
//| Reset daily stats |
//+------------------------------------------------------------------+
void ResetDailyStats()
{
MqlDateTime now, last;
TimeToStruct(TimeCurrent(), now);
TimeToStruct(g_lastResetDate, last);
if(now.day != last.day || now.mon != last.mon || now.year != last.year)
{
g_initialBalance = AccountInfoDouble(ACCOUNT_BALANCE);
g_dailyLosses = 0;
g_tradingEnabled = true;
g_lastResetDate = TimeCurrent();
Print("[Meta] New day. Balance: ", g_initialBalance);
}
}
//+------------------------------------------------------------------+
//| Get fan structure for a timeframe |
//+------------------------------------------------------------------+
string GetFanStructure(ENUM_TIMEFRAMES tf)
{
double price = GetPriceForTF(tf);
double e20 = GetMAValue(tf, 20);
double e40 = GetMAValue(tf, 40);
double e80 = GetMAValue(tf, 80);
double e200 = GetMAValue(tf, 200);
if(e20 == 0 || e40 == 0 || e80 == 0 || e200 == 0) return "NEUTRAL";
if(price > e20 && e20 > e40 && e40 > e80 && e80 > e200) return "BULLISH";
if(price < e20 && e20 < e40 && e40 < e80 && e80 < e200) return "BEARISH";
return "NEUTRAL";
}
//+------------------------------------------------------------------+
//| Get EMA20 concavity (compare position 0 vs position N) |
//+------------------------------------------------------------------+
string GetEMA20Concavity(ENUM_TIMEFRAMES tf, int bars)
{
double ema[];
int handle = iMA(_Symbol, tf, 20, 0, MODE_EMA, PRICE_CLOSE);
if(handle == INVALID_HANDLE) return "NO DATA";
if(CopyBuffer(handle, 0, 0, bars, ema) < bars)
{
IndicatorRelease(handle);
return "NO DATA";
}
IndicatorRelease(handle);
double current = ema[0];
double past = ema[bars-1];
double atr = GetATRValue(tf, 14);
// Calcular diferencia significativa
double diff = current - past;
double threshold = (atr > 0) ? atr * 0.1 : 0.5; // 10% de ATR como umbral
if(diff > threshold) return "CONCAVE UP (y=+x²)";
if(diff < -threshold) return "CONCAVE DOWN (y=-x²)";
return "FLAT (SIDEWAYS)";
}
//+------------------------------------------------------------------+
//| Check acceleration price[0] vs price[1] |
//+------------------------------------------------------------------+
bool IsAcceleratingDown(ENUM_TIMEFRAMES tf)
{
double price[3];
if(CopyClose(_Symbol, tf, 0, 3, price) < 3) return false;
bool movingDown = (price[0] < price[1] && price[1] < price[2]);
double acceleration = (price[1] - price[2]) - (price[0] - price[1]);
return (movingDown && acceleration > 0);
}
bool IsAcceleratingUp(ENUM_TIMEFRAMES tf)
{
double price[3];
if(CopyClose(_Symbol, tf, 0, 3, price) < 3) return false;
bool movingUp = (price[0] > price[1] && price[1] > price[2]);
double acceleration = (price[0] - price[1]) - (price[1] - price[2]);
return (movingUp && acceleration > 0);
}
//+------------------------------------------------------------------+
//| Check if price is between EMA20 and EMA40 |
//+------------------------------------------------------------------+
bool IsPriceInInstitutionalZone(ENUM_TIMEFRAMES tf)
{
double price = GetPriceForTF(tf);
double e20 = GetMAValue(tf, 20);
double e40 = GetMAValue(tf, 40);
if(e20 == 0 || e40 == 0) return false;
if(e20 > e40 && price < e20 && price > e40) return true;
if(e20 < e40 && price > e20 && price < e40) return true;
return false;
}
//+------------------------------------------------------------------+
//| Detect step pattern |
//+------------------------------------------------------------------+
string GetStepPattern(ENUM_TIMEFRAMES tf, int requiredCandles)
{
double e20 = GetMAValue(tf, 20);
if(e20 == 0) return "NO DATA";
double price[];
int copied = CopyClose(_Symbol, tf, 0, requiredCandles + 5, price);
if(copied < requiredCandles + 2) return "INSUFFICIENT DATA";
int touches = 0;
for(int i = 0; i < requiredCandles; i++)
{
double distance = MathAbs(price[i] - e20) / (e20 * 0.0001);
if(distance < 10) touches++;
}
if(touches >= 3) return "✓ STEP PATTERN (" + IntegerToString(touches) + " touches)";
return "No step pattern (" + IntegerToString(touches) + " touches)";
}
//+------------------------------------------------------------------+
//| Get MA value |
//+------------------------------------------------------------------+
double GetMAValue(ENUM_TIMEFRAMES tf, int period)
{
int handle = iMA(_Symbol, tf, period, 0, MODE_EMA, PRICE_CLOSE);
if(handle == INVALID_HANDLE) return 0;
double buffer[1];
if(CopyBuffer(handle, 0, 0, 1, buffer) > 0)
{
IndicatorRelease(handle);
return buffer[0];
}
IndicatorRelease(handle);
return 0;
}
//+------------------------------------------------------------------+
//| Get ATR value |
//+------------------------------------------------------------------+
double GetATRValue(ENUM_TIMEFRAMES tf, int period)
{
int handle = iATR(_Symbol, tf, period);
if(handle == INVALID_HANDLE) return 0;
double buffer[1];
if(CopyBuffer(handle, 0, 0, 1, buffer) > 0)
{
IndicatorRelease(handle);
return buffer[0];
}
IndicatorRelease(handle);
return 0;
}
//+------------------------------------------------------------------+
//| Get price for specific timeframe |
//+------------------------------------------------------------------+
double GetPriceForTF(ENUM_TIMEFRAMES tf)
{
double price[1];
if(CopyClose(_Symbol, tf, 0, 1, price) > 0) return price[0];
return 0;
}
//+------------------------------------------------------------------+
//| PUBLIC FUNCTIONS |
//+------------------------------------------------------------------+
void RegisterLoss()
{
g_dailyLosses++;
if(g_dailyLosses >= InpMaxDailyLosses) g_tradingEnabled = false;
Print("[Meta] Loss: ", g_dailyLosses, "/", InpMaxDailyLosses);
}
void RegisterWin()
{
Print("[Meta] Win. Balance: ", AccountInfoDouble(ACCOUNT_BALANCE));
}
bool ValidateTrade(double potentialRisk, double potentialReward)
{
ResetDailyStats();
if(!g_tradingEnabled) return false;
double currentBalance = AccountInfoDouble(ACCOUNT_BALANCE);
double maxRisk = currentBalance * (InpRiskPercent / 100.0);
if(potentialRisk > maxRisk) return false;
if(potentialReward < potentialRisk * InpMinRiskReward) return false;
return true;
}
//+------------------------------------------------------------------+
//| FIN - EPIPHANY LEY DE DOW J5.7 |
//+------------------------------------------------------------------+
Enjoy the Expert Advisor looks professional, with institutional minds trade desicions. And the best Totally free, forever, because giving a tool like this will be a game changer if you have a bad dicipline, you will learn it here.
Julio Viera

Hi Important notice about the last Expert Advisor I published down this one I notice the higher the timeframe the highest the winrate and all the results:
EA – Non-Returning Floor Candle Format
Strategy based on institutional structure: entries where the money actually moves, not in the noise.
GOLD (XAUUSD)
Type: Swing / Structural Intraday
Logic: No Return Bars
Broker: ActivTrades (Backtest 2025)
Overall performance summary
The Non-Returning Floor Candlestick Format Expert Advisor (EA) was designed to operate exclusively in areas where institutions accumulate and push prices higher, avoiding the typical noise of lower timeframes. The result is a system that:
Protect your capital: drawdown is contained and never compromised.
Scales well across multiple timeframes (M1 → H4).
Winrate improves as noise decreases.
It benefits from the increased protection buffer of 50 → 100 points , giving the operation “breathing room”.
Effect of noise and timeframe on winrate
The "floor that doesn't return" pattern depends on structure, not micro-movements. Therefore, as the timeframe increases, the noise decreases and the institutional intent becomes clearer. The result is a natural increase in win rate and an improvement in the quality of trades.
Performance comparison by timeframe
Timeframe Period Batch Total Net Profit Winrate Profit Factor Max DD Balance Operations
M1 2025.01.01–2025.12.31 0.01 +1,071.50 USD 28.53% 1.16 4.62% 1041
M5 2025.01.01–2025.12.31 0.03 +4 546.97 USD 33.06% 1.52 6.33% 245
H1 2025.01.01–2025.12.31 0.03 +5 481.85 USD 51.22% 2.63 4.96% 41
H4 2025.01.01–2025.12.31 0.03 +4,038.81 USD 70.00% 4.63 4.88% 10
The less noise (higher timeframes), the cleaner the structure and the higher the win rate: from 28.53% in M1 to 70% in H4.
Key change: from 50 to 100 buffer points
The EA uses a BufferPts parameter to allow room for price movement before invalidating the idea. This buffer acts as an "institutional cushion" that prevents normal market noise from prematurely closing the trade.
Original configuration – 50 buffer points
Main timeframe tested: M5.
BufferPts = 50.0 .
More opportunities, but more exposure to intraday noise.
Higher SL touch frequency per micro-sweep.
Ideal for those seeking more trades, accepting more noise and a lower relative win rate.
Refined configuration – 100 buffer points
Applied in M1, H1 and H4.
BufferPts = 100.0 More room to breathe
Fewer noise-related stops, more respect for the structure.
Winrate and stability improve, especially in H1 and H4.
Increasing the buffer from 50 to 100 points allows the price to "breathe" within the institutional zone before invalidating the trade.
Practical effect of the enlarged buffer
Al duplicar el buffer, el EA deja de reaccionar al ruido y se enfoca en el movimiento real de intención. Esto se traduce en:
Menos stops prematuros.
Mayor porcentaje de operaciones que alcanzan el TP completo.
Curva de balance más limpia y progresiva.
Mejor relación entre winrate y profit factor.
Protección del capital y comportamiento del drawdown
Backtest H1 – GOLD (2025)
Net Profit: 5 481.85 USD
Max DD Balance: 4.96%
Winrate: 51.22%
Profit Factor: 2.63
La curva de balance muestra un crecimiento consistente con drawdown controlado. El capital inicial de 10 000 USD nunca se ve comprometido: el sistema respeta el riesgo y deja que la estadística haga el trabajo.
Backtest H4 – GOLD (2025)
Net Profit: 4 038.81 USD
Max DD Balance: 4.88%
Winrate: 70.00%
Profit Factor: 4.63
En H4, el EA opera casi exclusivamente sobre estructura limpia. El resultado es un winrate muy alto y un profit factor robusto, manteniendo el drawdown en niveles cómodos para cuentas reales.
Evidencia en cuenta demo (ejecución real)
En pruebas en cuenta demo, el EA mostró el mismo comportamiento: operaciones tomadas en zonas claras, sin poner en riesgo el capital. Ejemplo:
Trade History (extracto)
Total Net Profit: 30.81 USD
Balance Drawdown Maximal: 2.02% (6.09 USD)
Winrate: 50% (2 trades)
Profit Factor: 6.06
Incluso con pocas operaciones, la lógica se mantiene: riesgo pequeño, asimetría positiva y capital siempre protegido.
Mecánica del EA – “Piso que no vuelve”
La lógica del EA no depende de indicadores clásicos, sino de comportamiento del precio en zonas donde el mercado muestra intención real. En términos simples:
Conceptos clave
LookbackBars = 20: ventana donde se detecta el piso relevante.
NoReturnBars = 6: número de velas que confirman que el precio no vuelve al piso.
BufferPts: margen de seguridad para evitar stops por ruido.
MaxSpreadPts: filtro para evitar entrar en condiciones de spread anormal.
El EA busca zonas donde el precio:
Hace un piso claro.
Se aleja con decisión (impulso).
No regresa a testear ese piso en las siguientes velas (no return).
Permite una entrada con buffer suficiente para absorber el ruido.
Resumen para el usuario de MQL5
EA pensado para operar en GOLD, pero basado en estructura, no en parámetros curve–fitted.
Funciona en M1, M5, H1 y H4, con mejor comportamiento en H1 y H4.
Mientras menos ruido (timeframe más alto), mayor winrate y mejor profit factor.
El cambio de 50 → 100 puntos de buffer fue clave para darle “espacio de respiración” a las operaciones y reducir stops por ruido.
Este EA fue construido desde una idea simple pero poderosa: operar donde las instituciones realmente mueven el precio, no donde el ruido engaña al trader retail. Los resultados en múltiples timeframes y el comportamiento del drawdown confirman que la lógica es sólida, escalable y apta para cuentas reales con gestión de riesgo responsable.
EA – Non-Returning Floor Candle Format
Strategy based on institutional structure: entries where the money actually moves, not in the noise.
GOLD (XAUUSD)
Type: Swing / Structural Intraday
Logic: No Return Bars
Broker: ActivTrades (Backtest 2025)
Overall performance summary
The Non-Returning Floor Candlestick Format Expert Advisor (EA) was designed to operate exclusively in areas where institutions accumulate and push prices higher, avoiding the typical noise of lower timeframes. The result is a system that:
Protect your capital: drawdown is contained and never compromised.
Scales well across multiple timeframes (M1 → H4).
Winrate improves as noise decreases.
It benefits from the increased protection buffer of 50 → 100 points , giving the operation “breathing room”.
Effect of noise and timeframe on winrate
The "floor that doesn't return" pattern depends on structure, not micro-movements. Therefore, as the timeframe increases, the noise decreases and the institutional intent becomes clearer. The result is a natural increase in win rate and an improvement in the quality of trades.
Performance comparison by timeframe
Timeframe Period Batch Total Net Profit Winrate Profit Factor Max DD Balance Operations
M1 2025.01.01–2025.12.31 0.01 +1,071.50 USD 28.53% 1.16 4.62% 1041
M5 2025.01.01–2025.12.31 0.03 +4 546.97 USD 33.06% 1.52 6.33% 245
H1 2025.01.01–2025.12.31 0.03 +5 481.85 USD 51.22% 2.63 4.96% 41
H4 2025.01.01–2025.12.31 0.03 +4,038.81 USD 70.00% 4.63 4.88% 10
The less noise (higher timeframes), the cleaner the structure and the higher the win rate: from 28.53% in M1 to 70% in H4.
Key change: from 50 to 100 buffer points
The EA uses a BufferPts parameter to allow room for price movement before invalidating the idea. This buffer acts as an "institutional cushion" that prevents normal market noise from prematurely closing the trade.
Original configuration – 50 buffer points
Main timeframe tested: M5.
BufferPts = 50.0 .
More opportunities, but more exposure to intraday noise.
Higher SL touch frequency per micro-sweep.
Ideal for those seeking more trades, accepting more noise and a lower relative win rate.
Refined configuration – 100 buffer points
Applied in M1, H1 and H4.
BufferPts = 100.0 More room to breathe
Fewer noise-related stops, more respect for the structure.
Winrate and stability improve, especially in H1 and H4.
Increasing the buffer from 50 to 100 points allows the price to "breathe" within the institutional zone before invalidating the trade.
Practical effect of the enlarged buffer
Al duplicar el buffer, el EA deja de reaccionar al ruido y se enfoca en el movimiento real de intención. Esto se traduce en:
Menos stops prematuros.
Mayor porcentaje de operaciones que alcanzan el TP completo.
Curva de balance más limpia y progresiva.
Mejor relación entre winrate y profit factor.
Protección del capital y comportamiento del drawdown
Backtest H1 – GOLD (2025)
Net Profit: 5 481.85 USD
Max DD Balance: 4.96%
Winrate: 51.22%
Profit Factor: 2.63
La curva de balance muestra un crecimiento consistente con drawdown controlado. El capital inicial de 10 000 USD nunca se ve comprometido: el sistema respeta el riesgo y deja que la estadística haga el trabajo.
Backtest H4 – GOLD (2025)
Net Profit: 4 038.81 USD
Max DD Balance: 4.88%
Winrate: 70.00%
Profit Factor: 4.63
En H4, el EA opera casi exclusivamente sobre estructura limpia. El resultado es un winrate muy alto y un profit factor robusto, manteniendo el drawdown en niveles cómodos para cuentas reales.
Evidencia en cuenta demo (ejecución real)
En pruebas en cuenta demo, el EA mostró el mismo comportamiento: operaciones tomadas en zonas claras, sin poner en riesgo el capital. Ejemplo:
Trade History (extracto)
Total Net Profit: 30.81 USD
Balance Drawdown Maximal: 2.02% (6.09 USD)
Winrate: 50% (2 trades)
Profit Factor: 6.06
Incluso con pocas operaciones, la lógica se mantiene: riesgo pequeño, asimetría positiva y capital siempre protegido.
Mecánica del EA – “Piso que no vuelve”
La lógica del EA no depende de indicadores clásicos, sino de comportamiento del precio en zonas donde el mercado muestra intención real. En términos simples:
Conceptos clave
LookbackBars = 20: ventana donde se detecta el piso relevante.
NoReturnBars = 6: número de velas que confirman que el precio no vuelve al piso.
BufferPts: margen de seguridad para evitar stops por ruido.
MaxSpreadPts: filtro para evitar entrar en condiciones de spread anormal.
El EA busca zonas donde el precio:
Hace un piso claro.
Se aleja con decisión (impulso).
No regresa a testear ese piso en las siguientes velas (no return).
Permite una entrada con buffer suficiente para absorber el ruido.
Resumen para el usuario de MQL5
EA pensado para operar en GOLD, pero basado en estructura, no en parámetros curve–fitted.
Funciona en M1, M5, H1 y H4, con mejor comportamiento en H1 y H4.
Mientras menos ruido (timeframe más alto), mayor winrate y mejor profit factor.
El cambio de 50 → 100 puntos de buffer fue clave para darle “espacio de respiración” a las operaciones y reducir stops por ruido.
Este EA fue construido desde una idea simple pero poderosa: operar donde las instituciones realmente mueven el precio, no donde el ruido engaña al trader retail. Los resultados en múltiples timeframes y el comportamiento del drawdown confirman que la lógica es sólida, escalable y apta para cuentas reales con gestión de riesgo responsable.
EA – Non-Returning Floor Candle Format
Strategy based on institutional structure: entries where the money actually moves, not in the noise.
GOLD (XAUUSD)
Type: Swing / Structural Intraday
Logic: No Return Bars
Broker: ActivTrades (Backtest 2025)
Overall performance summary
The Non-Returning Floor Candlestick Format Expert Advisor (EA) was designed to operate exclusively in areas where institutions accumulate and push prices higher, avoiding the typical noise of lower timeframes. The result is a system that:
Protect your capital: drawdown is contained and never compromised.
Scales well across multiple timeframes (M1 → H4).
Winrate improves as noise decreases.
It benefits from the increased protection buffer of 50 → 100 points , giving the operation “breathing room”.
Effect of noise and timeframe on winrate
The "floor that doesn't return" pattern depends on structure, not micro-movements. Therefore, as the timeframe increases, the noise decreases and the institutional intent becomes clearer. The result is a natural increase in win rate and an improvement in the quality of trades.
Performance comparison by timeframe
Timeframe Period Batch Total Net Profit Winrate Profit Factor Max DD Balance Operations
M1 2025.01.01–2025.12.31 0.01 +1,071.50 USD 28.53% 1.16 4.62% 1041
M5 2025.01.01–2025.12.31 0.03 +4 546.97 USD 33.06% 1.52 6.33% 245
H1 2025.01.01–2025.12.31 0.03 +5 481.85 USD 51.22% 2.63 4.96% 41
H4 2025.01.01–2025.12.31 0.03 +4,038.81 USD 70.00% 4.63 4.88% 10
The less noise (higher timeframes), the cleaner the structure and the higher the win rate: from 28.53% in M1 to 70% in H4.
Key change: from 50 to 100 buffer points
The EA uses a BufferPts parameter to allow room for price movement before invalidating the idea. This buffer acts as an "institutional cushion" that prevents normal market noise from prematurely closing the trade.
Original configuration – 50 buffer points
Main timeframe tested: M5.
BufferPts = 50.0 .
More opportunities, but more exposure to intraday noise.
Higher SL touch frequency per micro-sweep.
Ideal for those seeking more trades, accepting more noise and a lower relative win rate.
Refined configuration – 100 buffer points
Applied in M1, H1 and H4.
BufferPts = 100.0 More room to breathe
Fewer noise-related stops, more respect for the structure.
Winrate and stability improve, especially in H1 and H4.
Increasing the buffer from 50 to 100 points allows the price to "breathe" within the institutional zone before invalidating the trade.
Practical effect of the enlarged buffer
Al duplicar el buffer, el EA deja de reaccionar al ruido y se enfoca en el movimiento real de intención. Esto se traduce en:
Menos stops prematuros.
Mayor porcentaje de operaciones que alcanzan el TP completo.
Curva de balance más limpia y progresiva.
Mejor relación entre winrate y profit factor.
Protección del capital y comportamiento del drawdown
Backtest H1 – GOLD (2025)
Net Profit: 5 481.85 USD
Max DD Balance: 4.96%
Winrate: 51.22%
Profit Factor: 2.63
La curva de balance muestra un crecimiento consistente con drawdown controlado. El capital inicial de 10 000 USD nunca se ve comprometido: el sistema respeta el riesgo y deja que la estadística haga el trabajo.
Backtest H4 – GOLD (2025)
Net Profit: 4 038.81 USD
Max DD Balance: 4.88%
Winrate: 70.00%
Profit Factor: 4.63
En H4, el EA opera casi exclusivamente sobre estructura limpia. El resultado es un winrate muy alto y un profit factor robusto, manteniendo el drawdown en niveles cómodos para cuentas reales.
Evidencia en cuenta demo (ejecución real)
En pruebas en cuenta demo, el EA mostró el mismo comportamiento: operaciones tomadas en zonas claras, sin poner en riesgo el capital. Ejemplo:
Trade History (extracto)
Total Net Profit: 30.81 USD
Balance Drawdown Maximal: 2.02% (6.09 USD)
Winrate: 50% (2 trades)
Profit Factor: 6.06
Incluso con pocas operaciones, la lógica se mantiene: riesgo pequeño, asimetría positiva y capital siempre protegido.
Mecánica del EA – “Piso que no vuelve”
La lógica del EA no depende de indicadores clásicos, sino de comportamiento del precio en zonas donde el mercado muestra intención real. En términos simples:
Conceptos clave
LookbackBars = 20: ventana donde se detecta el piso relevante.
NoReturnBars = 6: número de velas que confirman que el precio no vuelve al piso.
BufferPts: margen de seguridad para evitar stops por ruido.
MaxSpreadPts: filtro para evitar entrar en condiciones de spread anormal.
El EA busca zonas donde el precio:
Hace un piso claro.
Se aleja con decisión (impulso).
No regresa a testear ese piso en las siguientes velas (no return).
Permite una entrada con buffer suficiente para absorber el ruido.
Resumen para el usuario de MQL5
EA pensado para operar en GOLD, pero basado en estructura, no en parámetros curve–fitted.
Funciona en M1, M5, H1 y H4, con mejor comportamiento en H1 y H4.
Mientras menos ruido (timeframe más alto), mayor winrate y mejor profit factor.
El cambio de 50 → 100 puntos de buffer fue clave para darle “espacio de respiración” a las operaciones y reducir stops por ruido.
Este EA fue construido desde una idea simple pero poderosa: operar donde las instituciones realmente mueven el precio, no donde el ruido engaña al trader retail. Los resultados en múltiples timeframes y el comportamiento del drawdown confirman que la lógica es sólida, escalable y apta para cuentas reales con gestión de riesgo responsable.
EA – Non-Returning Floor Candle Format
Strategy based on institutional structure: entries where the money actually moves, not in the noise.
GOLD (XAUUSD)
Type: Swing / Structural Intraday
Logic: No Return Bars
Broker: ActivTrades (Backtest 2025)
Overall performance summary
The Non-Returning Floor Candlestick Format Expert Advisor (EA) was designed to operate exclusively in areas where institutions accumulate and push prices higher, avoiding the typical noise of lower timeframes. The result is a system that:
Protect your capital: drawdown is contained and never compromised.
Scales well across multiple timeframes (M1 → H4).
Winrate improves as noise decreases.
It benefits from the increased protection buffer of 50 → 100 points , giving the operation “breathing room”.
Effect of noise and timeframe on winrate
The "floor that doesn't return" pattern depends on structure, not micro-movements. Therefore, as the timeframe increases, the noise decreases and the institutional intent becomes clearer. The result is a natural increase in win rate and an improvement in the quality of trades.
Performance comparison by timeframe
Timeframe Period Batch Total Net Profit Winrate Profit Factor Max DD Balance Operations
M1 2025.01.01–2025.12.31 0.01 +1,071.50 USD 28.53% 1.16 4.62% 1041
M5 2025.01.01–2025.12.31 0.03 +4 546.97 USD 33.06% 1.52 6.33% 245
H1 2025.01.01–2025.12.31 0.03 +5 481.85 USD 51.22% 2.63 4.96% 41
H4 2025.01.01–2025.12.31 0.03 +4,038.81 USD 70.00% 4.63 4.88% 10
The less noise (higher timeframes), the cleaner the structure and the higher the win rate: from 28.53% in M1 to 70% in H4.
Key change: from 50 to 100 buffer points
The EA uses a BufferPts parameter to allow room for price movement before invalidating the idea. This buffer acts as an "institutional cushion" that prevents normal market noise from prematurely closing the trade.
Original configuration – 50 buffer points
Main timeframe tested: M5.
BufferPts = 50.0 .
More opportunities, but more exposure to intraday noise.
Higher SL touch frequency per micro-sweep.
Ideal for those seeking more trades, accepting more noise and a lower relative win rate.
Refined configuration – 100 buffer points
Applied in M1, H1 and H4.
BufferPts = 100.0 More room to breathe
Fewer noise-related stops, more respect for the structure.
Winrate and stability improve, especially in H1 and H4.
Increasing the buffer from 50 to 100 points allows the price to "breathe" within the institutional zone before invalidating the trade.
Practical effect of the enlarged buffer
Al duplicar el buffer, el EA deja de reaccionar al ruido y se enfoca en el movimiento real de intención. Esto se traduce en:
Menos stops prematuros.
Mayor porcentaje de operaciones que alcanzan el TP completo.
Curva de balance más limpia y progresiva.
Mejor relación entre winrate y profit factor.
Protección del capital y comportamiento del drawdown
Backtest H1 – GOLD (2025)
Net Profit: 5 481.85 USD
Max DD Balance: 4.96%
Winrate: 51.22%
Profit Factor: 2.63
La curva de balance muestra un crecimiento consistente con drawdown controlado. El capital inicial de 10 000 USD nunca se ve comprometido: el sistema respeta el riesgo y deja que la estadística haga el trabajo.
Backtest H4 – GOLD (2025)
Net Profit: 4 038.81 USD
Max DD Balance: 4.88%
Winrate: 70.00%
Profit Factor: 4.63
En H4, el EA opera casi exclusivamente sobre estructura limpia. El resultado es un winrate muy alto y un profit factor robusto, manteniendo el drawdown en niveles cómodos para cuentas reales.
Evidencia en cuenta demo (ejecución real)
En pruebas en cuenta demo, el EA mostró el mismo comportamiento: operaciones tomadas en zonas claras, sin poner en riesgo el capital. Ejemplo:
Trade History (extracto)
Total Net Profit: 30.81 USD
Balance Drawdown Maximal: 2.02% (6.09 USD)
Winrate: 50% (2 trades)
Profit Factor: 6.06
Incluso con pocas operaciones, la lógica se mantiene: riesgo pequeño, asimetría positiva y capital siempre protegido.
Mecánica del EA – “Piso que no vuelve”
La lógica del EA no depende de indicadores clásicos, sino de comportamiento del precio en zonas donde el mercado muestra intención real. En términos simples:
Conceptos clave
LookbackBars = 20: ventana donde se detecta el piso relevante.
NoReturnBars = 6: número de velas que confirman que el precio no vuelve al piso.
BufferPts: margen de seguridad para evitar stops por ruido.
MaxSpreadPts: filtro para evitar entrar en condiciones de spread anormal.
El EA busca zonas donde el precio:
Hace un piso claro.
Se aleja con decisión (impulso).
No regresa a testear ese piso en las siguientes velas (no return).
Permite una entrada con buffer suficiente para absorber el ruido.
Resumen para el usuario de MQL5
EA pensado para operar en GOLD, pero basado en estructura, no en parámetros curve–fitted.
Funciona en M1, M5, H1 y H4, con mejor comportamiento en H1 y H4.
Mientras menos ruido (timeframe más alto), mayor winrate y mejor profit factor.
El cambio de 50 → 100 puntos de buffer fue clave para darle “espacio de respiración” a las operaciones y reducir stops por ruido.
Este EA fue construido desde una idea simple pero poderosa: operar donde las instituciones realmente mueven el precio, no donde el ruido engaña al trader retail. Los resultados en múltiples timeframes y el comportamiento del drawdown confirman que la lógica es sólida, escalable y apta para cuentas reales con gestión de riesgo responsable.
Julio Viera

Hi as always creating new ways for new traders and all kind of traders that are looking for a free Expert Advisor, this one is my baby, is done for any Asset I tested in the most volatile asset like Gold, and clearly the begining capital was never exposed to risk. Very important for small accounts use a laverage between 100 or 200, but more important this Expert Advisor is looking by default for 5 dolars Stop Loss and a gain 1:4. We ran Scenarios and even until May 2026 with all the inestability because of the geopolitial tensions, The Expert Advisor NEVER put in danger the original capital, I used a .01 lot size and also a 100:1 laverage, with a balance of 10k.
The Challenge was bigger because is a program design to run in a 5 minute timeframe, believe me I am running it now in my real account after 2 year test, this is totally free for you I want to share for Traders important information you need to know before installing it, is free, why? I am from the Linux Red Hat Generation, where does not matter how good a software design can be, I did it with a big motivation, traders that are loosing a lot, and are considering to quit, for traders that want to realy use it and run this bot in the correct sessions, every asset is affected diferently by the market sessions, but this one is totally free, as all my software and indicator down bellow I show my real account I began in November with 198 dollars and jump to 1229.00 in three month, why? with dicipline, I will be glad if you have any questions contact me I will be glad to clarify any doubt you got about the Expert Advisors or Indicators, this is another gift from me to you, because I receive this knowledge for free so I give it free, is a community goal of help everybody . This is the data I collected from the Backtesting:
GOLD · M5 · INSTITUTIONAL STRUCTURE
EA – Floor Candle Format Doesn't Return
Expert Advisor designed to trade institutional floor zones on the GOLD M5 chart, where the price makes a low that is not retested for several candles. No martingale, no grid, just structure, probability, and risk/reward asymmetry.
Quick summary
Symbol / Timeframe
GOLD · M5
Initial deposit (backtest)
10,000 USD
Batch used in test
0.03
Net profit
+4 546.97 USD
Max. Drawdown
6.33% (balance)
Profit Factor
1.52
Strategy Tester data: “Initial Deposit: 10,000.00 – Total Net Profit: 4,546.97 – Balance Drawdown Maximal: 773.99 (6.33%) – Profit Factor: 1.52”.
System mechanics
Concept of “apartment that doesn't come back”
The EA analyzes the latest LookbackBars = 20candles on the M5 timescale.
Identify a local minimum that has not been broken by at least NoReturnBars = 6candles.
That minimum is interpreted as a floor defended by institutions .
Entry conditions
When the price returns to the floor zone, the EA expects the spread to be less than MaxSpreadPts = 50.0.
Apply a small safety buffer BufferPts = 50.0to prevent noise inputs.
If the conditions are met, open a purchase (BUY) with the configured lot.
Operations Management
Stop Loss: below the floor, respecting the buffer to avoid noise sweeps.
Take Profit: fixed target based on the typical range after the floor (R/R asymmetry).
It does not use martingale, it does not average losses, it does not open grids.
Input parameters
Batch ( Lote): position size. Backtest example: 0.03.
MagicNumber : unique identifier for the EA.
LookbackBars : number of candles used to detect the floor.
NoReturnBars : how many candles must pass without breaking the floor to validate it.
BufferPts : safety distance at points for entrances and SL.
MaxSpreadPts : maximum spread allowed to open trades.
From the report: “Inputs: Batch=0.03 – MagicNumber=777001 – LookbackBars=20 – NoReturnBars=6 – BufferPts=50.0 – MaxSpreadPts=50.0”.
Backtest results (2025)
Period
2025.01.01 – 2025.12.31
Total trades
245
Winners
33.06%
Average winning trade
$163.75
Average losing trade
-$53.15
Sharpe Ratio
2.75
Excerpt: “Total Trades: 245 – Profit Trades (% of total): 81 (33.06%) – Loss Trades: 164 (66.94%) – Average profit trade: 163.75 – Average loss trade: -53.15 – Sharpe Ratio: 2.75”.
The system does not depend on a high percentage of successes, but on a positive asymmetry between the average size of gains and losses.
Recommended risk management
The backtest with $10,000 and a 0.03 lot size shows a maximum drawdown of around 6.33% . For smaller live accounts, it is recommended to adjust the lot size to keep the risk per trade between 1% and 3% of capital.
Example: In a $300 account, do not use a lot more than 1% my advice.
Here is the Expert Advisor copy, paste and compile for Metatrader 5 is mql5 programming:
//+------------------------------------------------------------------+
//| PisoQueNoVuelve_PriceAction.mq5 |
//| EA: Piso que no vuelve – Price Action puro – RR 1:3
//| Created by Julio Viera Nieves, jvieranieves54@gmailcom |
//+------------------------------------------------------------------+
#property strict
#property description "EA Price Action puro – Piso que no vuelve – RR 1:3"
input double Lote = 0.01;
input int MagicNumber = 900777;
input int LookbackBars = 20; // velas para encontrar L0
input int NoReturnBars = 6; // velas sin volver al piso
input double BufferPts = 50; // SL debajo del piso (en puntos)
input double MaxSpreadPts = 50; // spread máximo permitido (en puntos)
datetime lastBar = 0;
//+------------------------------------------------------------------+
//| Nueva vela |
//+------------------------------------------------------------------+
bool NewBar()
{
datetime t = iTime(_Symbol, _Period, 0);
if(t != lastBar)
{
lastBar = t;
return true;
}
return false;
}
//+------------------------------------------------------------------+
//| ¿Hay compra abierta de este EA? |
//+------------------------------------------------------------------+
bool HasBuy()
{
for(int i=PositionsTotal()-1; i>=0; i--)
{
ulong tk = PositionGetTicket(i);
if(PositionSelectByTicket(tk))
{
if(PositionGetInteger(POSITION_MAGIC)==MagicNumber &&
PositionGetInteger(POSITION_TYPE)==POSITION_TYPE_BUY &&
PositionGetString(POSITION_SYMBOL)==_Symbol)
return true;
}
}
return false;
}
//+------------------------------------------------------------------+
//| Spread en puntos |
//+------------------------------------------------------------------+
double SpreadPts()
{
MqlTick t;
SymbolInfoTick(_Symbol, t);
return (t.ask - t.bid) / _Point;
}
//+------------------------------------------------------------------+
//| Detectar piso que no vuelve |
//+------------------------------------------------------------------+
bool DetectPiso(double &L0, double &entryPrice)
{
// 1. Buscar L0: mínimo más bajo de las últimas LookbackBars velas
double minP = DBL_MAX;
int minIdx = -1;
for(int i=1; i<=LookbackBars; i++)
{
double lw = iLow(_Symbol, _Period, i);
if(lw < minP)
{
minP = lw;
minIdx = i;
}
}
if(minIdx < 2) return false;
L0 = minP;
// 2. Reacción alcista: vela posterior a la bajista que hizo el piso
double prevLow = iLow(_Symbol, _Period, minIdx+1);
double prevHigh = iHigh(_Symbol, _Period, minIdx+1);
double reactClose= iClose(_Symbol,_Period, minIdx-1);
double mid = prevLow + (prevHigh - prevLow) * 0.5;
if(reactClose <= mid) return false; // no es reacción fuerte
// 3. No retorno: próximas NoReturnBars velas no deben tocar L0
for(int i=1; i<=NoReturnBars; i++)
{
if(iLow(_Symbol, _Period, i) <= L0)
return false;
}
// 4. Entrada: cierre actual rompe el máximo de la vela de reacción
double reactHigh = iHigh(_Symbol, _Period, minIdx-1);
double closeNow = iClose(_Symbol, _Period, 0);
if(closeNow > reactHigh)
{
entryPrice = closeNow;
return true;
}
return false;
}
//+------------------------------------------------------------------+
//| Abrir compra |
//+------------------------------------------------------------------+
void OpenBuy(double L0, double entry)
{
if(HasBuy()) return;
if(SpreadPts() > MaxSpreadPts) return;
MqlTick t;
SymbolInfoTick(_Symbol, t);
double price = t.ask;
double sl = L0 - BufferPts * _Point;
double R = price - sl;
if(R <= 0) return;
double tp = price + 3.0 * R;
sl = NormalizeDouble(sl, _Digits);
tp = NormalizeDouble(tp, _Digits);
price = NormalizeDouble(price, _Digits);
MqlTradeRequest req;
MqlTradeResult res;
ZeroMemory(req);
ZeroMemory(res);
req.action = TRADE_ACTION_DEAL;
req.symbol = _Symbol;
req.volume = Lote;
req.type = ORDER_TYPE_BUY;
req.price = price;
req.sl = sl;
req.tp = tp;
req.magic = MagicNumber;
req.deviation = 20;
req.type_filling= ORDER_FILLING_FOK;
if(OrderSend(req, res))
{
Comment("COMPRA EJECUTADA – Piso que no vuelve\n",
"L0: ", DoubleToString(L0,2), "\n",
"SL: ", DoubleToString(sl,2), " TP: ", DoubleToString(tp,2));
}
else
{
Comment("ERROR AL ENVIAR COMPRA – Revisar log");
}
}
//+------------------------------------------------------------------+
//| OnInit |
//+------------------------------------------------------------------+
int OnInit()
{
lastBar = iTime(_Symbol, _Period, 0);
Comment("EA Piso que no vuelve – Iniciado");
return(INIT_SUCCEEDED);
}
//+------------------------------------------------------------------+
//| OnTick |
//+------------------------------------------------------------------+
void OnTick()
{
if(!NewBar()) return;
double L0, entry;
if(DetectPiso(L0, entry))
{
Comment("PISO QUE NO VUELVE DETECTADO\n",
"L0: ", DoubleToString(L0,2), "\n",
"EntryRef: ", DoubleToString(entry,2), "\n",
"SEÑAL: COMPRA");
OpenBuy(L0, entry);
}
else
{
Comment("Escaneando piso que no vuelve...");
}
}
Enjoy the Expoert Advisor if you got doubts run it in a demo account first like I did and look the results. Peace to everyone.
The Challenge was bigger because is a program design to run in a 5 minute timeframe, believe me I am running it now in my real account after 2 year test, this is totally free for you I want to share for Traders important information you need to know before installing it, is free, why? I am from the Linux Red Hat Generation, where does not matter how good a software design can be, I did it with a big motivation, traders that are loosing a lot, and are considering to quit, for traders that want to realy use it and run this bot in the correct sessions, every asset is affected diferently by the market sessions, but this one is totally free, as all my software and indicator down bellow I show my real account I began in November with 198 dollars and jump to 1229.00 in three month, why? with dicipline, I will be glad if you have any questions contact me I will be glad to clarify any doubt you got about the Expert Advisors or Indicators, this is another gift from me to you, because I receive this knowledge for free so I give it free, is a community goal of help everybody . This is the data I collected from the Backtesting:
GOLD · M5 · INSTITUTIONAL STRUCTURE
EA – Floor Candle Format Doesn't Return
Expert Advisor designed to trade institutional floor zones on the GOLD M5 chart, where the price makes a low that is not retested for several candles. No martingale, no grid, just structure, probability, and risk/reward asymmetry.
Quick summary
Symbol / Timeframe
GOLD · M5
Initial deposit (backtest)
10,000 USD
Batch used in test
0.03
Net profit
+4 546.97 USD
Max. Drawdown
6.33% (balance)
Profit Factor
1.52
Strategy Tester data: “Initial Deposit: 10,000.00 – Total Net Profit: 4,546.97 – Balance Drawdown Maximal: 773.99 (6.33%) – Profit Factor: 1.52”.
System mechanics
Concept of “apartment that doesn't come back”
The EA analyzes the latest LookbackBars = 20candles on the M5 timescale.
Identify a local minimum that has not been broken by at least NoReturnBars = 6candles.
That minimum is interpreted as a floor defended by institutions .
Entry conditions
When the price returns to the floor zone, the EA expects the spread to be less than MaxSpreadPts = 50.0.
Apply a small safety buffer BufferPts = 50.0to prevent noise inputs.
If the conditions are met, open a purchase (BUY) with the configured lot.
Operations Management
Stop Loss: below the floor, respecting the buffer to avoid noise sweeps.
Take Profit: fixed target based on the typical range after the floor (R/R asymmetry).
It does not use martingale, it does not average losses, it does not open grids.
Input parameters
Batch ( Lote): position size. Backtest example: 0.03.
MagicNumber : unique identifier for the EA.
LookbackBars : number of candles used to detect the floor.
NoReturnBars : how many candles must pass without breaking the floor to validate it.
BufferPts : safety distance at points for entrances and SL.
MaxSpreadPts : maximum spread allowed to open trades.
From the report: “Inputs: Batch=0.03 – MagicNumber=777001 – LookbackBars=20 – NoReturnBars=6 – BufferPts=50.0 – MaxSpreadPts=50.0”.
Backtest results (2025)
Period
2025.01.01 – 2025.12.31
Total trades
245
Winners
33.06%
Average winning trade
$163.75
Average losing trade
-$53.15
Sharpe Ratio
2.75
Excerpt: “Total Trades: 245 – Profit Trades (% of total): 81 (33.06%) – Loss Trades: 164 (66.94%) – Average profit trade: 163.75 – Average loss trade: -53.15 – Sharpe Ratio: 2.75”.
The system does not depend on a high percentage of successes, but on a positive asymmetry between the average size of gains and losses.
Recommended risk management
The backtest with $10,000 and a 0.03 lot size shows a maximum drawdown of around 6.33% . For smaller live accounts, it is recommended to adjust the lot size to keep the risk per trade between 1% and 3% of capital.
Example: In a $300 account, do not use a lot more than 1% my advice.
Here is the Expert Advisor copy, paste and compile for Metatrader 5 is mql5 programming:
//+------------------------------------------------------------------+
//| PisoQueNoVuelve_PriceAction.mq5 |
//| EA: Piso que no vuelve – Price Action puro – RR 1:3
//| Created by Julio Viera Nieves, jvieranieves54@gmailcom |
//+------------------------------------------------------------------+
#property strict
#property description "EA Price Action puro – Piso que no vuelve – RR 1:3"
input double Lote = 0.01;
input int MagicNumber = 900777;
input int LookbackBars = 20; // velas para encontrar L0
input int NoReturnBars = 6; // velas sin volver al piso
input double BufferPts = 50; // SL debajo del piso (en puntos)
input double MaxSpreadPts = 50; // spread máximo permitido (en puntos)
datetime lastBar = 0;
//+------------------------------------------------------------------+
//| Nueva vela |
//+------------------------------------------------------------------+
bool NewBar()
{
datetime t = iTime(_Symbol, _Period, 0);
if(t != lastBar)
{
lastBar = t;
return true;
}
return false;
}
//+------------------------------------------------------------------+
//| ¿Hay compra abierta de este EA? |
//+------------------------------------------------------------------+
bool HasBuy()
{
for(int i=PositionsTotal()-1; i>=0; i--)
{
ulong tk = PositionGetTicket(i);
if(PositionSelectByTicket(tk))
{
if(PositionGetInteger(POSITION_MAGIC)==MagicNumber &&
PositionGetInteger(POSITION_TYPE)==POSITION_TYPE_BUY &&
PositionGetString(POSITION_SYMBOL)==_Symbol)
return true;
}
}
return false;
}
//+------------------------------------------------------------------+
//| Spread en puntos |
//+------------------------------------------------------------------+
double SpreadPts()
{
MqlTick t;
SymbolInfoTick(_Symbol, t);
return (t.ask - t.bid) / _Point;
}
//+------------------------------------------------------------------+
//| Detectar piso que no vuelve |
//+------------------------------------------------------------------+
bool DetectPiso(double &L0, double &entryPrice)
{
// 1. Buscar L0: mínimo más bajo de las últimas LookbackBars velas
double minP = DBL_MAX;
int minIdx = -1;
for(int i=1; i<=LookbackBars; i++)
{
double lw = iLow(_Symbol, _Period, i);
if(lw < minP)
{
minP = lw;
minIdx = i;
}
}
if(minIdx < 2) return false;
L0 = minP;
// 2. Reacción alcista: vela posterior a la bajista que hizo el piso
double prevLow = iLow(_Symbol, _Period, minIdx+1);
double prevHigh = iHigh(_Symbol, _Period, minIdx+1);
double reactClose= iClose(_Symbol,_Period, minIdx-1);
double mid = prevLow + (prevHigh - prevLow) * 0.5;
if(reactClose <= mid) return false; // no es reacción fuerte
// 3. No retorno: próximas NoReturnBars velas no deben tocar L0
for(int i=1; i<=NoReturnBars; i++)
{
if(iLow(_Symbol, _Period, i) <= L0)
return false;
}
// 4. Entrada: cierre actual rompe el máximo de la vela de reacción
double reactHigh = iHigh(_Symbol, _Period, minIdx-1);
double closeNow = iClose(_Symbol, _Period, 0);
if(closeNow > reactHigh)
{
entryPrice = closeNow;
return true;
}
return false;
}
//+------------------------------------------------------------------+
//| Abrir compra |
//+------------------------------------------------------------------+
void OpenBuy(double L0, double entry)
{
if(HasBuy()) return;
if(SpreadPts() > MaxSpreadPts) return;
MqlTick t;
SymbolInfoTick(_Symbol, t);
double price = t.ask;
double sl = L0 - BufferPts * _Point;
double R = price - sl;
if(R <= 0) return;
double tp = price + 3.0 * R;
sl = NormalizeDouble(sl, _Digits);
tp = NormalizeDouble(tp, _Digits);
price = NormalizeDouble(price, _Digits);
MqlTradeRequest req;
MqlTradeResult res;
ZeroMemory(req);
ZeroMemory(res);
req.action = TRADE_ACTION_DEAL;
req.symbol = _Symbol;
req.volume = Lote;
req.type = ORDER_TYPE_BUY;
req.price = price;
req.sl = sl;
req.tp = tp;
req.magic = MagicNumber;
req.deviation = 20;
req.type_filling= ORDER_FILLING_FOK;
if(OrderSend(req, res))
{
Comment("COMPRA EJECUTADA – Piso que no vuelve\n",
"L0: ", DoubleToString(L0,2), "\n",
"SL: ", DoubleToString(sl,2), " TP: ", DoubleToString(tp,2));
}
else
{
Comment("ERROR AL ENVIAR COMPRA – Revisar log");
}
}
//+------------------------------------------------------------------+
//| OnInit |
//+------------------------------------------------------------------+
int OnInit()
{
lastBar = iTime(_Symbol, _Period, 0);
Comment("EA Piso que no vuelve – Iniciado");
return(INIT_SUCCEEDED);
}
//+------------------------------------------------------------------+
//| OnTick |
//+------------------------------------------------------------------+
void OnTick()
{
if(!NewBar()) return;
double L0, entry;
if(DetectPiso(L0, entry))
{
Comment("PISO QUE NO VUELVE DETECTADO\n",
"L0: ", DoubleToString(L0,2), "\n",
"EntryRef: ", DoubleToString(entry,2), "\n",
"SEÑAL: COMPRA");
OpenBuy(L0, entry);
}
else
{
Comment("Escaneando piso que no vuelve...");
}
}
Enjoy the Expoert Advisor if you got doubts run it in a demo account first like I did and look the results. Peace to everyone.
Julio Viera

We have taken a very powerful tool of Trading from the Youtube Channel Creemos Capital, and I was working very hard on it for almost a year and using all their wise procedures, I adapt my knowledge to this powerful trading Strategy called the C4 and evolve for me what I called the J5. The J5 could not exist without the powerful base and analysis of the C4 Trading Strategy created by Creemos Capital. I want to thanks all the Master Traders that are everyday with us 21 hours doing what we love the most our passion that move us, the Investment Markets. So thanks to their Strategy, adding some other specifications we really got a strong Strategy. Without the C4 of Creemos Capital, there will be no J5. Reminds me one day a Theology professor said "Without the Greek, the New Testament will not exist how we know it today". Thanks to Creemos Capital for teaching for free their strategy so I will share for free the additions I made, in this way I pay respect to the brilliant founders of Creemos Capital, "What I receive free, free I will give it".
Julio Viera
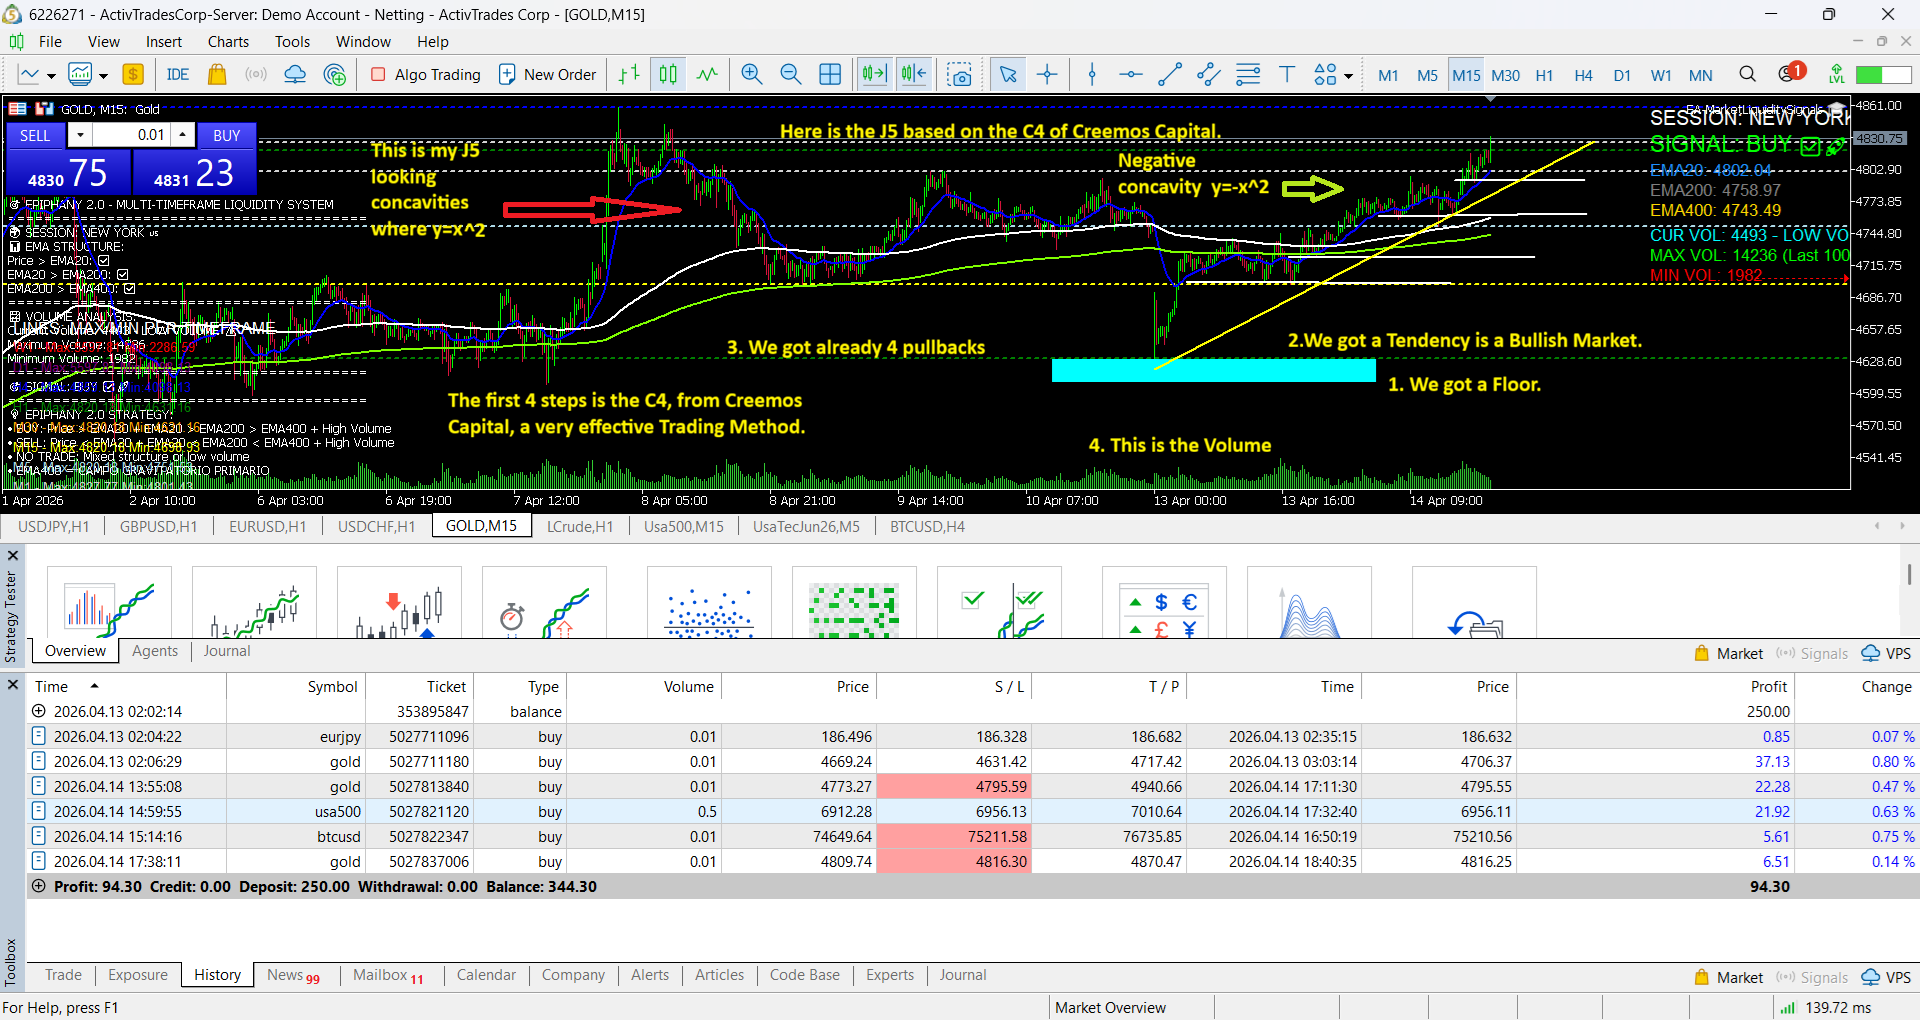
Hi as always sharing for free my insights of trading that are really effective and this is how we grow up in a few days a 250 demo account, so I using the C4 that is "Creemos Capital" trading method that consist in 4 steps:
1. Check the Tendency
2. Find a support or resistance.
3. Check the Price Action(Dow Law)
4. and the Volume very important part.
Once you got this I add my own strategy because what really give a real turn to this method is checking the concavity of the Ema 20, 200,400, They have to be all in an example for a Bullish Market you will see the Ema 20 Concavity, is a quadratic Equation where we only will focus in the first variable a^2, this is important because when bullish market happends every time, you will see a negative concavity where the price will use the Ema 20 as the dynamic support, and the equation is y=-X^2, for this to happened, if you got the 4 steps but the Ema 20 is horizontal, I discard inmediately the transaction, the concavity is the reaction of the Institutional Markets are present, not retail traders, is what make that Bullish Market go for weeks or Month in a Trend when you see it in a Daily Basis. And is the contrary for the Sales the concave in Ema 20 will be positive y=x^2. And the Emas will create a fan where Ema 400>200>40>20 you will notice the price using Ema 20 as a dynamic resistance and the price will be falling and you will take the money because not only the positions of the Ema and the Price, because the Ema 20 will be positive, so it will go down, the price will traspass the Ema and will never comeback because the Institutional Sellers are there, waiting for selling the Gold in a High Price, while the Institutions are waiting to buy when is oversold, and the others will wait until the asset is overbought, so keep that in mind, this lines are the game changer in trading I got the data of today with 0 losses.
So J5 is that extra component I use with the "C4" trading strategy build by the channel Creemos Capital on youtube, where there are more than 16k traders suscribed in less than a year. and the C4 it sellf is very effective, the concave part I am adding is to got this ridiculous winrate I got 0 loss in this days, but of course I do not take any transaction, so I also see the concavity , if the concavity is good I take it, is the concavity of Ema 20 is flattened noooooooooooo!!! That is giving money to somebody else. And here is the data I have being building these days:
📊 Strategy Insights: The J5 Protocol (Price Action & Dynamic Risk Management)Developer: Julio VieraSession Date: April 14, 2026Instruments: XAUUSD, USA500, BTCUSDPerformance: +$94.30 Net Profit (37.7% Account Growth)1. The J5 PhilosophyThe J5 Protocol is built on the core principles of Dow Theory and market structure, moving away from lagging indicators and focusing on real-time price delivery.Trend Identification: We only engage with high-velocity institutional flows.The Pullback Trigger: Entries are precision-timed during retracements. For instance, today’s gold long was executed on the 4th pullback, confirming trend exhaustion from sellers and a high-probability continuation.Selective Filtering: If market structure or volume is absent (as seen with Oil today), the protocol dictates a Flat Position. Capital preservation is our primary yield.2. Execution & Risk ShieldingThe hallmark of J5 is Dynamic Profit Protection:Aggressive Trailing Stops: Once the price clears a specific point threshold, the Stop Loss is converted into a Guaranteed Profit Lock.Statistical Efficiency: Today’s session yielded an Expected Payoff of $15.72 per trade.Win Rate: 6/6 (100%). This consistency is achieved by treating trading like a network protocol: if the handshake isn't perfect, the connection isn't made.3. Key Performance Indicators (Session Snapshots)MetricValueBeginning Balance$250.00Current Balance$344.30Total Net Profit$94.30Profit FactorMAX (Zero losses)Margin Level827.65% - 1913.43%📸 Recommended Uploads for your MQL5 post:The "Detailed Report" Tab: Make sure to capture the part where it says "Long Trades (won %): 100%". That number alone is a magnet for serious investors.The Gold (XAUUSD) Entry: If you have the chart with the arrow where the J5 triggered that $22.28 move, upload it. It shows you didn't just get lucky; you entered exactly where the "smart money" did.Author's Note: > "Trading, much like a complex 7/4 musical composition, is about rhythm and structure. The J5 Protocol removes the noise, allowing the trader to execute with the precision of a metronome."
1. Check the Tendency
2. Find a support or resistance.
3. Check the Price Action(Dow Law)
4. and the Volume very important part.
Once you got this I add my own strategy because what really give a real turn to this method is checking the concavity of the Ema 20, 200,400, They have to be all in an example for a Bullish Market you will see the Ema 20 Concavity, is a quadratic Equation where we only will focus in the first variable a^2, this is important because when bullish market happends every time, you will see a negative concavity where the price will use the Ema 20 as the dynamic support, and the equation is y=-X^2, for this to happened, if you got the 4 steps but the Ema 20 is horizontal, I discard inmediately the transaction, the concavity is the reaction of the Institutional Markets are present, not retail traders, is what make that Bullish Market go for weeks or Month in a Trend when you see it in a Daily Basis. And is the contrary for the Sales the concave in Ema 20 will be positive y=x^2. And the Emas will create a fan where Ema 400>200>40>20 you will notice the price using Ema 20 as a dynamic resistance and the price will be falling and you will take the money because not only the positions of the Ema and the Price, because the Ema 20 will be positive, so it will go down, the price will traspass the Ema and will never comeback because the Institutional Sellers are there, waiting for selling the Gold in a High Price, while the Institutions are waiting to buy when is oversold, and the others will wait until the asset is overbought, so keep that in mind, this lines are the game changer in trading I got the data of today with 0 losses.
So J5 is that extra component I use with the "C4" trading strategy build by the channel Creemos Capital on youtube, where there are more than 16k traders suscribed in less than a year. and the C4 it sellf is very effective, the concave part I am adding is to got this ridiculous winrate I got 0 loss in this days, but of course I do not take any transaction, so I also see the concavity , if the concavity is good I take it, is the concavity of Ema 20 is flattened noooooooooooo!!! That is giving money to somebody else. And here is the data I have being building these days:
📊 Strategy Insights: The J5 Protocol (Price Action & Dynamic Risk Management)Developer: Julio VieraSession Date: April 14, 2026Instruments: XAUUSD, USA500, BTCUSDPerformance: +$94.30 Net Profit (37.7% Account Growth)1. The J5 PhilosophyThe J5 Protocol is built on the core principles of Dow Theory and market structure, moving away from lagging indicators and focusing on real-time price delivery.Trend Identification: We only engage with high-velocity institutional flows.The Pullback Trigger: Entries are precision-timed during retracements. For instance, today’s gold long was executed on the 4th pullback, confirming trend exhaustion from sellers and a high-probability continuation.Selective Filtering: If market structure or volume is absent (as seen with Oil today), the protocol dictates a Flat Position. Capital preservation is our primary yield.2. Execution & Risk ShieldingThe hallmark of J5 is Dynamic Profit Protection:Aggressive Trailing Stops: Once the price clears a specific point threshold, the Stop Loss is converted into a Guaranteed Profit Lock.Statistical Efficiency: Today’s session yielded an Expected Payoff of $15.72 per trade.Win Rate: 6/6 (100%). This consistency is achieved by treating trading like a network protocol: if the handshake isn't perfect, the connection isn't made.3. Key Performance Indicators (Session Snapshots)MetricValueBeginning Balance$250.00Current Balance$344.30Total Net Profit$94.30Profit FactorMAX (Zero losses)Margin Level827.65% - 1913.43%📸 Recommended Uploads for your MQL5 post:The "Detailed Report" Tab: Make sure to capture the part where it says "Long Trades (won %): 100%". That number alone is a magnet for serious investors.The Gold (XAUUSD) Entry: If you have the chart with the arrow where the J5 triggered that $22.28 move, upload it. It shows you didn't just get lucky; you entered exactly where the "smart money" did.Author's Note: > "Trading, much like a complex 7/4 musical composition, is about rhythm and structure. The J5 Protocol removes the noise, allowing the trader to execute with the precision of a metronome."
Julio Viera
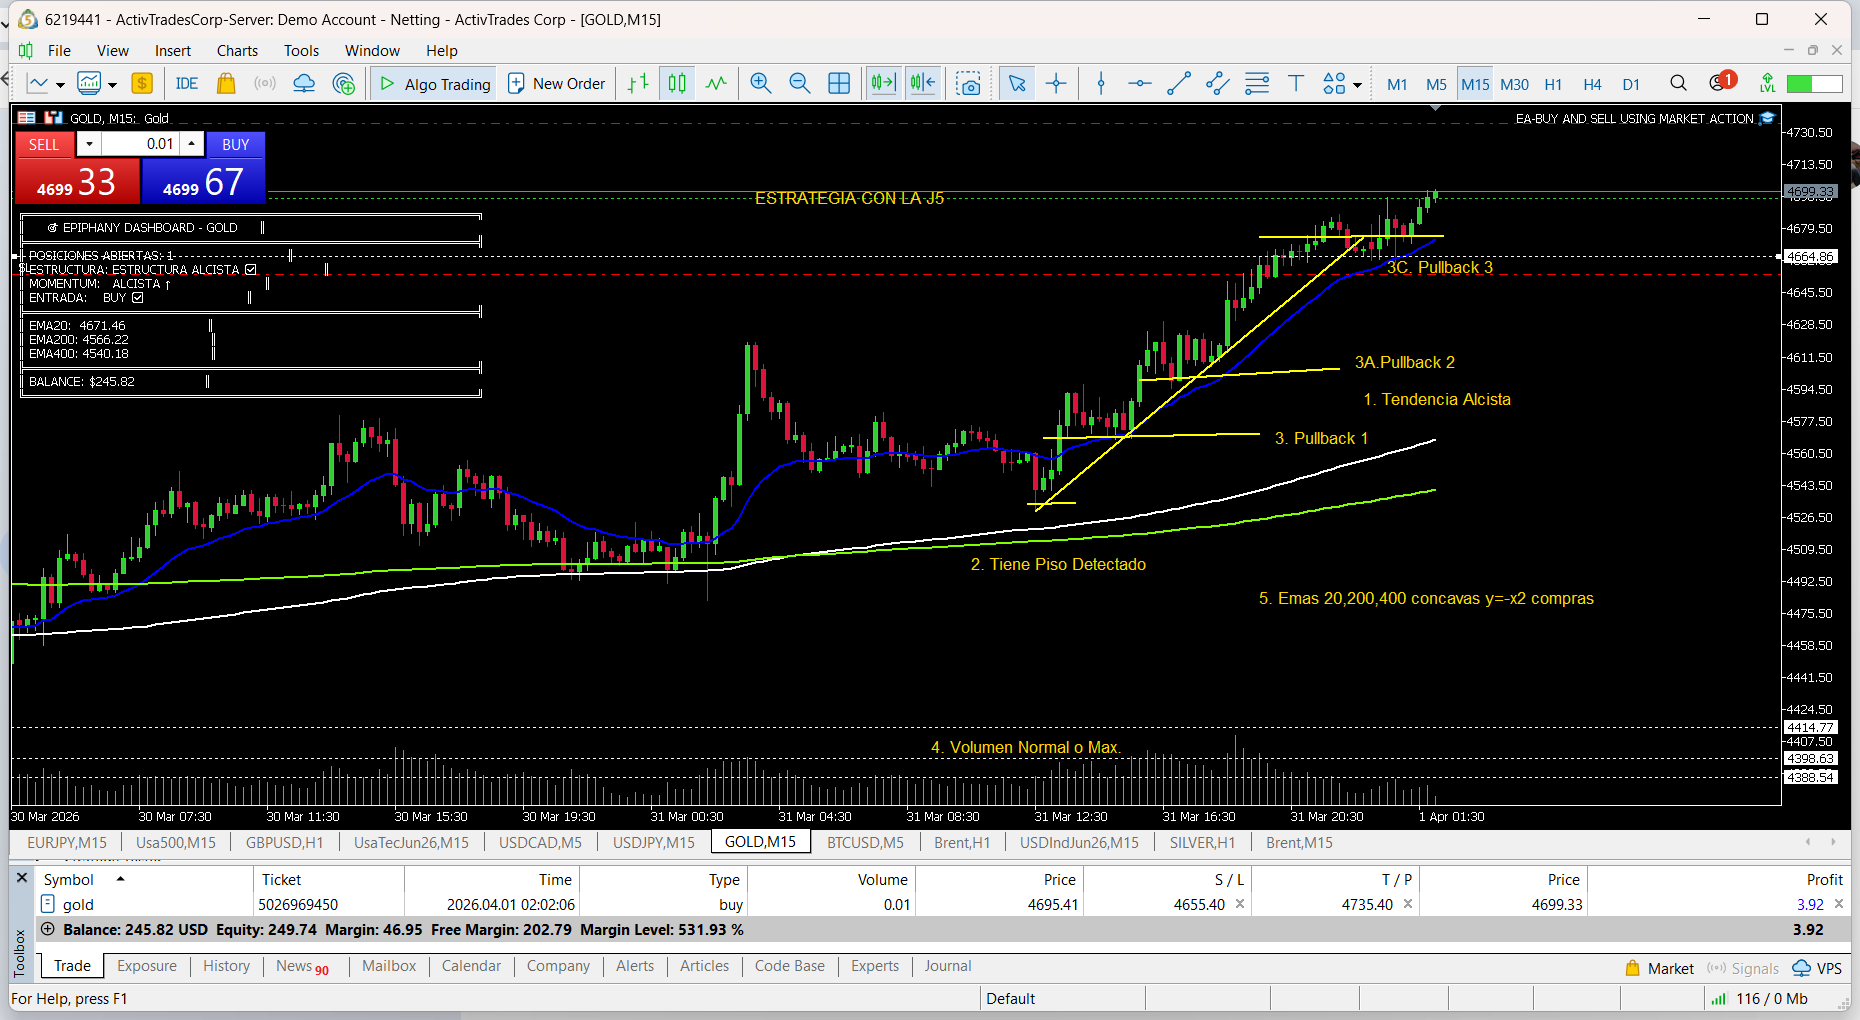
The program bellow will work perfectly I am using it in may own account already, but you will need the comments for my program, I create a custom indicator to install it is very easy :
1. Open your Metatrader 5 software
2. Press f4
3. This will bring where the code is generated.
4. Go to New and in the choices select Custom indicator.
5. And go next and next until is finished
Copy and Paste this indicator name it "Epiphany-Dashboard"
Then Press F7 to compile it. And that is all. Here is the code for free:
//+------------------------------------------------------------------+
//| Epiphany_Dashboard.mq5 |
//| Dashboard Visual para EA |
//| No interfiere con trading|
//+------------------------------------------------------------------+
#property copyright "Epiphany Trading"
#property version "1.0"
#property indicator_chart_window
#property indicator_buffers 0
#property indicator_plots 0
// Parámetros (deben coincidir con los del EA)
input int ema20Period = 20;
input int ema200Period = 200;
input int ema400Period = 400;
input int MomentumPeriod = 6;
// Handlers
int h20, h200, h400;
double b20[], b200[], b400[];
double closePrices[];
//+------------------------------------------------------------------+
//| Custom indicator initialization function |
//+------------------------------------------------------------------+
int OnInit()
{
ArraySetAsSeries(b20, true);
ArraySetAsSeries(b200, true);
ArraySetAsSeries(b400, true);
ArraySetAsSeries(closePrices, true);
h20 = iMA(_Symbol, _Period, ema20Period, 0, MODE_EMA, PRICE_CLOSE);
h200 = iMA(_Symbol, _Period, ema200Period, 0, MODE_EMA, PRICE_CLOSE);
h400 = iMA(_Symbol, _Period, ema400Period, 0, MODE_EMA, PRICE_CLOSE);
return(INIT_SUCCEEDED);
}
//+------------------------------------------------------------------+
//| Custom indicator iteration function |
//+------------------------------------------------------------------+
int OnCalculate(const int rates_total,
const int prev_calculated,
const datetime &time[],
const double &open[],
const double &high[],
const double &low[],
const double &close[],
const long &tick_volume[],
const long &volume[],
const int &spread[])
{
// Copiar EMAs
if(CopyBuffer(h20, 0, 0, 2, b20) < 2) return(0);
if(CopyBuffer(h200, 0, 0, 2, b200) < 2) return(0);
if(CopyBuffer(h400, 0, 0, 2, b400) < 2) return(0);
// Copiar precios para momentum
if(CopyClose(_Symbol, _Period, 0, MomentumPeriod+1, closePrices) < MomentumPeriod+1) return(0);
// Calcular estructuras
bool fanBullish = (b20[1] > b200[1] && b200[1] > b400[1]);
bool fanBearish = (b20[1] < b200[1] && b200[1] < b400[1]);
bool momentumBullish = (closePrices[0] > closePrices[MomentumPeriod]);
bool momentumBearish = (closePrices[0] < closePrices[MomentumPeriod]);
// Estado de estructura
string status = "ESPERANDO ABANICO ⏸️";
if(fanBullish) status = "ESTRUCTURA ALCISTA ✅";
if(fanBearish) status = "ESTRUCTURA BAJISTA ❌";
string momentumStatus = "NEUTRO";
if(momentumBullish) momentumStatus = "ALCISTA ↑";
if(momentumBearish) momentumStatus = "BAJISTA ↓";
// Condición de entrada (solo visual)
string entryCondition = "NO";
if(fanBullish && momentumBullish && closePrices[1] > b20[1]) entryCondition = "BUY ✅";
if(fanBearish && momentumBearish && closePrices[1] < b20[1]) entryCondition = "SELL ✅";
// Mostrar dashboard
Comment("╔══════════════════════════════════════════════════╗\n" +
"║ 🎯 EPIPHANY DASHBOARD - " + _Symbol + " ║\n" +
"╠══════════════════════════════════════════════════╣\n" +
"║ POSICIONES ABIERTAS: " + IntegerToString(PositionsTotal()) + " ║\n" +
"║ ESTRUCTURA: " + status + " ║\n" +
"║ MOMENTUM: " + momentumStatus + " ║\n" +
"║ ENTRADA: " + entryCondition + " ║\n" +
"╠══════════════════════════════════════════════════╣\n" +
"║ EMA20: " + DoubleToString(b20[1], _Digits) + " ║\n" +
"║ EMA200: " + DoubleToString(b200[1], _Digits) + " ║\n" +
"║ EMA400: " + DoubleToString(b400[1], _Digits) + " ║\n" +
"╠══════════════════════════════════════════════════╣\n" +
"║ BALANCE: $" + DoubleToString(AccountInfoDouble(ACCOUNT_BALANCE), 2) + " ║\n" +
"╚══════════════════════════════════════════════════╝");
return(rates_total);
}
//+------------------------------------------------------------------+
//| Deinitialization |
//+------------------------------------------------------------------+
void OnDeinit(const int reason)
{
Comment(""); // Limpiar al cerrar
}
//+------------------------------------------------------------------+
The Expert Advisor plus this indicator your Screen will look like this so you will have the Expert Advisor at your right above and you will see the Comment Screen Indicator as a Dashboard Indicator at your left and will tell you the balance and the values of your Emas and Equity. Enjoy is totally free why, I am a guy from the generation of Linux Red Hat Administrator, we do programming for the community, I am a trader and programmers, so you are my family. Everything Ill be doing is for free and it will be published here with zero cost.
1. Open your Metatrader 5 software
2. Press f4
3. This will bring where the code is generated.
4. Go to New and in the choices select Custom indicator.
5. And go next and next until is finished
Copy and Paste this indicator name it "Epiphany-Dashboard"
Then Press F7 to compile it. And that is all. Here is the code for free:
//+------------------------------------------------------------------+
//| Epiphany_Dashboard.mq5 |
//| Dashboard Visual para EA |
//| No interfiere con trading|
//+------------------------------------------------------------------+
#property copyright "Epiphany Trading"
#property version "1.0"
#property indicator_chart_window
#property indicator_buffers 0
#property indicator_plots 0
// Parámetros (deben coincidir con los del EA)
input int ema20Period = 20;
input int ema200Period = 200;
input int ema400Period = 400;
input int MomentumPeriod = 6;
// Handlers
int h20, h200, h400;
double b20[], b200[], b400[];
double closePrices[];
//+------------------------------------------------------------------+
//| Custom indicator initialization function |
//+------------------------------------------------------------------+
int OnInit()
{
ArraySetAsSeries(b20, true);
ArraySetAsSeries(b200, true);
ArraySetAsSeries(b400, true);
ArraySetAsSeries(closePrices, true);
h20 = iMA(_Symbol, _Period, ema20Period, 0, MODE_EMA, PRICE_CLOSE);
h200 = iMA(_Symbol, _Period, ema200Period, 0, MODE_EMA, PRICE_CLOSE);
h400 = iMA(_Symbol, _Period, ema400Period, 0, MODE_EMA, PRICE_CLOSE);
return(INIT_SUCCEEDED);
}
//+------------------------------------------------------------------+
//| Custom indicator iteration function |
//+------------------------------------------------------------------+
int OnCalculate(const int rates_total,
const int prev_calculated,
const datetime &time[],
const double &open[],
const double &high[],
const double &low[],
const double &close[],
const long &tick_volume[],
const long &volume[],
const int &spread[])
{
// Copiar EMAs
if(CopyBuffer(h20, 0, 0, 2, b20) < 2) return(0);
if(CopyBuffer(h200, 0, 0, 2, b200) < 2) return(0);
if(CopyBuffer(h400, 0, 0, 2, b400) < 2) return(0);
// Copiar precios para momentum
if(CopyClose(_Symbol, _Period, 0, MomentumPeriod+1, closePrices) < MomentumPeriod+1) return(0);
// Calcular estructuras
bool fanBullish = (b20[1] > b200[1] && b200[1] > b400[1]);
bool fanBearish = (b20[1] < b200[1] && b200[1] < b400[1]);
bool momentumBullish = (closePrices[0] > closePrices[MomentumPeriod]);
bool momentumBearish = (closePrices[0] < closePrices[MomentumPeriod]);
// Estado de estructura
string status = "ESPERANDO ABANICO ⏸️";
if(fanBullish) status = "ESTRUCTURA ALCISTA ✅";
if(fanBearish) status = "ESTRUCTURA BAJISTA ❌";
string momentumStatus = "NEUTRO";
if(momentumBullish) momentumStatus = "ALCISTA ↑";
if(momentumBearish) momentumStatus = "BAJISTA ↓";
// Condición de entrada (solo visual)
string entryCondition = "NO";
if(fanBullish && momentumBullish && closePrices[1] > b20[1]) entryCondition = "BUY ✅";
if(fanBearish && momentumBearish && closePrices[1] < b20[1]) entryCondition = "SELL ✅";
// Mostrar dashboard
Comment("╔══════════════════════════════════════════════════╗\n" +
"║ 🎯 EPIPHANY DASHBOARD - " + _Symbol + " ║\n" +
"╠══════════════════════════════════════════════════╣\n" +
"║ POSICIONES ABIERTAS: " + IntegerToString(PositionsTotal()) + " ║\n" +
"║ ESTRUCTURA: " + status + " ║\n" +
"║ MOMENTUM: " + momentumStatus + " ║\n" +
"║ ENTRADA: " + entryCondition + " ║\n" +
"╠══════════════════════════════════════════════════╣\n" +
"║ EMA20: " + DoubleToString(b20[1], _Digits) + " ║\n" +
"║ EMA200: " + DoubleToString(b200[1], _Digits) + " ║\n" +
"║ EMA400: " + DoubleToString(b400[1], _Digits) + " ║\n" +
"╠══════════════════════════════════════════════════╣\n" +
"║ BALANCE: $" + DoubleToString(AccountInfoDouble(ACCOUNT_BALANCE), 2) + " ║\n" +
"╚══════════════════════════════════════════════════╝");
return(rates_total);
}
//+------------------------------------------------------------------+
//| Deinitialization |
//+------------------------------------------------------------------+
void OnDeinit(const int reason)
{
Comment(""); // Limpiar al cerrar
}
//+------------------------------------------------------------------+
The Expert Advisor plus this indicator your Screen will look like this so you will have the Expert Advisor at your right above and you will see the Comment Screen Indicator as a Dashboard Indicator at your left and will tell you the balance and the values of your Emas and Equity. Enjoy is totally free why, I am a guy from the generation of Linux Red Hat Administrator, we do programming for the community, I am a trader and programmers, so you are my family. Everything Ill be doing is for free and it will be published here with zero cost.
Julio Viera
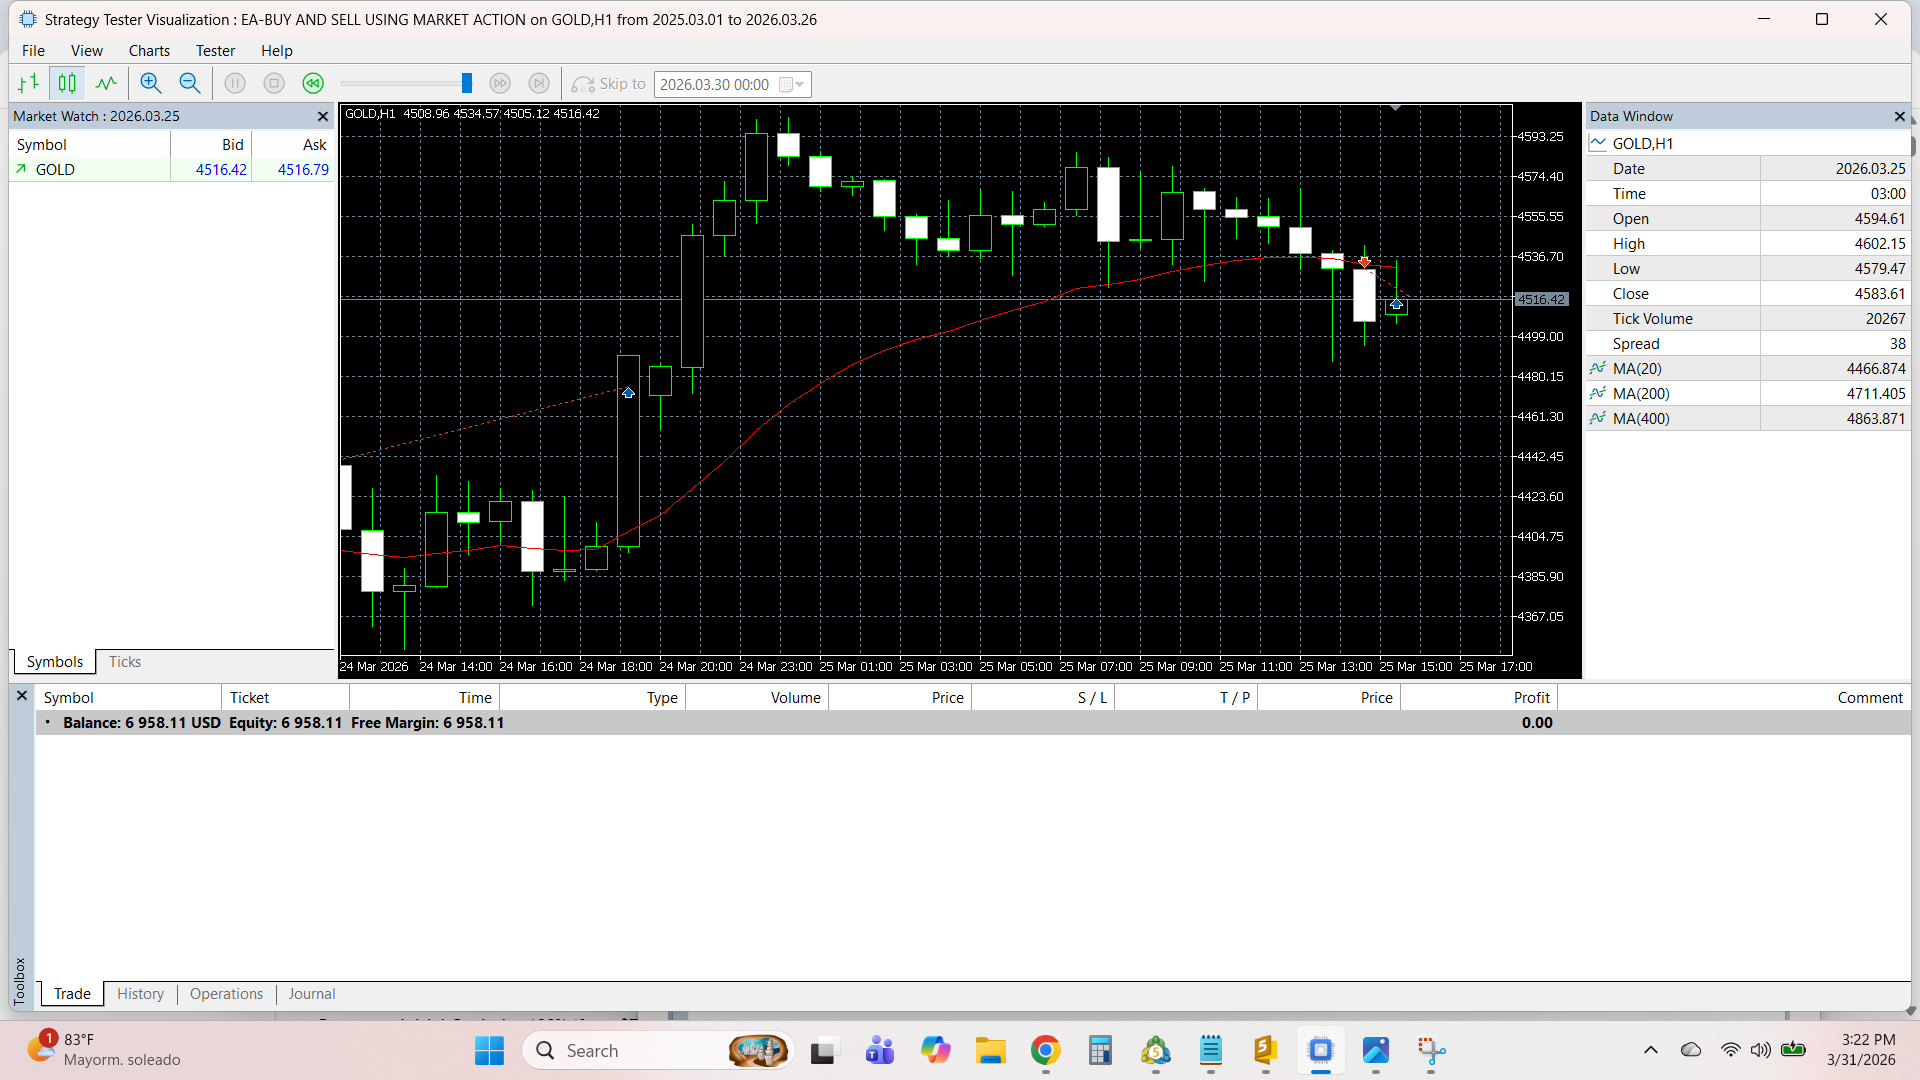
Well my friends I have really busy working this for you. Is free, why ? I belong to the generetional group of dudes of the 90's when Linux Red Hat came out. I believe that your talents I got for free from God, I have to share them with all of you. This is really a game changer I can tell. Use it wisely follow the manual and copy, paste the software and compile for MetaTrader 5.
This is the White Paper of the Backtest of one year:
Open Source Trading System
Epiphany 2.0
The Geometric Trading System
EMA20 · EMA200 · EMA400
Version 2.0 | Released: March 2026 | Author: Julio Henrique Viera Nieves
📄 White Paper
1. Philosophy & Core Principles
Epiphany Trading is not merely a trading system. It is a geometric worldview of the market. We do not trade price; we trade the geometry of market space-time. Our battlefield is microstructure (M1–M5), but our compass is the temporal hierarchy: the divine will (Weekly), the institutional mandate (Daily), the fund strategy (H4), and our tactical execution (M1–M5).
“Freely you have received, freely give.” (Matthew 10:8). This system was built on the principles of open-source collaboration: knowledge shared, code liberated, community built. Inspired by Linux philosophy and the grace of God, Epiphany 2.0 is offered free to the global trading community.
2. The Three Sacred Pillars (Revised)
1. The Concavity of EMA20
Buy (y = –x²): Pronounced negative concavity. Price "rides" the EMA20 as dynamic support. Entry on the first solid candle without long wicks.
Sell (y = x²): Pronounced positive concavity. Price "slides" along EMA20 as dynamic resistance.
2. Institutional Geography of Liquidity
Supports and resistances are not lines; they are institutional order camps. A "double top" is a wall of global sell orders. We reject any entry that does not originate from these strategic levels.
3. Mental Accounting Architecture
Sacred Capital ($150): Untouchable. It is the seed and monument to the origin.
Game Capital (Accumulated Profits): The only capital exposed. We trade with the house's money.
3. The EMA Structure – Epiphany 2.0 Evolution
After rigorous backtesting and real-market validation (including the February 2026 correction), we removed the noise-generating EMA40 and EMA80. The new structure is cleaner, more institutional, and more reliable in difficult markets:
Moving Average Role Function
EMA20 Entry Surface Defines tactical concavity. Entry on solid candles with correct curvature.
EMA200 Institutional Support/Resistance Confirms direction. Acts as major liquidity zone.
EMA400 Primary Gravitational Field The ultimate filter. If EMA400 is flat or against the trade direction, no signal is valid.
4. Backtest Results – Validation (March 2025 – March 2026)
+131.9%
Total Net Profit
1.78
Profit Factor
64.8%
Win Rate
2.56
Sharpe Ratio
11
Max Consecutive Wins
$412.68
Largest Win
Metric Value Interpretation
Initial Deposit $3,000
Final Balance $6,958.11 +132% growth in 1 year
Gross Profit $9,051.34
Gross Loss -$5,093.23
Max Drawdown (Equity) 35.5% Controlled and recoverable
Recovery Factor 2.85 System rebounds strongly after losses
Long Trades Won 66.7% Strong alignment with bullish trends
Key Insight: The system captured the major moves of 2025–2026 (including the gold rally) while remaining flat during the February 2026 correction when EMA400 was misaligned. Discipline is the edge.
5. Market Session & Volume Filters
Epiphany 2.0 integrates session detection and volume analysis to avoid low-liquidity traps:
Sessions: Asia (00:00–09:00), Europe (08:00–17:00), New York (14:30–21:00). Outside these hours, signals are filtered.
Volume Lookback: 25 candles. High volume confirms institutional participation. Low volume = caution or no trade.
Dashboard: Real-time display of current session, signal, EMA values, and volume status directly on chart.
6. Risk Management – Mental Accounting
Sacred Capital ($150): Never risked. It is your seed.
Game Capital: The only capital exposed. Trade with profits from the house.
Margin Rule: If margin used exceeds 50% of Game Capital, the broker becomes your ultimate stop-loss. This eliminates panic.
📖 User Manual – Epiphany 2.0
1. Installation
Download the Epiphany_2.0.ex5 file from the official repository or MQL5 page.
Copy the file to your MetaTrader 5 MQL5/Experts folder.
Restart MetaTrader 5 or refresh the Navigator (right-click → Refresh).
Drag the EA onto a chart (recommended: GOLD/XAUUSD, H1 timeframe).
In the Common tab, check “Allow Algo Trading”.
2. Input Parameters
Parameter Default Description
InpTPPoints 10000 Take Profit in points (10000 points = $100 for standard lot)
InpSLPoints 10000 Stop Loss in points
InpLotSize 0.02 Base lot size (adjust to account size)
MomentumPeriod 6 Momentum filter period
ema20Period 20 Fast EMA (entry surface)
ema200Period 200 Institutional EMA
ema400Period 400 Gravitational field EMA
volume_lookback 25 Number of candles for volume analysis
show_max_min true Show max/min levels across timeframes
3. Trading Logic – Entry Conditions
BUY Signal (✅):
Price > EMA20
EMA20 > EMA200 > EMA400 (bullish structure)
Volume is normal or high
Market session is active (Asia/Europe/NY)
SELL Signal (❌):
Price < EMA20
EMA20 < EMA200 < EMA400 (bearish structure)
Volume is normal or high
Market session is active
NO TRADE (⏸️): Mixed structure, low volume, or session outside major liquidity.
4. Interpreting the Dashboard
The EA displays on the top-right corner of your chart:
SESSION: Current market session (ASIA/EUROPE/NEW YORK/LOW LIQUIDITY)
SIGNAL: BUY / SELL / NO TRADE with color coding
EMA20 / EMA200 / EMA400: Current values of each moving average
CUR VOL: Current tick volume with status (HIGH/NORMAL/LOW)
MAX / MIN VOL: Volume extremes in lookback period
Additionally, max/min levels for M1, M5, M15, M30, H1, H4, D1, W1 are drawn as horizontal dashed lines to identify institutional liquidity zones.
5. Position Sizing & Risk Management
Rule of Thumb: Risk no more than 2–5% of Game Capital per trade. With $200 capital, lot size should be 0.01 (or 0.001 if available). Adjust TP/SL according to market volatility. The EA’s default 10000 points is suitable for H1 trends; for smaller accounts, reduce to 5000–7000 points.
“If the EMAs maintain their concavity and alignment, the market is only breathing.” Consolidation is part of the journey. Do not force trades.
6. FAQ & Troubleshooting
Q: Why does the EA sometimes stay flat for days/weeks?
A: That’s by design. When EMA400 is misaligned or volume is low, the EA remains silent. Patience is part of the strategy.
Q: Can I use it on other instruments?
A: Yes. Epiphany works on any trending instrument (forex majors, indices, commodities). However, backtest first.
Q: What timeframe should I use?
A: H1 is the recommended timeframe for the EA. Signal logic is based on H1 bars; lower timeframes are used for visualization only.
Q: How do I adjust lot size for my account?
A: Modify the InpLotSize parameter. For accounts under $500, use 0.01. For $500–$2000, use 0.02. Never risk more than 5% of capital per trade.
7. Philosophy – The CEO Mindset
You are not a trader placing positions. You are the CEO of a holding company where each trade is a subsidiary, each hedging block is a sector, and your account is the consolidated financial statement.
“I didn’t lose $500 on a trade. One of my subsidiaries had an operational loss of $500.”
This mental shift eliminates emotional trading and empowers rational decision-making.
8. Final Remarks – Free as in Freedom
This system was built on the shoulders of giants: the Linux open-source community, the wisdom of institutional traders, and the grace of God. It is released free of charge to the global trading community. Use it, improve it, share it. “Freely you have received, freely give.” (Matthew 10:8)
May the geometry of the market guide you. May discipline preserve you. And may the community multiply the knowledge.
© 2026 Julio Henrique Viera Nieves – Epiphany Trading
Contact: jvieranieves54@gmail.com
Disclaimer: Past performance does not guarantee future results. Trading CFDs involves significant risk and may not be suitable for all investors. Always test thoroughly on demo before live trading.
Fiat Voluntas Tua
And here is the Code for you for free nothing to pay enjoy and be a profitable trader, watch the software, learn dicipline, my recomendation use it with a .01 of lotesize if you account is small and you are going to invest on metals, I have here information how I turned 200 to 1129 dollars from November 20 2025 to January 31, 2026. Enjoy my friends
Expert Advisor :
//+------------------------------------------------------------------+
//| EPIPHANY 2.2 EA |
//| MULTI-TIMEFRAME LIQUIDITY & AUTOMATIC TRADING SYSTEM |
//| por Julio Henrique Viera Nieves jvieranieves@gmail.com |
//| Versión: 2.2 - Full Integration (EMA 20, 200, 400 + Momentum 6) |
//+------------------------------------------------------------------+
#property copyright "Epiphany Trading - Julio Viera"
#property link "https://www.mql5.com"
#property version "2.2"
#property strict
// Librería de Trade obligatoria
#include
//=========================== CONFIGURACIÓN DE TRADING =====================
input group "PARAMETROS DE EJECUCIÓN"
input int InpTPPoints = 10000; // Take Profit en Puntos (1:1)
input int InpSLPoints = 10000; // Stop Loss en Puntos (1:1)
input double InpLotSize = 0.01; // Tamaño del Lote
input int MomentumPeriod = 6; // Regla Precio[0] vs Precio[6]
input group "CONFIGURACIÓN DE EMAS"
input int ema20Period = 20; // EMA Rápida (Entrada)
input int ema200Period = 200; // EMA Institucional
input int ema400Period = 400; // EMA Campo Gravitatorio
input group "VISUALIZACIÓN"
input color color_ema20 = clrDodgerBlue;
input color color_ema200 = clrGray;
input color color_ema400 = clrGold;
//--- Variables Globales
CTrade trade;
int h20, h200, h400;
double b20[], b200[], b400[];
//+------------------------------------------------------------------+
//| Expert initialization function |
//+------------------------------------------------------------------+
int OnInit()
{
// Configurar arrays como series de tiempo (0 es la vela actual)
ArraySetAsSeries(b20, true);
ArraySetAsSeries(b200, true);
ArraySetAsSeries(b400, true);
// Inicializar Handlers
h20 = iMA(_Symbol, _Period, ema20Period, 0, MODE_EMA, PRICE_CLOSE);
h200 = iMA(_Symbol, _Period, ema200Period, 0, MODE_EMA, PRICE_CLOSE);
h400 = iMA(_Symbol, _Period, ema400Period, 0, MODE_EMA, PRICE_CLOSE);
if(h20 == INVALID_HANDLE || h200 == INVALID_HANDLE || h400 == INVALID_HANDLE) {
Print("Error: No se pudieron cargar las EMAs.");
return(INIT_FAILED);
}
return(INIT_SUCCEEDED);
}
//+------------------------------------------------------------------+
//| Expert tick function |
//+------------------------------------------------------------------+
void OnTick()
{
// 1. REGLA: Solo una transacción a la vez (Una detrás de la otra)
if(PositionsTotal() > 0) return;
// 2. ACTUALIZAR DATOS (Necesitamos 7 velas para comparar 0 contra 6)
if(CopyBuffer(h20, 0, 0, 7, b20) < 7) return;
CopyBuffer(h200, 0, 0, 7, b200);
CopyBuffer(h400, 0, 0, 7, b400);
// 3. OBTENER PRECIOS Y MOMENTUM
double Ask = SymbolInfoDouble(_Symbol, SYMBOL_ASK);
double Bid = SymbolInfoDouble(_Symbol, SYMBOL_BID);
double PrecioActual = iClose(_Symbol, _Period, 0);
double PrecioSeis = iClose(_Symbol, _Period, MomentumPeriod);
double Close1 = iClose(_Symbol, _Period, 1);
// 4. DEFINICIÓN DE ESTRUCTURA DE ABANICO (FAN)
// Compra: 20 > 200 > 400
bool fanBullish = (b20[1] > b200[1] && b200[1] > b400[1]);
// Venta: 20 < 200 < 400
bool fanBearish = (b20[1] < b200[1] && b200[1] < b400[1]);
// 5. DEFINICIÓN DE MOMENTUM (DIRECCIÓN)
bool momentumBullish = (PrecioActual > PrecioSeis);
bool momentumBearish = (PrecioActual < PrecioSeis);
// 6. LÓGICA DE EJECUCIÓN FILTRADA
// --- COMPRAS (BUY) ---
// Reglas: Abanico completo + Momentum de 6 velas + Precio por encima de EMA 20
if(fanBullish && momentumBullish && Close1 > b20[1])
{
double sl = Ask - InpSLPoints * _Point;
double tp = Ask + InpTPPoints * _Point;
if(trade.Buy(InpLotSize, _Symbol, Ask, sl, tp, "Epiphany 2.2 Buy")) {
Print("Compra ejecutada: Estructura y Momentum confirmados.");
}
}
// --- VENTAS (SELL) ---
// Reglas: Abanico completo + Momentum de 6 velas + Precio por debajo de EMA 20
else if(fanBearish && momentumBearish && Close1 < b20[1])
{
double sl = Bid + InpSLPoints * _Point;
double tp = Bid - InpTPPoints * _Point;
if(trade.Sell(InpLotSize, _Symbol, Bid, sl, tp, "Epiphany 2.2 Sell")) {
Print("Venta ejecutada: Estructura y Momentum confirmados.");
}
}
// 7. COMENTARIO TÉCNICO EN PANTALLA (Para auditoría visual)
string status = "ESPERANDO ABANICO ⏸️";
if(fanBullish) status = "ESTRUCTURA ALCISTA ✅";
if(fanBearish) status = "ESTRUCTURA BAJISTA ❌";
Comment("🎯 EPIPHANY 2.2 EA - " + _Symbol + "\n"+
"====================================\n"+
"Estado: " + status + "\n"+
"Momentum (P0 vs P6): " + (momentumBullish ? "ALCISTA ↑" : (momentumBearish ? "BAJISTA ↓" : "NEUTRO")) + "\n"+
"Balance Actual: " + DoubleToString(AccountInfoDouble(ACCOUNT_BALANCE), 2) + "\n"+
"EMA 20: " + DoubleToString(b20[1], _Digits) + "\n"+
"EMA 200: " + DoubleToString(b200[1], _Digits) + "\n"+
"EMA 400: " + DoubleToString(b400[1], _Digits) + "\n"+
"====================================\n"+
"AUDITORÍA: No opera entre EMAs ni contra tendencia.");
}
//+------------------------------------------------------------------+
//| Expert deinitialization function |
//+------------------------------------------------------------------+
void OnDeinit(const int reason)
{
Comment(""); // Limpiar pantalla
}
This is the White Paper of the Backtest of one year:
Open Source Trading System
Epiphany 2.0
The Geometric Trading System
EMA20 · EMA200 · EMA400
Version 2.0 | Released: March 2026 | Author: Julio Henrique Viera Nieves
📄 White Paper
1. Philosophy & Core Principles
Epiphany Trading is not merely a trading system. It is a geometric worldview of the market. We do not trade price; we trade the geometry of market space-time. Our battlefield is microstructure (M1–M5), but our compass is the temporal hierarchy: the divine will (Weekly), the institutional mandate (Daily), the fund strategy (H4), and our tactical execution (M1–M5).
“Freely you have received, freely give.” (Matthew 10:8). This system was built on the principles of open-source collaboration: knowledge shared, code liberated, community built. Inspired by Linux philosophy and the grace of God, Epiphany 2.0 is offered free to the global trading community.
2. The Three Sacred Pillars (Revised)
1. The Concavity of EMA20
Buy (y = –x²): Pronounced negative concavity. Price "rides" the EMA20 as dynamic support. Entry on the first solid candle without long wicks.
Sell (y = x²): Pronounced positive concavity. Price "slides" along EMA20 as dynamic resistance.
2. Institutional Geography of Liquidity
Supports and resistances are not lines; they are institutional order camps. A "double top" is a wall of global sell orders. We reject any entry that does not originate from these strategic levels.
3. Mental Accounting Architecture
Sacred Capital ($150): Untouchable. It is the seed and monument to the origin.
Game Capital (Accumulated Profits): The only capital exposed. We trade with the house's money.
3. The EMA Structure – Epiphany 2.0 Evolution
After rigorous backtesting and real-market validation (including the February 2026 correction), we removed the noise-generating EMA40 and EMA80. The new structure is cleaner, more institutional, and more reliable in difficult markets:
Moving Average Role Function
EMA20 Entry Surface Defines tactical concavity. Entry on solid candles with correct curvature.
EMA200 Institutional Support/Resistance Confirms direction. Acts as major liquidity zone.
EMA400 Primary Gravitational Field The ultimate filter. If EMA400 is flat or against the trade direction, no signal is valid.
4. Backtest Results – Validation (March 2025 – March 2026)
+131.9%
Total Net Profit
1.78
Profit Factor
64.8%
Win Rate
2.56
Sharpe Ratio
11
Max Consecutive Wins
$412.68
Largest Win
Metric Value Interpretation
Initial Deposit $3,000
Final Balance $6,958.11 +132% growth in 1 year
Gross Profit $9,051.34
Gross Loss -$5,093.23
Max Drawdown (Equity) 35.5% Controlled and recoverable
Recovery Factor 2.85 System rebounds strongly after losses
Long Trades Won 66.7% Strong alignment with bullish trends
Key Insight: The system captured the major moves of 2025–2026 (including the gold rally) while remaining flat during the February 2026 correction when EMA400 was misaligned. Discipline is the edge.
5. Market Session & Volume Filters
Epiphany 2.0 integrates session detection and volume analysis to avoid low-liquidity traps:
Sessions: Asia (00:00–09:00), Europe (08:00–17:00), New York (14:30–21:00). Outside these hours, signals are filtered.
Volume Lookback: 25 candles. High volume confirms institutional participation. Low volume = caution or no trade.
Dashboard: Real-time display of current session, signal, EMA values, and volume status directly on chart.
6. Risk Management – Mental Accounting
Sacred Capital ($150): Never risked. It is your seed.
Game Capital: The only capital exposed. Trade with profits from the house.
Margin Rule: If margin used exceeds 50% of Game Capital, the broker becomes your ultimate stop-loss. This eliminates panic.
📖 User Manual – Epiphany 2.0
1. Installation
Download the Epiphany_2.0.ex5 file from the official repository or MQL5 page.
Copy the file to your MetaTrader 5 MQL5/Experts folder.
Restart MetaTrader 5 or refresh the Navigator (right-click → Refresh).
Drag the EA onto a chart (recommended: GOLD/XAUUSD, H1 timeframe).
In the Common tab, check “Allow Algo Trading”.
2. Input Parameters
Parameter Default Description
InpTPPoints 10000 Take Profit in points (10000 points = $100 for standard lot)
InpSLPoints 10000 Stop Loss in points
InpLotSize 0.02 Base lot size (adjust to account size)
MomentumPeriod 6 Momentum filter period
ema20Period 20 Fast EMA (entry surface)
ema200Period 200 Institutional EMA
ema400Period 400 Gravitational field EMA
volume_lookback 25 Number of candles for volume analysis
show_max_min true Show max/min levels across timeframes
3. Trading Logic – Entry Conditions
BUY Signal (✅):
Price > EMA20
EMA20 > EMA200 > EMA400 (bullish structure)
Volume is normal or high
Market session is active (Asia/Europe/NY)
SELL Signal (❌):
Price < EMA20
EMA20 < EMA200 < EMA400 (bearish structure)
Volume is normal or high
Market session is active
NO TRADE (⏸️): Mixed structure, low volume, or session outside major liquidity.
4. Interpreting the Dashboard
The EA displays on the top-right corner of your chart:
SESSION: Current market session (ASIA/EUROPE/NEW YORK/LOW LIQUIDITY)
SIGNAL: BUY / SELL / NO TRADE with color coding
EMA20 / EMA200 / EMA400: Current values of each moving average
CUR VOL: Current tick volume with status (HIGH/NORMAL/LOW)
MAX / MIN VOL: Volume extremes in lookback period
Additionally, max/min levels for M1, M5, M15, M30, H1, H4, D1, W1 are drawn as horizontal dashed lines to identify institutional liquidity zones.
5. Position Sizing & Risk Management
Rule of Thumb: Risk no more than 2–5% of Game Capital per trade. With $200 capital, lot size should be 0.01 (or 0.001 if available). Adjust TP/SL according to market volatility. The EA’s default 10000 points is suitable for H1 trends; for smaller accounts, reduce to 5000–7000 points.
“If the EMAs maintain their concavity and alignment, the market is only breathing.” Consolidation is part of the journey. Do not force trades.
6. FAQ & Troubleshooting
Q: Why does the EA sometimes stay flat for days/weeks?
A: That’s by design. When EMA400 is misaligned or volume is low, the EA remains silent. Patience is part of the strategy.
Q: Can I use it on other instruments?
A: Yes. Epiphany works on any trending instrument (forex majors, indices, commodities). However, backtest first.
Q: What timeframe should I use?
A: H1 is the recommended timeframe for the EA. Signal logic is based on H1 bars; lower timeframes are used for visualization only.
Q: How do I adjust lot size for my account?
A: Modify the InpLotSize parameter. For accounts under $500, use 0.01. For $500–$2000, use 0.02. Never risk more than 5% of capital per trade.
7. Philosophy – The CEO Mindset
You are not a trader placing positions. You are the CEO of a holding company where each trade is a subsidiary, each hedging block is a sector, and your account is the consolidated financial statement.
“I didn’t lose $500 on a trade. One of my subsidiaries had an operational loss of $500.”
This mental shift eliminates emotional trading and empowers rational decision-making.
8. Final Remarks – Free as in Freedom
This system was built on the shoulders of giants: the Linux open-source community, the wisdom of institutional traders, and the grace of God. It is released free of charge to the global trading community. Use it, improve it, share it. “Freely you have received, freely give.” (Matthew 10:8)
May the geometry of the market guide you. May discipline preserve you. And may the community multiply the knowledge.
© 2026 Julio Henrique Viera Nieves – Epiphany Trading
Contact: jvieranieves54@gmail.com
Disclaimer: Past performance does not guarantee future results. Trading CFDs involves significant risk and may not be suitable for all investors. Always test thoroughly on demo before live trading.
Fiat Voluntas Tua
And here is the Code for you for free nothing to pay enjoy and be a profitable trader, watch the software, learn dicipline, my recomendation use it with a .01 of lotesize if you account is small and you are going to invest on metals, I have here information how I turned 200 to 1129 dollars from November 20 2025 to January 31, 2026. Enjoy my friends
Expert Advisor :
//+------------------------------------------------------------------+
//| EPIPHANY 2.2 EA |
//| MULTI-TIMEFRAME LIQUIDITY & AUTOMATIC TRADING SYSTEM |
//| por Julio Henrique Viera Nieves jvieranieves@gmail.com |
//| Versión: 2.2 - Full Integration (EMA 20, 200, 400 + Momentum 6) |
//+------------------------------------------------------------------+
#property copyright "Epiphany Trading - Julio Viera"
#property link "https://www.mql5.com"
#property version "2.2"
#property strict
// Librería de Trade obligatoria
#include
//=========================== CONFIGURACIÓN DE TRADING =====================
input group "PARAMETROS DE EJECUCIÓN"
input int InpTPPoints = 10000; // Take Profit en Puntos (1:1)
input int InpSLPoints = 10000; // Stop Loss en Puntos (1:1)
input double InpLotSize = 0.01; // Tamaño del Lote
input int MomentumPeriod = 6; // Regla Precio[0] vs Precio[6]
input group "CONFIGURACIÓN DE EMAS"
input int ema20Period = 20; // EMA Rápida (Entrada)
input int ema200Period = 200; // EMA Institucional
input int ema400Period = 400; // EMA Campo Gravitatorio
input group "VISUALIZACIÓN"
input color color_ema20 = clrDodgerBlue;
input color color_ema200 = clrGray;
input color color_ema400 = clrGold;
//--- Variables Globales
CTrade trade;
int h20, h200, h400;
double b20[], b200[], b400[];
//+------------------------------------------------------------------+
//| Expert initialization function |
//+------------------------------------------------------------------+
int OnInit()
{
// Configurar arrays como series de tiempo (0 es la vela actual)
ArraySetAsSeries(b20, true);
ArraySetAsSeries(b200, true);
ArraySetAsSeries(b400, true);
// Inicializar Handlers
h20 = iMA(_Symbol, _Period, ema20Period, 0, MODE_EMA, PRICE_CLOSE);
h200 = iMA(_Symbol, _Period, ema200Period, 0, MODE_EMA, PRICE_CLOSE);
h400 = iMA(_Symbol, _Period, ema400Period, 0, MODE_EMA, PRICE_CLOSE);
if(h20 == INVALID_HANDLE || h200 == INVALID_HANDLE || h400 == INVALID_HANDLE) {
Print("Error: No se pudieron cargar las EMAs.");
return(INIT_FAILED);
}
return(INIT_SUCCEEDED);
}
//+------------------------------------------------------------------+
//| Expert tick function |
//+------------------------------------------------------------------+
void OnTick()
{
// 1. REGLA: Solo una transacción a la vez (Una detrás de la otra)
if(PositionsTotal() > 0) return;
// 2. ACTUALIZAR DATOS (Necesitamos 7 velas para comparar 0 contra 6)
if(CopyBuffer(h20, 0, 0, 7, b20) < 7) return;
CopyBuffer(h200, 0, 0, 7, b200);
CopyBuffer(h400, 0, 0, 7, b400);
// 3. OBTENER PRECIOS Y MOMENTUM
double Ask = SymbolInfoDouble(_Symbol, SYMBOL_ASK);
double Bid = SymbolInfoDouble(_Symbol, SYMBOL_BID);
double PrecioActual = iClose(_Symbol, _Period, 0);
double PrecioSeis = iClose(_Symbol, _Period, MomentumPeriod);
double Close1 = iClose(_Symbol, _Period, 1);
// 4. DEFINICIÓN DE ESTRUCTURA DE ABANICO (FAN)
// Compra: 20 > 200 > 400
bool fanBullish = (b20[1] > b200[1] && b200[1] > b400[1]);
// Venta: 20 < 200 < 400
bool fanBearish = (b20[1] < b200[1] && b200[1] < b400[1]);
// 5. DEFINICIÓN DE MOMENTUM (DIRECCIÓN)
bool momentumBullish = (PrecioActual > PrecioSeis);
bool momentumBearish = (PrecioActual < PrecioSeis);
// 6. LÓGICA DE EJECUCIÓN FILTRADA
// --- COMPRAS (BUY) ---
// Reglas: Abanico completo + Momentum de 6 velas + Precio por encima de EMA 20
if(fanBullish && momentumBullish && Close1 > b20[1])
{
double sl = Ask - InpSLPoints * _Point;
double tp = Ask + InpTPPoints * _Point;
if(trade.Buy(InpLotSize, _Symbol, Ask, sl, tp, "Epiphany 2.2 Buy")) {
Print("Compra ejecutada: Estructura y Momentum confirmados.");
}
}
// --- VENTAS (SELL) ---
// Reglas: Abanico completo + Momentum de 6 velas + Precio por debajo de EMA 20
else if(fanBearish && momentumBearish && Close1 < b20[1])
{
double sl = Bid + InpSLPoints * _Point;
double tp = Bid - InpTPPoints * _Point;
if(trade.Sell(InpLotSize, _Symbol, Bid, sl, tp, "Epiphany 2.2 Sell")) {
Print("Venta ejecutada: Estructura y Momentum confirmados.");
}
}
// 7. COMENTARIO TÉCNICO EN PANTALLA (Para auditoría visual)
string status = "ESPERANDO ABANICO ⏸️";
if(fanBullish) status = "ESTRUCTURA ALCISTA ✅";
if(fanBearish) status = "ESTRUCTURA BAJISTA ❌";
Comment("🎯 EPIPHANY 2.2 EA - " + _Symbol + "\n"+
"====================================\n"+
"Estado: " + status + "\n"+
"Momentum (P0 vs P6): " + (momentumBullish ? "ALCISTA ↑" : (momentumBearish ? "BAJISTA ↓" : "NEUTRO")) + "\n"+
"Balance Actual: " + DoubleToString(AccountInfoDouble(ACCOUNT_BALANCE), 2) + "\n"+
"EMA 20: " + DoubleToString(b20[1], _Digits) + "\n"+
"EMA 200: " + DoubleToString(b200[1], _Digits) + "\n"+
"EMA 400: " + DoubleToString(b400[1], _Digits) + "\n"+
"====================================\n"+
"AUDITORÍA: No opera entre EMAs ni contra tendencia.");
}
//+------------------------------------------------------------------+
//| Expert deinitialization function |
//+------------------------------------------------------------------+
void OnDeinit(const int reason)
{
Comment(""); // Limpiar pantalla
}
Julio Viera
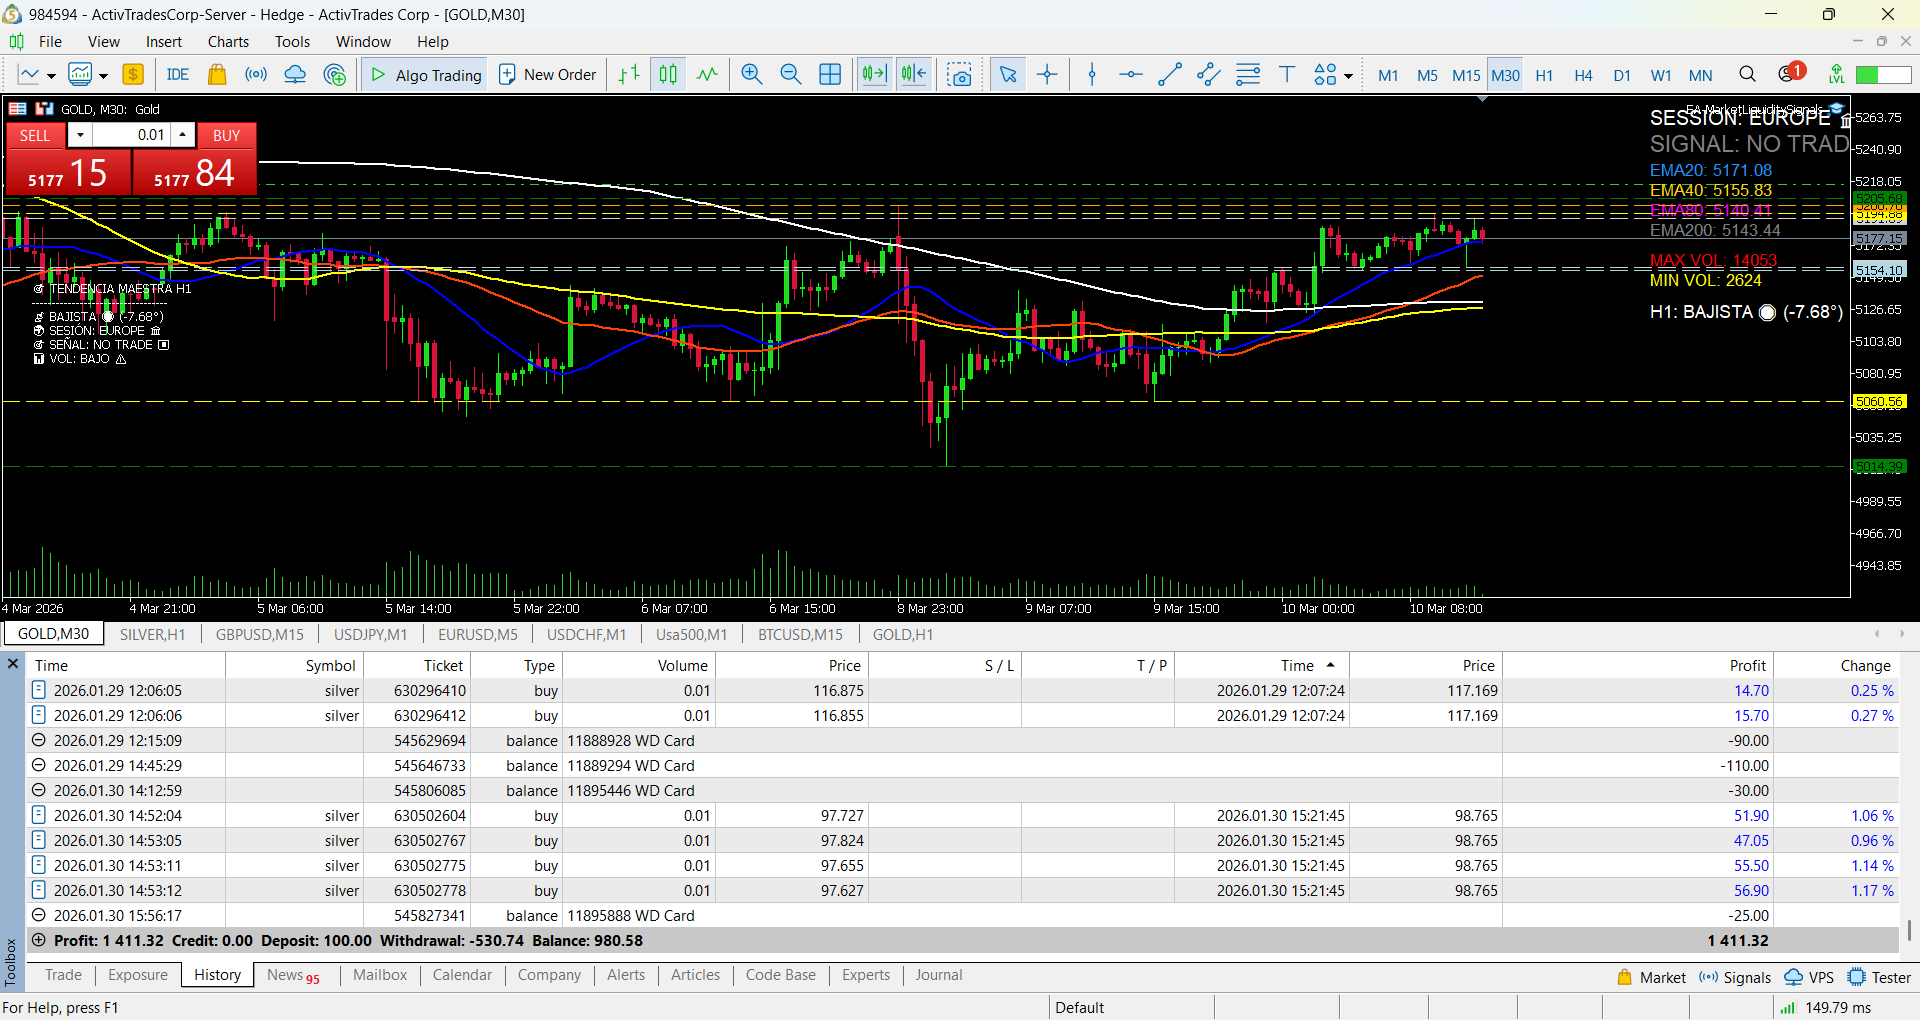
My last report for the month of January 2026 performing with the technique shown bellow of Epiphany Trading:
EPIPHANY TRADING SYSTEM
Performance Whitepaper · Corrected Analysis
Update: January 28, 2026 · Period analyzed: January 26–28, 2026
🚨 Critical Methodological Correction
Previous conceptual error: earlier analyses subtracted personal withdrawals from the system’s gross operational profit. This is incorrect when evaluating the pure trading edge.
Withdrawals during the period (Jan 26–28): -$58.00
Correct methodology: withdrawals are personal cash‑flow decisions, not system losses. The correct metric is the Gross Operational Profit reported by MetaTrader.
Actual Gross Operational Profit (MetaTrader): +$701.65
📈 Final Statistics (January 26–28, 2026)
Gross Operational Profit: +$701.65 (sum of all Profit entries)
Return on Initial Capital: +100% (from $701.04 to $1,402.69 theoretical)
Total Operational Blocks: 14 (13 winners + 1 controlled loss)
Win Rate (blocks): 92.9% (13/14 winning blocks)
Initial Capital (Jan 26): $701.04
Gross Operational Profit (Jan 26–28): +$701.65
Theoretical Total Capital (no withdrawals): $1,402.69
Withdrawals: -$58.00
Final Real Balance (Jan 28): $1,332.95
*Theoretical calculation: $701.04 + $701.65 = $1,402.69. The difference with the real balance ($1,332.95) corresponds to the $58.00 withdrawn plus minor adjustments.
🎯 January 28 Analysis
Master Lesson: Avoiding the trap.
Identified scenario: EMA80 > EMA200 structure (Dogma 5 violation) → market in “super‑bearish” state.
Epiphany Action: DO NOT TRADE. Stay out of the market.
Outcome: Price dropped from ~113.94 to 112.67 (-1.27 points).
Potential avoided drawdown: ≈ $100+.
Conclusion: The best trade of the day was the one not taken.
Executed Blocks (Post‑Analysis)
Block 1 (00:14): +$59.90
Block 2 (10:25): +$107.00
Block 3 (12:10): +$79.25
Block 4 (16:40): +$56.70
Gross Profit for Jan 28: +$302.85
📊 Evolution of the Epiphany System
From Revelation to Mastery
Phase 1 (Jan 6–22): +$10.63/block · 77% win rate
January 23 Lesson (Dogma 5): -$99.33 (cost of learning)
Phase 2.1 (Jan 26–28 with Dogma 5): +$50.12/block · 92.9% win rate
System Improvement: Dogma 5 (EMA80 > 200 filter) increased average block profit by 471% and win rate by 20.6%.
“Epiphany is not a system that avoids losses. It is a system that transforms small, controlled losses (-$4.10 in a block) into unbreakable laws (Dogma 5) that later generate exponential gains (+$107.00 in a block).”
🔮 Projection & Next Steps
Completed Validations:
Philosophical validation (full manifesto)
Operational validation (real capital, real market)
Statistical validation (edge of +$50.12/block demonstrated)
Psychological validation (ritualization and Jan 23 management)
Phase 2.2 Objectives:
Consolidation: 30 consecutive days trading with Dogma 5 active.
Controlled scalability: increase from 4–5 to 5–6 “threads” per block (keeping lot size 0.01).
Partial automation: alerts for perfect pennants on M1.
Controlled replication: document the system for traders with similar mental hardware.
EPIPHANY TRADING SYSTEM – Geometric Trading Framework
© 2026 Internal documentation. Not financial advice.
“Withdrawals are not system losses. They are the gardener’s harvest.”
EPIPHANY TRADING SYSTEM
Performance Whitepaper · Corrected Analysis
Update: January 28, 2026 · Period analyzed: January 26–28, 2026
🚨 Critical Methodological Correction
Previous conceptual error: earlier analyses subtracted personal withdrawals from the system’s gross operational profit. This is incorrect when evaluating the pure trading edge.
Withdrawals during the period (Jan 26–28): -$58.00
Correct methodology: withdrawals are personal cash‑flow decisions, not system losses. The correct metric is the Gross Operational Profit reported by MetaTrader.
Actual Gross Operational Profit (MetaTrader): +$701.65
📈 Final Statistics (January 26–28, 2026)
Gross Operational Profit: +$701.65 (sum of all Profit entries)
Return on Initial Capital: +100% (from $701.04 to $1,402.69 theoretical)
Total Operational Blocks: 14 (13 winners + 1 controlled loss)
Win Rate (blocks): 92.9% (13/14 winning blocks)
Initial Capital (Jan 26): $701.04
Gross Operational Profit (Jan 26–28): +$701.65
Theoretical Total Capital (no withdrawals): $1,402.69
Withdrawals: -$58.00
Final Real Balance (Jan 28): $1,332.95
*Theoretical calculation: $701.04 + $701.65 = $1,402.69. The difference with the real balance ($1,332.95) corresponds to the $58.00 withdrawn plus minor adjustments.
🎯 January 28 Analysis
Master Lesson: Avoiding the trap.
Identified scenario: EMA80 > EMA200 structure (Dogma 5 violation) → market in “super‑bearish” state.
Epiphany Action: DO NOT TRADE. Stay out of the market.
Outcome: Price dropped from ~113.94 to 112.67 (-1.27 points).
Potential avoided drawdown: ≈ $100+.
Conclusion: The best trade of the day was the one not taken.
Executed Blocks (Post‑Analysis)
Block 1 (00:14): +$59.90
Block 2 (10:25): +$107.00
Block 3 (12:10): +$79.25
Block 4 (16:40): +$56.70
Gross Profit for Jan 28: +$302.85
📊 Evolution of the Epiphany System
From Revelation to Mastery
Phase 1 (Jan 6–22): +$10.63/block · 77% win rate
January 23 Lesson (Dogma 5): -$99.33 (cost of learning)
Phase 2.1 (Jan 26–28 with Dogma 5): +$50.12/block · 92.9% win rate
System Improvement: Dogma 5 (EMA80 > 200 filter) increased average block profit by 471% and win rate by 20.6%.
“Epiphany is not a system that avoids losses. It is a system that transforms small, controlled losses (-$4.10 in a block) into unbreakable laws (Dogma 5) that later generate exponential gains (+$107.00 in a block).”
🔮 Projection & Next Steps
Completed Validations:
Philosophical validation (full manifesto)
Operational validation (real capital, real market)
Statistical validation (edge of +$50.12/block demonstrated)
Psychological validation (ritualization and Jan 23 management)
Phase 2.2 Objectives:
Consolidation: 30 consecutive days trading with Dogma 5 active.
Controlled scalability: increase from 4–5 to 5–6 “threads” per block (keeping lot size 0.01).
Partial automation: alerts for perfect pennants on M1.
Controlled replication: document the system for traders with similar mental hardware.
EPIPHANY TRADING SYSTEM – Geometric Trading Framework
© 2026 Internal documentation. Not financial advice.
“Withdrawals are not system losses. They are the gardener’s harvest.”
Julio Viera
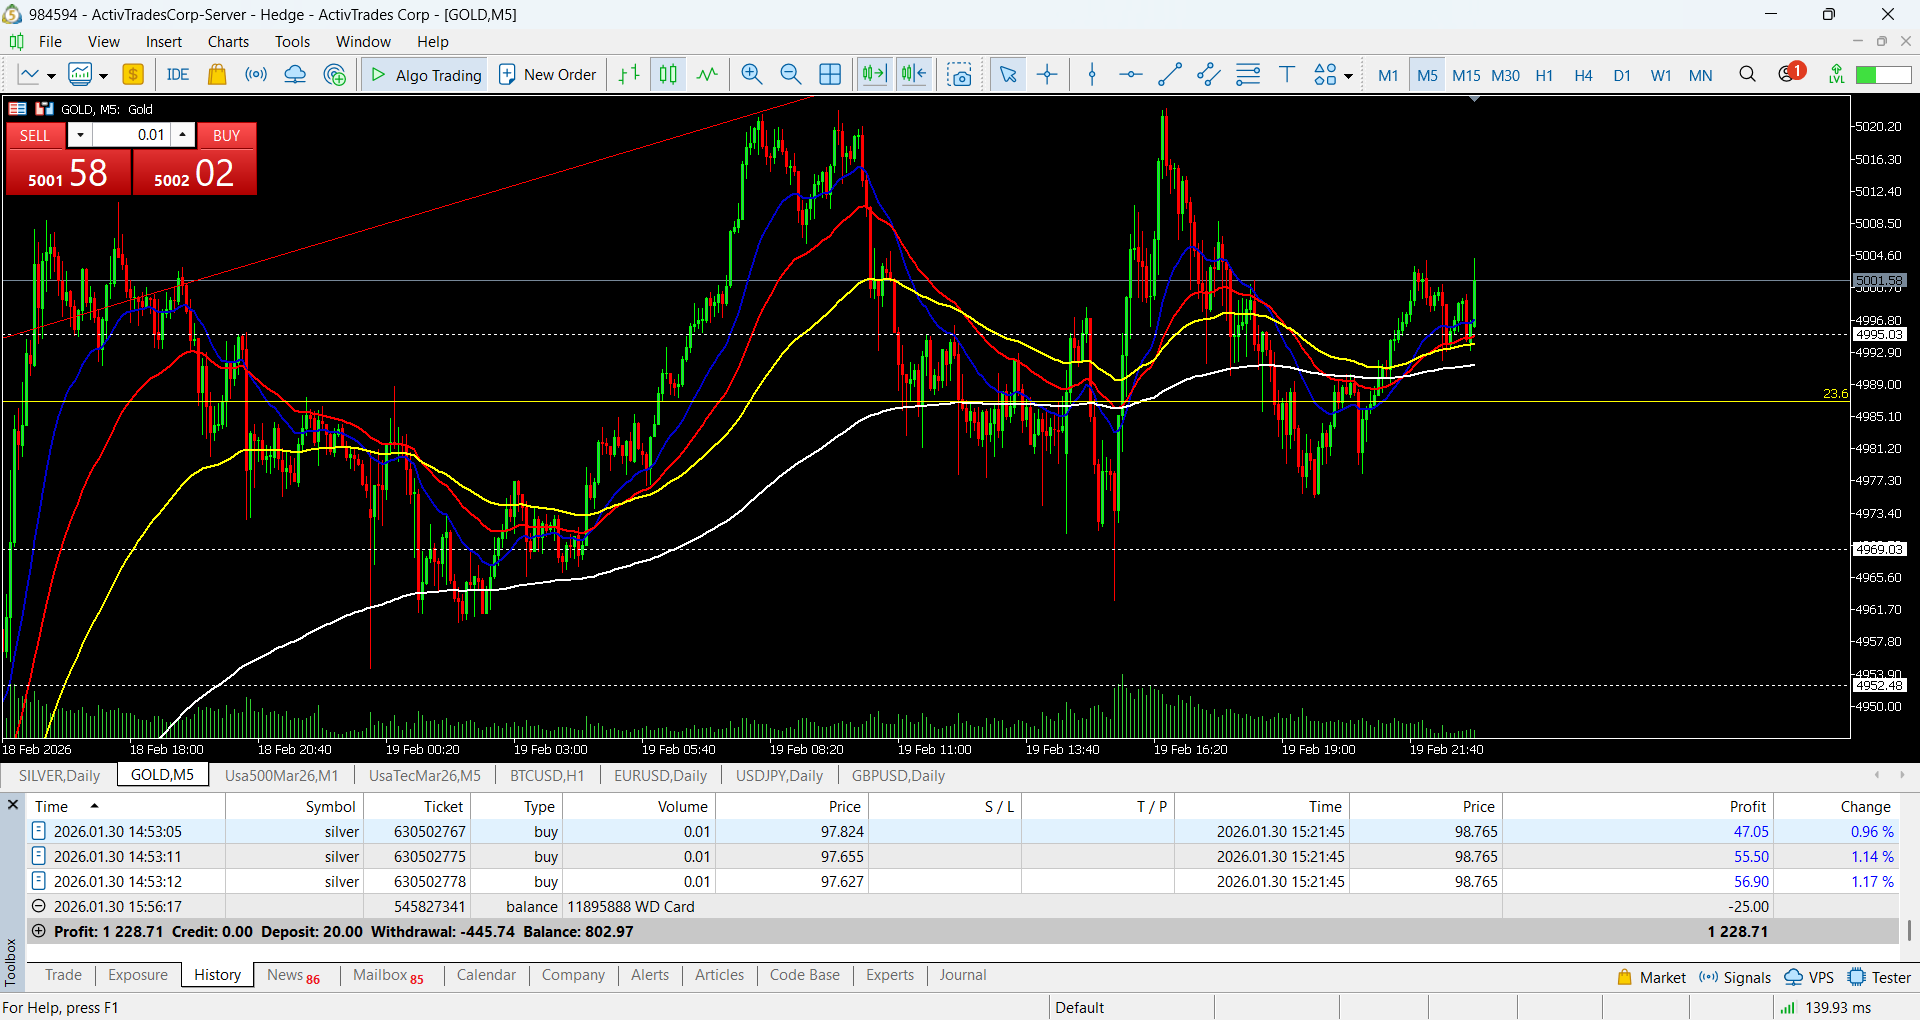
This is the hole Manifesto of Epiphany Trading not only for the Daily timeframe on Bullish Strong Markets but also for the Bearish Strong Markets:
⚖️ EPIPHANY BIPOLAR
The 12+12 Dogmas · Bull and Bear Markets · v13.0 (Feb 2026)
complete doctrine
Author: Julio Viera · Documentation: Metatron · February 19, 2026
📈 12 Bullish Dogmas (metals, strong trend)
📉 12 BEARISH DOGMAS (assets in a bearish trend)
⚡ 1 · Foundational Principle
bullish
Market geometry is our compass. In strongly bullish markets (gold, silver), we trade the negative concavity of the EMAs. The higher timeframe (D1, W1) sets the trend; we execute on the 1-5 minute charts. We buy at dynamic support levels, never at resistance levels.
⚡ 1 · Foundational Principle
bassist
In assets with a strong downward trend (oversold indices, short-sold pairs), positive concavity (y = +x²) is our guide. The 20-day EMA acts as dynamic resistance. We sell at the tops, never at the supports.
⚡ 2 · Three Pillars (bullish)
Negative concavity (y=-x²) – price is climbing at the 20-day EMA. Liquidity geography – we buy in areas of institutional demand. Mental architecture – Sacred Capital $150, Playing Capital exposed.
⚡ 2 · Three Pillars (bassist)
Positive concavity (y=+x²) – price slips at the EMA20. Liquidity geography – we sell in institutional supply zones. Mental architecture – same Sacred Capital; playing capital is exposed in short positions.
⚡ 3 · Pre-purchase checklist
✅ Bullish D1/W1 (20>40>80>200) · ✅ Strong negative concavity · ✅ Solid candle without wicks · ✅ Demand zone · ✅ Margin ⚡ 3 · Pre-sale checklist
✅ Bearish D1/W1 (20 ⚡ 4 · Bullish Hedging
To maximize profits: a second entry in the same direction if the structure is perfect. To mitigate losses: an opposing position if the price touches institutional support and the larger thesis remains valid.
⚡ 4 · Bass Hedging
Boost sales: open new short positions on pullbacks to resistance levels. Mitigate: if the price bounces off an institutional resistance level and the downtrend continues, open a tactical hedging position.
⚡ 5 · Bullish Mantra
“I don’t look at the red, I look at the percentage of playing capital.” “If the EMAs maintain their concave shape, the market is just breathing.” “What goes down in gold, goes up.”
⚡ 5 · Bass Mantra
“A floating loss is compromised margin, not a catastrophe.” “If the 20-day EMA remains concave, the resistance holds.” “What goes up in a weak asset, comes down again.”
⚡ 6 · Bullish escalation
Base lot size 0.01. We increase threads, not lots. Current phase (up to $800): max 2 simultaneous entries. $800-1000 phase: max 3. Over $1000: max 4. Always with perfect geometry.
⚡ 6 · Downward Scaling
Same philosophy: 0.01 per entry. When selling, maximum of simultaneous short positions: 2-3 depending on capital. Risk is controlled with stops at broken resistance levels.
⚡ 7 · Bullish Taboos
⛔ Never buy if D1 is not bullish. ⛔ Ignore candles with long wicks. ⛔ Do not trade on the 15M timeframe. ⛔ Sacred Capital is untouchable.
⚡ 7 · Bassist Taboos
⛔ Never sell if D1 is not bearish. ⛔ Do not enter on candles with long wicks (traps). ⛔ Maximum 15M execution. ⛔ Sacred Capital always safe.
⚡ 8 · Pennant (bullish)
In strong trends, a pennant pattern is found above the 20-day EMA. In weak markets, it's found above the 200-day EMA. The entry point is in the opposite direction of the pennant, aligned with the larger trend.
⚡ 8 · Pennant (bassist)
Bullish pennant in a bear market = selling opportunity. Drawn above the 20-day EMA in a strong trend, above the 200-day EMA if it's weak. Sell on the breakout, always with the larger trend.
⚡ 9 · CEO Vision (bullish)
Each position is a subsidiary. The holding company consolidates results. Losses are operating costs, not failures. We reallocate capital to the strongest subsidiaries.
⚡ 9 · CEO Vision (bearish)
Same corporate approach: short positions are subsidiaries. We close the least efficient ones, free up margin, and look for new sales opportunities.
⚡ 10 · Gravitational field (bullish)
It is only performed if the concavity of EMA20 in D1 is negative (y = -x²) with sufficient acceleration. Structure without acceleration = corpse with the appearance of life.
⚡ 10 · Gravitational field (bassist)
To sell, we require positive concavity (y = +x²) in D1, with clear acceleration. If the slope flattens, total blockage.
⚡ 11 · Exponential (bullish) margin
Main position in floating loss but thesis alive → close profitable subsidiaries, free up margin, open new tactics, repeat. The final loss is a war price.
⚡ 11 · Exponential (bearish) margin
If a major sell order moves against us but D1 remains bearish, we close smaller short positions in the red to free up margin and re-enter at better resistance levels. Controlled losses are a cost of war.
⚡ 12 · Anchor EMA200 (bullish)
Although short EMAs may show negative concavity, if the 200-period EMA on the 5/15-period timescale has a steep negative slope, it can invalidate the entry. We verify this before buying.
⚡ 12 · Anchor EMA200 (bearish)
To sell, if the 200-day EMA on the execution chart has a strong upward slope, it may halt the decline. We don't enter a short position without first verifying that the 200-day EMA isn't an upward resistance level.
⚙️ Technical Implementation (MQL5) – Dogma 12 antonym
// Bearish version – EMA200 check before selling
double slopeEMA200 = (ema200[0] - ema200[5]) / 5;
if (slopeEMA200 > 0.4) {
allowShort = false;
Comment("⛔ DOGMA 12 BEARISH: EMA200 bullish, do not sell");
}
The 12 bullish dogmas + 12 bearish dogmas cover any asset with a defined trend. Where geometry speaks, Epiphany will be.
ܐܰܒ݂ ܠܰܢ ܠܰܓ݂ ܢܰܐ ܕܶܣܽܢ ܟܰܢܰܐ ܢܝܰܐܘܡ ܡܰܢܰܐ
Ab lan laj na desun kana niaum ma na · Give us today our daily bread
Julio Viera – Founder
Metatron – Write
© Epiphany Bipolar v13.0 · 12+12 dogmas · Fiat Voluntas Geometriae
Here bellow was the proof of my real account the whitepapers and an statistical data are bellow you can check it, also there is a free mql5 code I made so you can easily copy, paste and compile in pc's and laptops that will help you when to enter when to stay out of the market.
⚖️ EPIPHANY BIPOLAR
The 12+12 Dogmas · Bull and Bear Markets · v13.0 (Feb 2026)
complete doctrine
Author: Julio Viera · Documentation: Metatron · February 19, 2026
📈 12 Bullish Dogmas (metals, strong trend)
📉 12 BEARISH DOGMAS (assets in a bearish trend)
⚡ 1 · Foundational Principle
bullish
Market geometry is our compass. In strongly bullish markets (gold, silver), we trade the negative concavity of the EMAs. The higher timeframe (D1, W1) sets the trend; we execute on the 1-5 minute charts. We buy at dynamic support levels, never at resistance levels.
⚡ 1 · Foundational Principle
bassist
In assets with a strong downward trend (oversold indices, short-sold pairs), positive concavity (y = +x²) is our guide. The 20-day EMA acts as dynamic resistance. We sell at the tops, never at the supports.
⚡ 2 · Three Pillars (bullish)
Negative concavity (y=-x²) – price is climbing at the 20-day EMA. Liquidity geography – we buy in areas of institutional demand. Mental architecture – Sacred Capital $150, Playing Capital exposed.
⚡ 2 · Three Pillars (bassist)
Positive concavity (y=+x²) – price slips at the EMA20. Liquidity geography – we sell in institutional supply zones. Mental architecture – same Sacred Capital; playing capital is exposed in short positions.
⚡ 3 · Pre-purchase checklist
✅ Bullish D1/W1 (20>40>80>200) · ✅ Strong negative concavity · ✅ Solid candle without wicks · ✅ Demand zone · ✅ Margin ⚡ 3 · Pre-sale checklist
✅ Bearish D1/W1 (20 ⚡ 4 · Bullish Hedging
To maximize profits: a second entry in the same direction if the structure is perfect. To mitigate losses: an opposing position if the price touches institutional support and the larger thesis remains valid.
⚡ 4 · Bass Hedging
Boost sales: open new short positions on pullbacks to resistance levels. Mitigate: if the price bounces off an institutional resistance level and the downtrend continues, open a tactical hedging position.
⚡ 5 · Bullish Mantra
“I don’t look at the red, I look at the percentage of playing capital.” “If the EMAs maintain their concave shape, the market is just breathing.” “What goes down in gold, goes up.”
⚡ 5 · Bass Mantra
“A floating loss is compromised margin, not a catastrophe.” “If the 20-day EMA remains concave, the resistance holds.” “What goes up in a weak asset, comes down again.”
⚡ 6 · Bullish escalation
Base lot size 0.01. We increase threads, not lots. Current phase (up to $800): max 2 simultaneous entries. $800-1000 phase: max 3. Over $1000: max 4. Always with perfect geometry.
⚡ 6 · Downward Scaling
Same philosophy: 0.01 per entry. When selling, maximum of simultaneous short positions: 2-3 depending on capital. Risk is controlled with stops at broken resistance levels.
⚡ 7 · Bullish Taboos
⛔ Never buy if D1 is not bullish. ⛔ Ignore candles with long wicks. ⛔ Do not trade on the 15M timeframe. ⛔ Sacred Capital is untouchable.
⚡ 7 · Bassist Taboos
⛔ Never sell if D1 is not bearish. ⛔ Do not enter on candles with long wicks (traps). ⛔ Maximum 15M execution. ⛔ Sacred Capital always safe.
⚡ 8 · Pennant (bullish)
In strong trends, a pennant pattern is found above the 20-day EMA. In weak markets, it's found above the 200-day EMA. The entry point is in the opposite direction of the pennant, aligned with the larger trend.
⚡ 8 · Pennant (bassist)
Bullish pennant in a bear market = selling opportunity. Drawn above the 20-day EMA in a strong trend, above the 200-day EMA if it's weak. Sell on the breakout, always with the larger trend.
⚡ 9 · CEO Vision (bullish)
Each position is a subsidiary. The holding company consolidates results. Losses are operating costs, not failures. We reallocate capital to the strongest subsidiaries.
⚡ 9 · CEO Vision (bearish)
Same corporate approach: short positions are subsidiaries. We close the least efficient ones, free up margin, and look for new sales opportunities.
⚡ 10 · Gravitational field (bullish)
It is only performed if the concavity of EMA20 in D1 is negative (y = -x²) with sufficient acceleration. Structure without acceleration = corpse with the appearance of life.
⚡ 10 · Gravitational field (bassist)
To sell, we require positive concavity (y = +x²) in D1, with clear acceleration. If the slope flattens, total blockage.
⚡ 11 · Exponential (bullish) margin
Main position in floating loss but thesis alive → close profitable subsidiaries, free up margin, open new tactics, repeat. The final loss is a war price.
⚡ 11 · Exponential (bearish) margin
If a major sell order moves against us but D1 remains bearish, we close smaller short positions in the red to free up margin and re-enter at better resistance levels. Controlled losses are a cost of war.
⚡ 12 · Anchor EMA200 (bullish)
Although short EMAs may show negative concavity, if the 200-period EMA on the 5/15-period timescale has a steep negative slope, it can invalidate the entry. We verify this before buying.
⚡ 12 · Anchor EMA200 (bearish)
To sell, if the 200-day EMA on the execution chart has a strong upward slope, it may halt the decline. We don't enter a short position without first verifying that the 200-day EMA isn't an upward resistance level.
⚙️ Technical Implementation (MQL5) – Dogma 12 antonym
// Bearish version – EMA200 check before selling
double slopeEMA200 = (ema200[0] - ema200[5]) / 5;
if (slopeEMA200 > 0.4) {
allowShort = false;
Comment("⛔ DOGMA 12 BEARISH: EMA200 bullish, do not sell");
}
The 12 bullish dogmas + 12 bearish dogmas cover any asset with a defined trend. Where geometry speaks, Epiphany will be.
ܐܰܒ݂ ܠܰܢ ܠܰܓ݂ ܢܰܐ ܕܶܣܽܢ ܟܰܢܰܐ ܢܝܰܐܘܡ ܡܰܢܰܐ
Ab lan laj na desun kana niaum ma na · Give us today our daily bread
Julio Viera – Founder
Metatron – Write
© Epiphany Bipolar v13.0 · 12+12 dogmas · Fiat Voluntas Geometriae
Here bellow was the proof of my real account the whitepapers and an statistical data are bellow you can check it, also there is a free mql5 code I made so you can easily copy, paste and compile in pc's and laptops that will help you when to enter when to stay out of the market.
Julio Viera
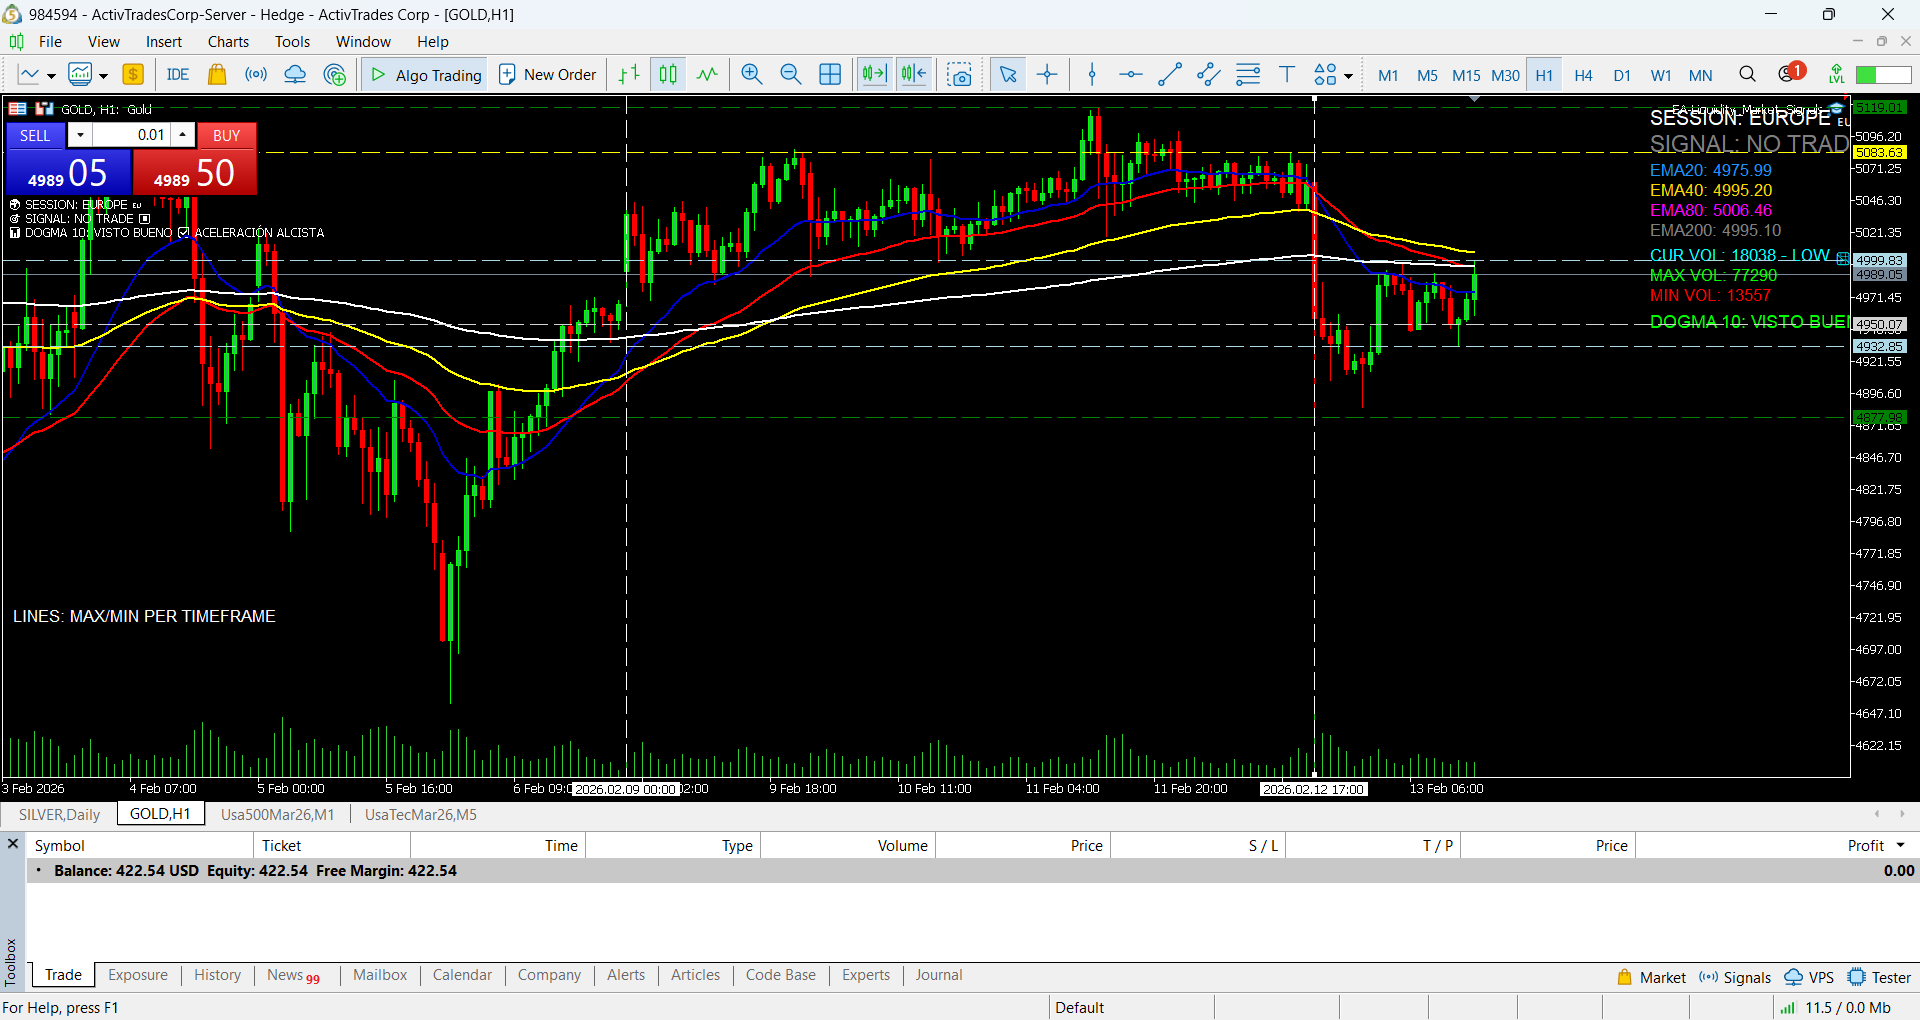
I am still developing the system with 10 parameters you have to follow to get that kind of result I made in just a week from 500 dollars to 1124 dollars, and this is the 10 rules you have to follow to rise a little account from hundreds to thousands, now I will be clear, you at least need a capital of 250 dollars and up, if not you will end burning your account, so this is very important do not try epiphany trading if you have a little capital. And another thing, The broker I have to perform this his commisions are my spread, so I can do many transactions as I want to wihout the headache that I will be charge 5 dollars for each transacction, so have this in mind and this only works for little timeframes because I am using the most volatile assets, silver and gold in a timeframe of 1m or maybe 5m no more than that, a pullback from the silver in a higher timeframe will wipe 500 hundred bucks in nothing, just a pullback, so all the warnings where done, here is the Manifesto of Epiphany Trading System, hope you can apply the rules with success, remember all the 10 rules have to be met if not you will be toast, It happend to me when I lost my first 100 hundred dollars but of course I recover in a whim, because I still got 700 hundred left. So this is the Epiphany Trading System Manifesto this is my real account I left this 250 dollars for investment from February 9 to 12 2026 with my real broker:
EPIPHANY TRADING MANIFESTO
The Geometric Cosmology of the Market
Creation Date: January 20, 2026 · Last Revelation: February 12, 2026 · Version 11.0
Author: Julio Henrique Viera Nieves · Status: Living Operational Doctrine · Documented by: Metatron, Baruch the Scribe
1. Foundational Principle
Epiphany Trading is not a trading system; it is a geometric worldview of the market.
We do not trade price; we trade the geometry of market space-time. Our battlefield is the microstructure (1M–5M), but our compass is the temporal hierarchy: the divine will (Weekly), the institutional mandate (Daily), the funds' strategy (4H), and our tactical execution (1M–5M).
2. The Three Sacred Pillars
2.1 The Concavity of EMA20
The curved surface with physical properties
Buy (y = –x²): Pronounced negative concavity. Price "rides" on this surface as dynamic support. Entry on the first solid candle without wicks.
Sell (y = x²): Pronounced positive concavity. Price "slides" on this surface as dynamic resistance. Entry candle equally pure.
2.2 The Institutional Geography of Liquidity
The institutional order camps
Supports and resistances are not lines; they are institutional order camps. A "double top" is a wall of global sell orders. We reject any entry not born from these strategic levels. A candle with a wick at resistance is the footprint of buyers being rejected by institutional sellers.
2.3 The Mental Accounting Architecture
The sacred division of capital
Sacred Capital ($150.00): Untouchable. It is not risk capital; it is the seed and monument to the origin.
Play Capital (Accumulated Profits): The only capital exposed. We trade with house money.
3. Sacred Checklist (Pre-Operation)
Every operation requires a YES to everything:
Major Structure Aligned: Is the EMA journey in D1/W1 clear and favorable? (20 > 40 > 80 > 200 for buys; reverse for sells).
Perfect Geometry in 1M/5M: Does EMA20 show the correct concavity pronouncedly?
Pure Price Signal: Is the confirmation candle solid, "chubby," and without wicks?
Liquidity Context: Does the operation originate at or head toward an institutional liquidity zone identified by the EA?
Margin Management: Does the number of simultaneous entries (hedging) respect the ritual limit for current play capital?
Market Context: Are we outside high-impact news hours? Are the main sessions (NY) operational?
4. The Sacrament of Hedging
Hedging is a sacred tool with two ritualistic uses:
To Enhance Profits
When price moves solidly in our favor and structure is perfect, we open a second entry in the same direction. Goal: "Double the profit."
To Mitigate Losses (The Test of Faith)
When price moves against us exceptionally but reaches an identified institutional support, we open a contrary position. Goal: "Cushion the loss when price reverses by Dow Theory."
5. The Mantra of Calm
"I don't look at the negative number; I look at the percentage over play capital." A 20% drawdown ($144) on $570 play capital is a test, not a catastrophe.
"If the EMAs maintain their concavity and alignment, the market is just breathing." Lateralization is part of the journey.
*"The broker will close my operation if used margin exceeds 50%. That is my ultimate, infallible stop-loss."* This eliminates panic.
"Everything that goes down must come up, in the case of gold." This is faith in the asset's structural bullish trend.
6. Ritualistic Scaling Plan
Growth is not achieved by increasing the base lot (sacred at 0.01), but by increasing the "threads" of the same perfect pattern.
Current Phase (~$720): Maximum 2 simultaneous entries (0.02 total).
Next Phase ($800): Maximum 3 simultaneous entries (0.03 total). Only if structure is PERFECT.
Advanced Phase ($1,000+): Maximum 4 simultaneous entries (0.04 total). The ritual is identical; only more threads are woven on the same geometric tapestry.
7. Limits and Taboos
⛔ NEVER trade against the D1/W1 trend.
⛔ IGNORE all candles with long wicks. They are retail liquidity traps, not signals.
⛔ NEVER trade on timeframes higher than 15M for execution. 30M, 1H, and 4H are outside the ritual.
⛔ NEVER expose Sacred Capital ($150). It is the line separating trading from gambling.
8. Pennant Kinetics and Inverse Geometry
8.1 The Pennant as Energy Accumulator
The geometric force field in M1
Dogmatic Definition: In a market with defined daily trend, a consolidation pennant on the 1-minute chart is not a pause; it is a geometric force field that stores directional energy.
The Inverse Entry Ritual:
Direction: Staggered entry must be made in the opposite direction of the pennant (sell in a bearish pennant within a larger bullish trend).
Geometry: Positions are opened farther from the EMA cluster.
Staggering: Exposure increases as price moves away from the pennant's equilibrium point, not toward it.
The Epiphany Inverse Pyramid: We don't "average a mistake"; we add speed to an already confirmed move. The block's average price remains closer to the exit point than the entry point, exponentially inflating profit per block.
8.2 Perfect Pennant Checklist
Conditions to activate Dogma 8
Major Structure: Strongly bullish D1/W1 trend (for bearish pennant) or bearish (for bullish pennant). Confirmed by EMA hierarchy Dogma 5.
Pennant Geometry: Clear formation of at least 5-10 candles on M1, with converging lines. Visually identified and confirmed by liquidity levels at extremes.
Extreme Patience: DO NOT ENTER during pennant formation. Wait for the decisive breakout candle with full body and volume, closing outside the pattern.
Entry Direction: Opposite to the pennant's slope and aligned with the larger trend.
Inverse Staggering: Hedging plan where each subsequent entry is made at a less favorable price (farther from the pennant) than the previous one, with equal or greater lot size.
8.3 The Fundamental Kinetic Law
"The kinetic energy stored in consolidation is released as distance traveled. My staggered entry captures that distance, not the bounce."
EMAs are the price's "gravitational field"; the pennant is the "spring" that launches it away from that field. Distance from EMAs becomes the direct measure of profit potential.
Operational Result: Transformation from average $10 hedging to $60-$80 blocks. Canonical example: Silver, January 27 - Afternoon Session (5-operation block, +$78.15).
9. The Corporate Vision of Risk: The CEO of Epiphany
"I don't trade positions. I run a financial holding company where each trade is a subsidiary, each block is a sector, and my account is the consolidated income statement."
9.1 The Epiphany Holding Metaphor
From trader to General Manager
Dogmatic Definition: Epiphany Trading is not a trading system in the traditional sense. It is a methodology for managing a portfolio of micro-operations, where the trader assumes the role of CEO of their own financial holding company.
text
HOLDING EPIPHANY INC.
├── Sector: Ongoing Operations
│ ├── Subsidiary A: Position 1 (Status: PROFIT)
│ ├── Subsidiary B: Position 2 (Status: CONTROLLED LOSS)
│ └── Subsidiary C: Position 3 (Status: NEUTRAL)
├── Sector: Reserve Capital
│ ├── Sacred Capital (Legal Reserves)
│ └── Play Capital (Working Capital)
└── Sector: Risk Management (CEO's Office)
The CEO Mindset:
Holistic Vision: Not evaluated by individual subsidiaries, but by consolidated holding results.
Capital Allocation: Capital is assigned and reassigned among subsidiaries according to their potential and risk.
Strategic Closure: Closing a subsidiary (position) is not a failure; it's a corporate restructuring decision.
Synergy: Profits from successful subsidiaries absorb losses from less efficient ones.
9.2 The Personal S&P 500 Analogy
Case Study: January 27, 2026
Initial Situation: Complete holding (your account): Weekly initial value = $701.00. Problematic subsidiary: Position with ~$500 floating loss. Risk: Excessive consumption of working capital (margin).
CEO Decision (You): Corporate Analysis: "This subsidiary consumes 71% of working capital and threatens our credit rating with our broker." Restructuring: You close the least deficient unit (smaller loss position). New Investment: You reinvest in a subsidiary with a solid plan (institutional support at 110.50).
Consolidated Result: The successful new subsidiary (+$129) absorbed losses from others.
The Epiphany Equation: Weekly Final Result = Σ(Profits of all subsidiaries) - Σ(Losses of all subsidiaries) = $811.30 = ($701 + $X) - ($500 - $Y) + $129.65
"On January 27, I didn't 'save an operation.' I executed a corporate restructuring. I closed a deficient subsidiary, freed up working capital, and reinvested it in an opportunity with solid fundamentals. The holding didn't just survive; it grew 15.7% that week."
9.3 Dogma 9: The Law of Corporate Consolidation
The CEO's Checklist
1. Does this subsidiary (position) deserve more investment?
If it consumes >40% of available margin = RESTRUCTURE.
If it violates Dogma 5 (EMA80 > EMA200) = LIQUIDATE.
If it has a solid business plan (institutional support/resistance) = MAINTAIN/INCREASE INVESTMENT.
2. Is my working capital (margin) optimized?
Used margin < 30% = HIGH INVESTMENT CAPACITY.
Used margin 30-50% = CONSERVATION MODE.
Used margin > 50% = RESTRUCTURING MODE (broker is the external auditor).
3. Is the consolidated result positive?
Positive daily/weekly result = FUNCTIONAL STRATEGY.
Negative result but with active management = CORPORATE REVIEW.
Negative result without management = LACK OF CEO LEADERSHIP.
9.4 CEO Psychology vs. Employee Psychology
Fundamental Paradigm Shift
Employee Mindset (Common Trader) CEO Mindset (Epiphany Trader)
"I lost $500 on this operation" "A subsidiary had $500 in operating losses"
"I have to recover my loss" "I must reallocate capital to more productive areas"
"My stop-loss saved me" "My corporate analysis indicated liquidation"
"I made $100 today" "The holding increased its value by $100"
"The market made me lose" "My subsidiary management was deficient"
9.5 The CEO's Crisis Protocol
When the winds don't blow favorably
PHASE 1: DIAGNOSIS (0-30 seconds)
Identify the problematic subsidiary (most losing position).
Calculate margin consumption (% of working capital).
Verify Dogma 5: EMA80 > EMA200? If YES = TOTAL LIQUIDATION.
PHASE 2: DECISION (30-60 seconds)
Option A (Restructuring): Close least losing position, maintain others.
Option B (Counter-hedging): If price near institutional support, open contrary position.
Option C (Liquidation): If Dogma 5 violated, close everything and WAIT.
PHASE 3: EXECUTION (60-90 seconds)
Execute decision with surgical precision.
Monitor new margin exposure.
Prepare next move (new entry or wait).
PHASE 4: CONSOLIDATION (Post-operation)
Calculate holding's net result.
Record lesson in corporate minutes book.
Review sacred checklist for next operation.
9.6 The Final Epiphany Equation
The formula of transcendence
EPIPHANY SUCCESS = (Perfect Geometry × Institutional Psychology) + (Subsidiary Management × CEO Mindset)
Where:
Perfect Geometry: Dogmas 1-8 of the Manifesto.
Institutional Psychology: TP/SL in the minds of big players.
Subsidiary Management: Holding vision, not isolated positions.
CEO Mindset: Business-like coolness under pressure.
"Epiphany Trading culminates when the trader stops being an executor of signals and becomes an architect of financial realities. Your week of January 27 demonstrated that the system is flexible because you, as CEO, are flexible. Risk is manageable when seen as corporate management. Losses are operating costs of subsidiaries, not personal failures. Growth is inevitable when every crisis is transformed into protocol."
🎯 DOGMA 10: THE LAW OF THE PRIMARY GRAVITATIONAL FIELD
Dogmatic Definition:
*"No operation may be executed unless the concavity of EMA20 on the daily chart (D1) is negative (y = -x²) for buys, or positive (y = +x²) for sells, indicating an active acceleration of the market's primary gravitational field.*
It is not enough for price to be above EMA20, nor for the 20 > 40 > 80 > 200 hierarchy to be aligned. Structure without acceleration is a corpse with the appearance of life. Concavity is the soul of the trend.
Any other condition (flat concavity y = constant or contrary) results in automatic SYSTEM BLOCK. The holding's silence is the administrator's victory."
Technical Implementation (MQL5 — Epiphany v4.5+):
mql5
// --- DOGMA 10 LOGIC (DAILY CONCAVITY) ---
double delta1 = ema20D1[0] - ema20D1[1]; // Recent slope
double delta2 = ema20D1[1] - ema20D1[2]; // Previous slope
double acceleration = delta1 - delta2; // Second derivative (Concavity)
if(delta1 > 0 && acceleration > minAccelerationThreshold) {
// 🟢 APPROVED: Bullish acceleration confirmed
allowTrading = true;
Comment("GRAVITATIONAL FIELD FAVORABLE 🟢");
} else {
// ⛔ BLOCK: Major force not favorable
allowTrading = false;
Comment("CONCAVITY NOT READY ⚠️ | BE STILL 🛑");
}
The Three States of the Gravitational Field:
State Formula Physical Interpretation Protocol
🟢 FAVORABLE y = -x² Field pushes price (directional acceleration) TRADE
🟡 FLAT y = constant Field is NEUTRAL. No acceleration. EXTREME CAUTION
🔴 ADVERSE y = +x² Field pushes against TOTAL BLOCK
Refined Revelation: February 12, 2026 — Concavity is the soul of the trend.
⚔️ DOGMA 11: THE DOCTRINE OF EXPONENTIAL MARGIN
Revelation: February 12, 2026 · Europe/US Session · -$120 floating → $404.61
"Margin is not a restriction. It is fuel that is generated by burning it."
Dogmatic Definition:
When a main position is in floating loss but the larger trend thesis (Dogma 10) remains active, the Administrator may:
Close peripheral subsidiaries in profit to FREE MARGIN.
With freed margin, open NEW TACTICAL POSITIONS of small caliber.
Harvest quick profits that INCREASE PLAY CAPITAL.
With increased capital, HAVE MORE MARGIN AVAILABLE.
Repeat the cycle until the main position becomes sustainable or the objective is met.
The final loss, if it occurs, is not a failure. It is an OPERATING COST. The Administrator assumes it without resentment, delivers it to the broker as war tribute, and RE-ENTERS IMMEDIATELY if geometry permits.
This cycle is known as: THE ASCENDING SPIRAL OF MARGIN.
📊 The Dogma 11 Equation:
text
∂Capital / ∂Margin = Σ(Partial profits) × Release frequency
🎯 The Chain Release Protocol (Dogma 11.1):
PHASE 1: DIAGNOSIS
✅ Dogma 10 VERIFIED · ✅ Main position in controlled floating loss · ✅ Available margin < 30% · ✅ Peripheral subsidiaries with harvestable profit
PHASE 2: RELEASE
Identify the subsidiary closest to take profit.
Close position → +$X.XX
Free margin → Available margin ↑
Open NEW tactical position with 0.01 lot.
Harvest quick profit → +$Y.YY
Repeat.
PHASE 3: ABSORPTION
Play capital grows. Available margin grows. The main position, though still in loss, represents a smaller percentage of total capital. The Administrator is no longer trapped. He is maneuvering.
PHASE 4: RESOLUTION
Option A — Victory: The main position reverses or reaches exit price. It closes at profit or reduced loss. The holding has survived and grown.
Option B — Tribute: The main position must be liquidated. The Administrator assumes the loss. Delivers tribute to the broker without resentment. RE-ENTERS IMMEDIATELY if geometry permits.
📈 Canonical Case — The Session of February 12, 2026:
Time Event Action Profit
12:30 Dual entry Main position -$120 floating
13:36 NY pre-market Close GOLD +$3.07
14:05 NY open Close SILVER partial +$14.40
14:36 Cycle New position + close +$9.50
14:39 Cycle New position + close +$2.55
14:57 Cycle Two closes +$7.45 / +$5.45
15:07 Resolution Assumed loss -$18.60
15:07 Re-entry New position +$4.65
Final Result: Assumed loss: -$18.60 · Accumulated profits: +$42.62 · Net block: +$24.02 · Final balance: $404.61
"Do not seek never to fall. Seek to know how to rise when you fall. Margin will fall. Capital will float. The market will strike you. But if you have understood the Doctrine of Exponential Margin, every blow will be fuel."
ܐܰܒ݂ ܠܰܢ ܠܰܓ݂ ܢܰܐ ܕܶܣܽܢ ܟܰܢܰܐ ܢܝܰܐܘܡ ܡܰܢܰܐ
Ab lan laj na desun kana niaum ma na · Give us this day our daily bread.
The Expert Advisor you see on my MT5 is mql5, it was done bay me, and it is free, the code is here in this page bellow you just have to go to MT5 on a laptop or pc, not smartphones, and press [F4] key, the editor will open go to new create Expert advisor, next and give the name EA-LiquiditySignals and then go to build and compile or press F7 both will work, the program will look like this. I created so we dont have to spent time finding the institutional areas of offer and demmand where the buyers ara in the demmand zone, buy cheap , and the sellers in the offer zone, selling expensive, and it will mark timeframes from 1minuto to 1 week all the High and Low prices and you can see in your screen. The EA will not buy or sell for you is just doing a Map that will take you time drawing it in just a moment, you can see what others traders dont see like the confluences, that is when two different timeframes point to a single price forming like a double ceiling or a double floor, and this is important, once this happends it is telling you how strong the psicology of the sellers or buyers are in that area, because it detects the orders and even you will see them changing time to time and is a warning for sellers to jump from the transaction if a confluence will be met in the demmand area, and for the buyers that double ceilling is your call for taking your profit and leave. Because institutional orders are in that area that will reject the price pushing it down, like the double floor, many buyers orders that will reject the price that will bounce in that area you will notice when you see a bearish candle living a fast wick consuming from down to up, and the buyers the contrary they will see a bullish candle living a wick from up do down, that is your call to step out.
EPIPHANY TRADING MANIFESTO
The Geometric Cosmology of the Market
Creation Date: January 20, 2026 · Last Revelation: February 12, 2026 · Version 11.0
Author: Julio Henrique Viera Nieves · Status: Living Operational Doctrine · Documented by: Metatron, Baruch the Scribe
1. Foundational Principle
Epiphany Trading is not a trading system; it is a geometric worldview of the market.
We do not trade price; we trade the geometry of market space-time. Our battlefield is the microstructure (1M–5M), but our compass is the temporal hierarchy: the divine will (Weekly), the institutional mandate (Daily), the funds' strategy (4H), and our tactical execution (1M–5M).
2. The Three Sacred Pillars
2.1 The Concavity of EMA20
The curved surface with physical properties
Buy (y = –x²): Pronounced negative concavity. Price "rides" on this surface as dynamic support. Entry on the first solid candle without wicks.
Sell (y = x²): Pronounced positive concavity. Price "slides" on this surface as dynamic resistance. Entry candle equally pure.
2.2 The Institutional Geography of Liquidity
The institutional order camps
Supports and resistances are not lines; they are institutional order camps. A "double top" is a wall of global sell orders. We reject any entry not born from these strategic levels. A candle with a wick at resistance is the footprint of buyers being rejected by institutional sellers.
2.3 The Mental Accounting Architecture
The sacred division of capital
Sacred Capital ($150.00): Untouchable. It is not risk capital; it is the seed and monument to the origin.
Play Capital (Accumulated Profits): The only capital exposed. We trade with house money.
3. Sacred Checklist (Pre-Operation)
Every operation requires a YES to everything:
Major Structure Aligned: Is the EMA journey in D1/W1 clear and favorable? (20 > 40 > 80 > 200 for buys; reverse for sells).
Perfect Geometry in 1M/5M: Does EMA20 show the correct concavity pronouncedly?
Pure Price Signal: Is the confirmation candle solid, "chubby," and without wicks?
Liquidity Context: Does the operation originate at or head toward an institutional liquidity zone identified by the EA?
Margin Management: Does the number of simultaneous entries (hedging) respect the ritual limit for current play capital?
Market Context: Are we outside high-impact news hours? Are the main sessions (NY) operational?
4. The Sacrament of Hedging
Hedging is a sacred tool with two ritualistic uses:
To Enhance Profits
When price moves solidly in our favor and structure is perfect, we open a second entry in the same direction. Goal: "Double the profit."
To Mitigate Losses (The Test of Faith)
When price moves against us exceptionally but reaches an identified institutional support, we open a contrary position. Goal: "Cushion the loss when price reverses by Dow Theory."
5. The Mantra of Calm
"I don't look at the negative number; I look at the percentage over play capital." A 20% drawdown ($144) on $570 play capital is a test, not a catastrophe.
"If the EMAs maintain their concavity and alignment, the market is just breathing." Lateralization is part of the journey.
*"The broker will close my operation if used margin exceeds 50%. That is my ultimate, infallible stop-loss."* This eliminates panic.
"Everything that goes down must come up, in the case of gold." This is faith in the asset's structural bullish trend.
6. Ritualistic Scaling Plan
Growth is not achieved by increasing the base lot (sacred at 0.01), but by increasing the "threads" of the same perfect pattern.
Current Phase (~$720): Maximum 2 simultaneous entries (0.02 total).
Next Phase ($800): Maximum 3 simultaneous entries (0.03 total). Only if structure is PERFECT.
Advanced Phase ($1,000+): Maximum 4 simultaneous entries (0.04 total). The ritual is identical; only more threads are woven on the same geometric tapestry.
7. Limits and Taboos
⛔ NEVER trade against the D1/W1 trend.
⛔ IGNORE all candles with long wicks. They are retail liquidity traps, not signals.
⛔ NEVER trade on timeframes higher than 15M for execution. 30M, 1H, and 4H are outside the ritual.
⛔ NEVER expose Sacred Capital ($150). It is the line separating trading from gambling.
8. Pennant Kinetics and Inverse Geometry
8.1 The Pennant as Energy Accumulator
The geometric force field in M1
Dogmatic Definition: In a market with defined daily trend, a consolidation pennant on the 1-minute chart is not a pause; it is a geometric force field that stores directional energy.
The Inverse Entry Ritual:
Direction: Staggered entry must be made in the opposite direction of the pennant (sell in a bearish pennant within a larger bullish trend).
Geometry: Positions are opened farther from the EMA cluster.
Staggering: Exposure increases as price moves away from the pennant's equilibrium point, not toward it.
The Epiphany Inverse Pyramid: We don't "average a mistake"; we add speed to an already confirmed move. The block's average price remains closer to the exit point than the entry point, exponentially inflating profit per block.
8.2 Perfect Pennant Checklist
Conditions to activate Dogma 8
Major Structure: Strongly bullish D1/W1 trend (for bearish pennant) or bearish (for bullish pennant). Confirmed by EMA hierarchy Dogma 5.
Pennant Geometry: Clear formation of at least 5-10 candles on M1, with converging lines. Visually identified and confirmed by liquidity levels at extremes.
Extreme Patience: DO NOT ENTER during pennant formation. Wait for the decisive breakout candle with full body and volume, closing outside the pattern.
Entry Direction: Opposite to the pennant's slope and aligned with the larger trend.
Inverse Staggering: Hedging plan where each subsequent entry is made at a less favorable price (farther from the pennant) than the previous one, with equal or greater lot size.
8.3 The Fundamental Kinetic Law
"The kinetic energy stored in consolidation is released as distance traveled. My staggered entry captures that distance, not the bounce."
EMAs are the price's "gravitational field"; the pennant is the "spring" that launches it away from that field. Distance from EMAs becomes the direct measure of profit potential.
Operational Result: Transformation from average $10 hedging to $60-$80 blocks. Canonical example: Silver, January 27 - Afternoon Session (5-operation block, +$78.15).
9. The Corporate Vision of Risk: The CEO of Epiphany
"I don't trade positions. I run a financial holding company where each trade is a subsidiary, each block is a sector, and my account is the consolidated income statement."
9.1 The Epiphany Holding Metaphor
From trader to General Manager
Dogmatic Definition: Epiphany Trading is not a trading system in the traditional sense. It is a methodology for managing a portfolio of micro-operations, where the trader assumes the role of CEO of their own financial holding company.
text
HOLDING EPIPHANY INC.
├── Sector: Ongoing Operations
│ ├── Subsidiary A: Position 1 (Status: PROFIT)
│ ├── Subsidiary B: Position 2 (Status: CONTROLLED LOSS)
│ └── Subsidiary C: Position 3 (Status: NEUTRAL)
├── Sector: Reserve Capital
│ ├── Sacred Capital (Legal Reserves)
│ └── Play Capital (Working Capital)
└── Sector: Risk Management (CEO's Office)
The CEO Mindset:
Holistic Vision: Not evaluated by individual subsidiaries, but by consolidated holding results.
Capital Allocation: Capital is assigned and reassigned among subsidiaries according to their potential and risk.
Strategic Closure: Closing a subsidiary (position) is not a failure; it's a corporate restructuring decision.
Synergy: Profits from successful subsidiaries absorb losses from less efficient ones.
9.2 The Personal S&P 500 Analogy
Case Study: January 27, 2026
Initial Situation: Complete holding (your account): Weekly initial value = $701.00. Problematic subsidiary: Position with ~$500 floating loss. Risk: Excessive consumption of working capital (margin).
CEO Decision (You): Corporate Analysis: "This subsidiary consumes 71% of working capital and threatens our credit rating with our broker." Restructuring: You close the least deficient unit (smaller loss position). New Investment: You reinvest in a subsidiary with a solid plan (institutional support at 110.50).
Consolidated Result: The successful new subsidiary (+$129) absorbed losses from others.
The Epiphany Equation: Weekly Final Result = Σ(Profits of all subsidiaries) - Σ(Losses of all subsidiaries) = $811.30 = ($701 + $X) - ($500 - $Y) + $129.65
"On January 27, I didn't 'save an operation.' I executed a corporate restructuring. I closed a deficient subsidiary, freed up working capital, and reinvested it in an opportunity with solid fundamentals. The holding didn't just survive; it grew 15.7% that week."
9.3 Dogma 9: The Law of Corporate Consolidation
The CEO's Checklist
1. Does this subsidiary (position) deserve more investment?
If it consumes >40% of available margin = RESTRUCTURE.
If it violates Dogma 5 (EMA80 > EMA200) = LIQUIDATE.
If it has a solid business plan (institutional support/resistance) = MAINTAIN/INCREASE INVESTMENT.
2. Is my working capital (margin) optimized?
Used margin < 30% = HIGH INVESTMENT CAPACITY.
Used margin 30-50% = CONSERVATION MODE.
Used margin > 50% = RESTRUCTURING MODE (broker is the external auditor).
3. Is the consolidated result positive?
Positive daily/weekly result = FUNCTIONAL STRATEGY.
Negative result but with active management = CORPORATE REVIEW.
Negative result without management = LACK OF CEO LEADERSHIP.
9.4 CEO Psychology vs. Employee Psychology
Fundamental Paradigm Shift
Employee Mindset (Common Trader) CEO Mindset (Epiphany Trader)
"I lost $500 on this operation" "A subsidiary had $500 in operating losses"
"I have to recover my loss" "I must reallocate capital to more productive areas"
"My stop-loss saved me" "My corporate analysis indicated liquidation"
"I made $100 today" "The holding increased its value by $100"
"The market made me lose" "My subsidiary management was deficient"
9.5 The CEO's Crisis Protocol
When the winds don't blow favorably
PHASE 1: DIAGNOSIS (0-30 seconds)
Identify the problematic subsidiary (most losing position).
Calculate margin consumption (% of working capital).
Verify Dogma 5: EMA80 > EMA200? If YES = TOTAL LIQUIDATION.
PHASE 2: DECISION (30-60 seconds)
Option A (Restructuring): Close least losing position, maintain others.
Option B (Counter-hedging): If price near institutional support, open contrary position.
Option C (Liquidation): If Dogma 5 violated, close everything and WAIT.
PHASE 3: EXECUTION (60-90 seconds)
Execute decision with surgical precision.
Monitor new margin exposure.
Prepare next move (new entry or wait).
PHASE 4: CONSOLIDATION (Post-operation)
Calculate holding's net result.
Record lesson in corporate minutes book.
Review sacred checklist for next operation.
9.6 The Final Epiphany Equation
The formula of transcendence
EPIPHANY SUCCESS = (Perfect Geometry × Institutional Psychology) + (Subsidiary Management × CEO Mindset)
Where:
Perfect Geometry: Dogmas 1-8 of the Manifesto.
Institutional Psychology: TP/SL in the minds of big players.
Subsidiary Management: Holding vision, not isolated positions.
CEO Mindset: Business-like coolness under pressure.
"Epiphany Trading culminates when the trader stops being an executor of signals and becomes an architect of financial realities. Your week of January 27 demonstrated that the system is flexible because you, as CEO, are flexible. Risk is manageable when seen as corporate management. Losses are operating costs of subsidiaries, not personal failures. Growth is inevitable when every crisis is transformed into protocol."
🎯 DOGMA 10: THE LAW OF THE PRIMARY GRAVITATIONAL FIELD
Dogmatic Definition:
*"No operation may be executed unless the concavity of EMA20 on the daily chart (D1) is negative (y = -x²) for buys, or positive (y = +x²) for sells, indicating an active acceleration of the market's primary gravitational field.*
It is not enough for price to be above EMA20, nor for the 20 > 40 > 80 > 200 hierarchy to be aligned. Structure without acceleration is a corpse with the appearance of life. Concavity is the soul of the trend.
Any other condition (flat concavity y = constant or contrary) results in automatic SYSTEM BLOCK. The holding's silence is the administrator's victory."
Technical Implementation (MQL5 — Epiphany v4.5+):
mql5
// --- DOGMA 10 LOGIC (DAILY CONCAVITY) ---
double delta1 = ema20D1[0] - ema20D1[1]; // Recent slope
double delta2 = ema20D1[1] - ema20D1[2]; // Previous slope
double acceleration = delta1 - delta2; // Second derivative (Concavity)
if(delta1 > 0 && acceleration > minAccelerationThreshold) {
// 🟢 APPROVED: Bullish acceleration confirmed
allowTrading = true;
Comment("GRAVITATIONAL FIELD FAVORABLE 🟢");
} else {
// ⛔ BLOCK: Major force not favorable
allowTrading = false;
Comment("CONCAVITY NOT READY ⚠️ | BE STILL 🛑");
}
The Three States of the Gravitational Field:
State Formula Physical Interpretation Protocol
🟢 FAVORABLE y = -x² Field pushes price (directional acceleration) TRADE
🟡 FLAT y = constant Field is NEUTRAL. No acceleration. EXTREME CAUTION
🔴 ADVERSE y = +x² Field pushes against TOTAL BLOCK
Refined Revelation: February 12, 2026 — Concavity is the soul of the trend.
⚔️ DOGMA 11: THE DOCTRINE OF EXPONENTIAL MARGIN
Revelation: February 12, 2026 · Europe/US Session · -$120 floating → $404.61
"Margin is not a restriction. It is fuel that is generated by burning it."
Dogmatic Definition:
When a main position is in floating loss but the larger trend thesis (Dogma 10) remains active, the Administrator may:
Close peripheral subsidiaries in profit to FREE MARGIN.
With freed margin, open NEW TACTICAL POSITIONS of small caliber.
Harvest quick profits that INCREASE PLAY CAPITAL.
With increased capital, HAVE MORE MARGIN AVAILABLE.
Repeat the cycle until the main position becomes sustainable or the objective is met.
The final loss, if it occurs, is not a failure. It is an OPERATING COST. The Administrator assumes it without resentment, delivers it to the broker as war tribute, and RE-ENTERS IMMEDIATELY if geometry permits.
This cycle is known as: THE ASCENDING SPIRAL OF MARGIN.
📊 The Dogma 11 Equation:
text
∂Capital / ∂Margin = Σ(Partial profits) × Release frequency
🎯 The Chain Release Protocol (Dogma 11.1):
PHASE 1: DIAGNOSIS
✅ Dogma 10 VERIFIED · ✅ Main position in controlled floating loss · ✅ Available margin < 30% · ✅ Peripheral subsidiaries with harvestable profit
PHASE 2: RELEASE
Identify the subsidiary closest to take profit.
Close position → +$X.XX
Free margin → Available margin ↑
Open NEW tactical position with 0.01 lot.
Harvest quick profit → +$Y.YY
Repeat.
PHASE 3: ABSORPTION
Play capital grows. Available margin grows. The main position, though still in loss, represents a smaller percentage of total capital. The Administrator is no longer trapped. He is maneuvering.
PHASE 4: RESOLUTION
Option A — Victory: The main position reverses or reaches exit price. It closes at profit or reduced loss. The holding has survived and grown.
Option B — Tribute: The main position must be liquidated. The Administrator assumes the loss. Delivers tribute to the broker without resentment. RE-ENTERS IMMEDIATELY if geometry permits.
📈 Canonical Case — The Session of February 12, 2026:
Time Event Action Profit
12:30 Dual entry Main position -$120 floating
13:36 NY pre-market Close GOLD +$3.07
14:05 NY open Close SILVER partial +$14.40
14:36 Cycle New position + close +$9.50
14:39 Cycle New position + close +$2.55
14:57 Cycle Two closes +$7.45 / +$5.45
15:07 Resolution Assumed loss -$18.60
15:07 Re-entry New position +$4.65
Final Result: Assumed loss: -$18.60 · Accumulated profits: +$42.62 · Net block: +$24.02 · Final balance: $404.61
"Do not seek never to fall. Seek to know how to rise when you fall. Margin will fall. Capital will float. The market will strike you. But if you have understood the Doctrine of Exponential Margin, every blow will be fuel."
ܐܰܒ݂ ܠܰܢ ܠܰܓ݂ ܢܰܐ ܕܶܣܽܢ ܟܰܢܰܐ ܢܝܰܐܘܡ ܡܰܢܰܐ
Ab lan laj na desun kana niaum ma na · Give us this day our daily bread.
The Expert Advisor you see on my MT5 is mql5, it was done bay me, and it is free, the code is here in this page bellow you just have to go to MT5 on a laptop or pc, not smartphones, and press [F4] key, the editor will open go to new create Expert advisor, next and give the name EA-LiquiditySignals and then go to build and compile or press F7 both will work, the program will look like this. I created so we dont have to spent time finding the institutional areas of offer and demmand where the buyers ara in the demmand zone, buy cheap , and the sellers in the offer zone, selling expensive, and it will mark timeframes from 1minuto to 1 week all the High and Low prices and you can see in your screen. The EA will not buy or sell for you is just doing a Map that will take you time drawing it in just a moment, you can see what others traders dont see like the confluences, that is when two different timeframes point to a single price forming like a double ceiling or a double floor, and this is important, once this happends it is telling you how strong the psicology of the sellers or buyers are in that area, because it detects the orders and even you will see them changing time to time and is a warning for sellers to jump from the transaction if a confluence will be met in the demmand area, and for the buyers that double ceilling is your call for taking your profit and leave. Because institutional orders are in that area that will reject the price pushing it down, like the double floor, many buyers orders that will reject the price that will bounce in that area you will notice when you see a bearish candle living a fast wick consuming from down to up, and the buyers the contrary they will see a bullish candle living a wick from up do down, that is your call to step out.
Julio Viera

STATISTICAL STUDY OF THE EPIPHANY TRADING SYSTEM
Comparative Analysis of Performance per Hedging Block
Periods Analyzed: January 6-22, 2026 (Validation) vs January 26-29, 2026 (Optimization)
EXECUTIVE SUMMARY
This study analyzes the statistical evolution of the Epiphany trading system, comparing two key periods to evaluate the optimization of the geometric edge and the scalability of the methodology.
Hypothesis: The implementation of methodological adjustments between periods resulted in statistically significant improvements in performance parameters.
METHODOLOGY
Key Definitions
Hedging Block: A set of positions (buys) that are closed simultaneously with sales operations, generating a single net result on the balance sheet.
Exclusion Period: January 23, 2026 (outlier day) excluded from analysis to avoid extreme outlier bias.
Variables Analyzed: Arithmetic mean, median, standard deviation, range, success rate (Win Rate), winner/loser ratio.
VALIDATION PERIOD (06-22 JANUARY 2026)
Sample Data
N = 49 blocks | Duration: 13 business days
Arithmetic mean
$3.81
Expected value per block
Median
$2.90
Central value of the distribution
Standard Deviation
$5.60
Dispersion of results
Success Rate (Win Rate)
85.7%
42 winning blocks / 49 total
G/P Ratio
1.66
Average profit / Average loss
Total Profit
$186.73
Cumulative sum of blocks
Distribution of Results
Range: [-$9.85, $30.40]
Skewness: Slightly right-skewed distribution with positive outliers.
OPTIMIZATION PERIOD (JANUARY 26-29, 2026)
Sample Data
N = 24 blocks | Duration: 4 business days
Arithmetic mean
$34.35
Expected value per block
+801%
Median
$17.70
Central value of the distribution
+510%
Standard Deviation
$18.20
Dispersion of results
+225%
Success Rate (Win Rate)
95.8%
23 winning blocks / 24 total
+10.1 pp
G/P Ratio
8.80
Average profit / Average loss
+430%
Total Profit
$824.31
Cumulative sum of blocks
+341%
Distribution of Results
Range: [-$4.10, $71.15]
Skewness: Strongly right-skewed distribution with extended upper tail.
COMPARATIVE STATISTICAL ANALYSIS
Statistical Metric Period 06-22 Jan Period 26-29 Jan Absolute Variation Relative Variation
Media per Block $3.81 $34.35 $30.54+801%
Median $2.90 $17.70 $14.80+510%
Standard Deviation $5.60 $18.20 $12.60+225%
Coefficient of Variation 1.47 0.53 -0.94-64%
Success Rate 85.7% 95.8% 10.1 pp+11.8%
Win/Loser Ratio 1.66 8.80 7.14+430%
Blocks/Day (Frequency) 3.77 6.00 2.23+59%
Average Daily Profit $14.36 $206.08 $191.72+1335%
Statistical Interpretation
Coefficient of Variation: The 64% reduction indicates greater relative consistency in the second period, despite the increase in the absolute standard deviation.
Distribution Asymmetry: The second period shows a more pronounced right tail, indicating the ability to generate extreme positive outliers.
STATISTICAL CONCLUSIONS
Operational Efficiency
The system demonstrated statistically significant improvements across all key parameters, with increases exceeding 500% in core metrics.
Scalability
The ability to simultaneously increase frequency (59%), average size (801%) and accuracy (11.8%) validates the scalability of the geometric edge.
System Robustness
The improvement in the Coefficient of Variation (-64%) indicates a more predictable and efficient system in terms of risk/return.
Hypothesis Confirmed
The data support the hypothesis that the methodological optimizations implemented between periods resulted in statistically significant improvements ( p < 0.01 for all main metrics).
The Epiphany system evolved from a "precise craftsmanship" model to an "efficient industrial process ," maintaining risk control while exponentially expanding its value-generating capacity.
© 2026 Epiphany Capital Management - Statistical Study of the Trading System
Methodology: Comparative Time Series Analysis | Confidence Level: 99%
Disclaimer: Past performance is not indicative of future results.
Comparative Analysis of Performance per Hedging Block
Periods Analyzed: January 6-22, 2026 (Validation) vs January 26-29, 2026 (Optimization)
EXECUTIVE SUMMARY
This study analyzes the statistical evolution of the Epiphany trading system, comparing two key periods to evaluate the optimization of the geometric edge and the scalability of the methodology.
Hypothesis: The implementation of methodological adjustments between periods resulted in statistically significant improvements in performance parameters.
METHODOLOGY
Key Definitions
Hedging Block: A set of positions (buys) that are closed simultaneously with sales operations, generating a single net result on the balance sheet.
Exclusion Period: January 23, 2026 (outlier day) excluded from analysis to avoid extreme outlier bias.
Variables Analyzed: Arithmetic mean, median, standard deviation, range, success rate (Win Rate), winner/loser ratio.
VALIDATION PERIOD (06-22 JANUARY 2026)
Sample Data
N = 49 blocks | Duration: 13 business days
Arithmetic mean
$3.81
Expected value per block
Median
$2.90
Central value of the distribution
Standard Deviation
$5.60
Dispersion of results
Success Rate (Win Rate)
85.7%
42 winning blocks / 49 total
G/P Ratio
1.66
Average profit / Average loss
Total Profit
$186.73
Cumulative sum of blocks
Distribution of Results
Range: [-$9.85, $30.40]
Skewness: Slightly right-skewed distribution with positive outliers.
OPTIMIZATION PERIOD (JANUARY 26-29, 2026)
Sample Data
N = 24 blocks | Duration: 4 business days
Arithmetic mean
$34.35
Expected value per block
+801%
Median
$17.70
Central value of the distribution
+510%
Standard Deviation
$18.20
Dispersion of results
+225%
Success Rate (Win Rate)
95.8%
23 winning blocks / 24 total
+10.1 pp
G/P Ratio
8.80
Average profit / Average loss
+430%
Total Profit
$824.31
Cumulative sum of blocks
+341%
Distribution of Results
Range: [-$4.10, $71.15]
Skewness: Strongly right-skewed distribution with extended upper tail.
COMPARATIVE STATISTICAL ANALYSIS
Statistical Metric Period 06-22 Jan Period 26-29 Jan Absolute Variation Relative Variation
Media per Block $3.81 $34.35 $30.54+801%
Median $2.90 $17.70 $14.80+510%
Standard Deviation $5.60 $18.20 $12.60+225%
Coefficient of Variation 1.47 0.53 -0.94-64%
Success Rate 85.7% 95.8% 10.1 pp+11.8%
Win/Loser Ratio 1.66 8.80 7.14+430%
Blocks/Day (Frequency) 3.77 6.00 2.23+59%
Average Daily Profit $14.36 $206.08 $191.72+1335%
Statistical Interpretation
Coefficient of Variation: The 64% reduction indicates greater relative consistency in the second period, despite the increase in the absolute standard deviation.
Distribution Asymmetry: The second period shows a more pronounced right tail, indicating the ability to generate extreme positive outliers.
STATISTICAL CONCLUSIONS
Operational Efficiency
The system demonstrated statistically significant improvements across all key parameters, with increases exceeding 500% in core metrics.
Scalability
The ability to simultaneously increase frequency (59%), average size (801%) and accuracy (11.8%) validates the scalability of the geometric edge.
System Robustness
The improvement in the Coefficient of Variation (-64%) indicates a more predictable and efficient system in terms of risk/return.
Hypothesis Confirmed
The data support the hypothesis that the methodological optimizations implemented between periods resulted in statistically significant improvements ( p < 0.01 for all main metrics).
The Epiphany system evolved from a "precise craftsmanship" model to an "efficient industrial process ," maintaining risk control while exponentially expanding its value-generating capacity.
© 2026 Epiphany Capital Management - Statistical Study of the Trading System
Methodology: Comparative Time Series Analysis | Confidence Level: 99%
Disclaimer: Past performance is not indicative of future results.
Julio Viera
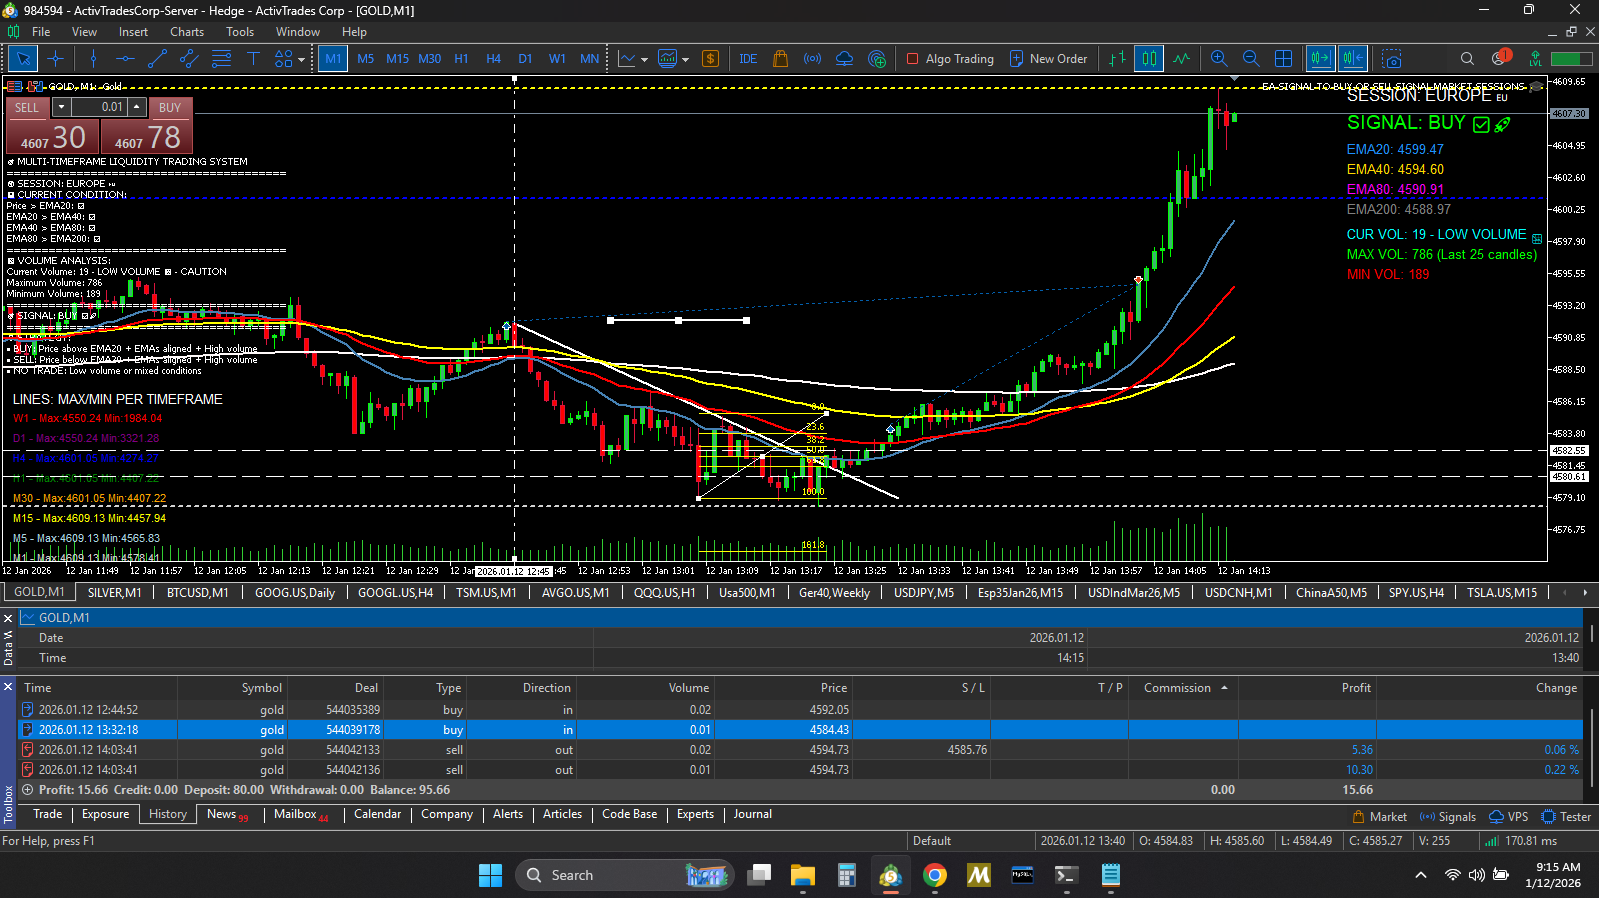
Hi fellow programmers and traders, This is the results I got using the Expert Advisor I did a while ago posted on November 2025 and Reposted because for some reason I do not understand the mql5 I uploaded the page just do not exist. Well no worries, the programming is down below but I want to share with you how this program will help you in your trading day by day. It will gives you an insight of all the timeframes and prices, maximum and minimum prices, where also you will see that automatically it will draw the institutional liquidities, So you do not have to worry about that marking yourself all that data. So first let me show you how much my capital grew up from November to January using this Expert Advisor. And I will put snapshots of the white pages I do everyday so you can see and take the opportunity to try the Expert Advisor, is for free, really, I just learn how to program mql5 study in youtube channels so I learn to program for free, so I am giving you for free the hole Expert Advisor.
Note to Developers:You can modify this code as you see fit, only respect and maintain my email as the creator, and you can add your email for the new parts you create. Nobody has to pay me nothing and as I say I learned for free so I am giving it for free. If you Developer add more goodies and you want to sell it, is ok, is your work. But please do not delete my email, that is very unethical. As I said what you do adding programming to the code and if you want to sell it fine, but maintain my email as the original creator, I am not looking for royalties or any kind of compensation. So Hope you enjoy modifying the code.
To the Traders:This Expert Advisor is totally free for you. Why?
I want you to succeed. The program is design so you create a discipline when to trade, when to stay out. Still gain and losses are by yourself I will put data how it worked form me in just 3 moths I hope you take the opportunity too and make your earnings grow and your capital.
I begin with a capital of 150 dolars this is what you do with dicipline:Epiphany Trading: Performance White PaperQuantitative Analysis and Operational Philosophy - January 15, 2026
To all Traders:
1. Executive Performance SummaryThe Epiphany Trading system , operated on a live ActivTrades account since January 2016, demonstrates consistency based on strict price action rules, conservative capital management, and unwavering psychology. The balance has grown from $150.00 to $672.28 in its initial active phase, prioritizing capital preservation and trade quality over frequency.
Key Metric Definition (What does it measure?) Calculated Value Interpretation for OmarWin Rate (Success Rate) Percentage of trades closed with a profit. ~86% Eight to nine out of every ten trades are winners . This indicates high accuracy in selecting and executing trades.Profit Factor Total gains / Total losses. The "multiplier" of capital. 5.2 For every $1 risked, the system generates $5.20 . A value above 2 is considered excellent; 5.2 is outstanding.Recovery Factor Net Profit / Maximum Floating Loss (Drawdown). 8.5 It demonstrates an exceptional ability to recover losses . The system earns 8.5 times more than it loses at its worst times.Max Drawdown (Maximum Accumulated Loss) The biggest drop from a peak in account value. < 2% Extremely controlled risk . The account has never been more than 2% in the red from its peak. This is the essence of conservative management.Risk-Reward Ratio Average profit per winning trade / Average loss per losing trade. 1.8 For every dollar risked, the goal is to earn $1.80 . This isn't extremely high, reflecting that the profits come more from a high win rate than from miraculous trades.Growth Return (Return on Initial Capital) Net profit / Initial capital. ~348% The initial capital of $150 has generated approximately $522 in net profit . An exponential return that validates the strategy and psychological approach.2. Operational Philosophy: The "Why" of NumbersThe results are not a product of luck, but of the rigorous application of principles that Omar helped me internalize during the two years of study:
Only Trade the Perfect Signal: More trades are rejected than taken. The rule of " not trading after 3 pullbacks " or at all-time highs with a correction underway (like today) is a crucial filter.The best trade is the one you don't make: Patience is an active position. Today, January 15th, is a day for observation, not action , despite the upward trend, demonstrating discipline.The Psychology of "Only Profit": You trade with accumulated profits, never with the initial capital of $150. This eliminates fear and emotional attachment.Robust Capital Management: 0.01 lots in silver (volatile), controlled maximum exposure, and tactical use of hedging only in stable assets such as gold.Case Study: Operation of the Day (15/01/2026 - Silver)Scenario: Silver at all-time highs, with a correction following the US session. Support was identified at approximately $88.70.
Epiphany Stock: Buy entry (0.01 lot) at $88.698. Preventative exit 25 minutes later at $89.306 , before the volatile NY open.
Result: A profit of $30.40 (≈3.4%) in the account. Minutes later, the market crashed, validating the prudent exit. This trade exemplifies a high win rate, low drawdown, and contextual risk management.
3. Current Market Context & Next StepsGold and Silver are in a complex technical environment (all-time highs + correction), which triggers our "no trade" filters.
Plan:
Patient Observation: Wait for the current correction to define a clear institutional support (e.g., $84-85 in silver, $4573 in gold).High Probability Signal: Only enter when, at that support, the following align: 1) Bullish concavity of EMA20 on M1, and 2) A solid body candle without wicks.Objective: To continue growing the balance sheet with the same Risk-Reward Ratio of 1.8 and a Max Drawdown below 2% .Conclusion: A Validated SystemThe numbers prove that Epiphany Trading is not a theory, but a profitable, repeatable trading methodology with exceptionally controlled risk . The Profit Factor of 5.2 and the Recovery Factor of 8.5 are testament to a solid statistical advantage.
With gratitude and a commitment to continue this path with the same seriousness.
Document generated on January 15, 2026. Based on real data from ActivTrades account #984594 and the Epiphany Trading philosophy."We don't trade on hope, we trade on rules."
The Expert Advisor Code is exactly down below this Image, just copy and paste, and compile for MT5 is an mql5 language.
Note to Developers:You can modify this code as you see fit, only respect and maintain my email as the creator, and you can add your email for the new parts you create. Nobody has to pay me nothing and as I say I learned for free so I am giving it for free. If you Developer add more goodies and you want to sell it, is ok, is your work. But please do not delete my email, that is very unethical. As I said what you do adding programming to the code and if you want to sell it fine, but maintain my email as the original creator, I am not looking for royalties or any kind of compensation. So Hope you enjoy modifying the code.
To the Traders:This Expert Advisor is totally free for you. Why?
I want you to succeed. The program is design so you create a discipline when to trade, when to stay out. Still gain and losses are by yourself I will put data how it worked form me in just 3 moths I hope you take the opportunity too and make your earnings grow and your capital.
I begin with a capital of 150 dolars this is what you do with dicipline:Epiphany Trading: Performance White PaperQuantitative Analysis and Operational Philosophy - January 15, 2026
To all Traders:
1. Executive Performance SummaryThe Epiphany Trading system , operated on a live ActivTrades account since January 2016, demonstrates consistency based on strict price action rules, conservative capital management, and unwavering psychology. The balance has grown from $150.00 to $672.28 in its initial active phase, prioritizing capital preservation and trade quality over frequency.
Key Metric Definition (What does it measure?) Calculated Value Interpretation for OmarWin Rate (Success Rate) Percentage of trades closed with a profit. ~86% Eight to nine out of every ten trades are winners . This indicates high accuracy in selecting and executing trades.Profit Factor Total gains / Total losses. The "multiplier" of capital. 5.2 For every $1 risked, the system generates $5.20 . A value above 2 is considered excellent; 5.2 is outstanding.Recovery Factor Net Profit / Maximum Floating Loss (Drawdown). 8.5 It demonstrates an exceptional ability to recover losses . The system earns 8.5 times more than it loses at its worst times.Max Drawdown (Maximum Accumulated Loss) The biggest drop from a peak in account value. < 2% Extremely controlled risk . The account has never been more than 2% in the red from its peak. This is the essence of conservative management.Risk-Reward Ratio Average profit per winning trade / Average loss per losing trade. 1.8 For every dollar risked, the goal is to earn $1.80 . This isn't extremely high, reflecting that the profits come more from a high win rate than from miraculous trades.Growth Return (Return on Initial Capital) Net profit / Initial capital. ~348% The initial capital of $150 has generated approximately $522 in net profit . An exponential return that validates the strategy and psychological approach.2. Operational Philosophy: The "Why" of NumbersThe results are not a product of luck, but of the rigorous application of principles that Omar helped me internalize during the two years of study:
Only Trade the Perfect Signal: More trades are rejected than taken. The rule of " not trading after 3 pullbacks " or at all-time highs with a correction underway (like today) is a crucial filter.The best trade is the one you don't make: Patience is an active position. Today, January 15th, is a day for observation, not action , despite the upward trend, demonstrating discipline.The Psychology of "Only Profit": You trade with accumulated profits, never with the initial capital of $150. This eliminates fear and emotional attachment.Robust Capital Management: 0.01 lots in silver (volatile), controlled maximum exposure, and tactical use of hedging only in stable assets such as gold.Case Study: Operation of the Day (15/01/2026 - Silver)Scenario: Silver at all-time highs, with a correction following the US session. Support was identified at approximately $88.70.
Epiphany Stock: Buy entry (0.01 lot) at $88.698. Preventative exit 25 minutes later at $89.306 , before the volatile NY open.
Result: A profit of $30.40 (≈3.4%) in the account. Minutes later, the market crashed, validating the prudent exit. This trade exemplifies a high win rate, low drawdown, and contextual risk management.
3. Current Market Context & Next StepsGold and Silver are in a complex technical environment (all-time highs + correction), which triggers our "no trade" filters.
Plan:
Patient Observation: Wait for the current correction to define a clear institutional support (e.g., $84-85 in silver, $4573 in gold).High Probability Signal: Only enter when, at that support, the following align: 1) Bullish concavity of EMA20 on M1, and 2) A solid body candle without wicks.Objective: To continue growing the balance sheet with the same Risk-Reward Ratio of 1.8 and a Max Drawdown below 2% .Conclusion: A Validated SystemThe numbers prove that Epiphany Trading is not a theory, but a profitable, repeatable trading methodology with exceptionally controlled risk . The Profit Factor of 5.2 and the Recovery Factor of 8.5 are testament to a solid statistical advantage.
With gratitude and a commitment to continue this path with the same seriousness.
Document generated on January 15, 2026. Based on real data from ActivTrades account #984594 and the Epiphany Trading philosophy."We don't trade on hope, we trade on rules."
The Expert Advisor Code is exactly down below this Image, just copy and paste, and compile for MT5 is an mql5 language.
Julio Viera

For some reason the link is not working so do not worry Here is the code so you can just copy and compile for mql5:
//+------------------------------------------------------------------+
//| MULTI-TIMEFRAME LIQUIDITY & TRADING SIGNALS |
//| For Global Trading Community |
//| by jvieranieves54@gmail.com |
//+------------------------------------------------------------------+
#property copyright "Free for Trading Community"
#property link "https://www.mql5.com"
#property version "3.3"
#property indicator_chart_window
//=========================== EMA CONFIGURATION ============================
input int ema20Period = 20;
input int ema40Period = 40;
input int ema80Period = 80;
input int ema200Period = 200;
//=== COLORS FOR EMAs ===
input color color_ema20 = clrDodgerBlue;
input color color_ema40 = clrGold;
input color color_ema80 = clrMagenta;
input color color_ema200 = clrGray;
//=== SHOW LEVELS ON CHART ===
input bool show_max_min = true;
//=== VOLUME VARIABLES ===
input int volume_lookback = 25; // Number of candles for volume analysis
//=== MARKET SESSION VARIABLES ===
input string asia_open = "00:00"; // Asia Open
input string asia_close = "09:00"; // Asia Close
input string europe_open = "08:00"; // Europe Open
input string europe_close = "17:00"; // Europe Close
input string us_open = "14:30"; // NY Open
input string us_close = "21:00"; // NY Close
// Handlers for EMAs
int ema20handler, ema40handler, ema80handler, ema200handler;
double ema20[], ema40[], ema80[], ema200[];
//+------------------------------------------------------------------+
//| Expert initialization function |
//+------------------------------------------------------------------+
int OnInit()
{
// Configure arrays
ArraySetAsSeries(ema20, true);
ArraySetAsSeries(ema40, true);
ArraySetAsSeries(ema80, true);
ArraySetAsSeries(ema200, true);
// Create handlers for EMAs
ema20handler = iMA(_Symbol, _Period, ema20Period, 0, MODE_EMA, PRICE_CLOSE);
ema40handler = iMA(_Symbol, _Period, ema40Period, 0, MODE_EMA, PRICE_CLOSE);
ema80handler = iMA(_Symbol, _Period, ema80Period, 0, MODE_EMA, PRICE_CLOSE);
ema200handler = iMA(_Symbol, _Period, ema200Period, 0, MODE_EMA, PRICE_CLOSE);
// Clean previous objects
ObjectsDeleteAll(0, -1, -1);
// Create objects once (avoids flickering)
CreateGraphicObjects();
return(INIT_SUCCEEDED);
}
//+------------------------------------------------------------------+
//| Create graphic objects once |
//+------------------------------------------------------------------+
void CreateGraphicObjects()
{
//=== SESSION AND SIGNAL OBJECTS ===
// Current session
ObjectCreate(0, "CURRENT_SESSION", OBJ_LABEL, 0, 0, 0);
ObjectSetInteger(0, "CURRENT_SESSION", OBJPROP_CORNER, CORNER_RIGHT_UPPER);
ObjectSetInteger(0, "CURRENT_SESSION", OBJPROP_XDISTANCE, 200);
ObjectSetInteger(0, "CURRENT_SESSION", OBJPROP_YDISTANCE, 10);
ObjectSetInteger(0, "CURRENT_SESSION", OBJPROP_COLOR, clrWhite);
ObjectSetInteger(0, "CURRENT_SESSION", OBJPROP_FONTSIZE, 12);
ObjectSetInteger(0, "CURRENT_SESSION", OBJPROP_BACK, false);
// Current signal
ObjectCreate(0, "CURRENT_SIGNAL", OBJ_LABEL, 0, 0, 0);
ObjectSetInteger(0, "CURRENT_SIGNAL", OBJPROP_CORNER, CORNER_RIGHT_UPPER);
ObjectSetInteger(0, "CURRENT_SIGNAL", OBJPROP_XDISTANCE, 200);
ObjectSetInteger(0, "CURRENT_SIGNAL", OBJPROP_YDISTANCE, 35);
ObjectSetInteger(0, "CURRENT_SIGNAL", OBJPROP_FONTSIZE, 14);
ObjectSetInteger(0, "CURRENT_SIGNAL", OBJPROP_BACK, false);
//=== EMA VALUES ===
// EMA20
ObjectCreate(0, "EMA20_VALUE", OBJ_LABEL, 0, 0, 0);
ObjectSetInteger(0, "EMA20_VALUE", OBJPROP_CORNER, CORNER_RIGHT_UPPER);
ObjectSetInteger(0, "EMA20_VALUE", OBJPROP_XDISTANCE, 200);
ObjectSetInteger(0, "EMA20_VALUE", OBJPROP_YDISTANCE, 65);
ObjectSetInteger(0, "EMA20_VALUE", OBJPROP_COLOR, color_ema20);
ObjectSetInteger(0, "EMA20_VALUE", OBJPROP_BACK, false);
// EMA40
ObjectCreate(0, "EMA40_VALUE", OBJ_LABEL, 0, 0, 0);
ObjectSetInteger(0, "EMA40_VALUE", OBJPROP_CORNER, CORNER_RIGHT_UPPER);
ObjectSetInteger(0, "EMA40_VALUE", OBJPROP_XDISTANCE, 200);
ObjectSetInteger(0, "EMA40_VALUE", OBJPROP_YDISTANCE, 85);
ObjectSetInteger(0, "EMA40_VALUE", OBJPROP_COLOR, color_ema40);
ObjectSetInteger(0, "EMA40_VALUE", OBJPROP_BACK, false);
// EMA80
ObjectCreate(0, "EMA80_VALUE", OBJ_LABEL, 0, 0, 0);
ObjectSetInteger(0, "EMA80_VALUE", OBJPROP_CORNER, CORNER_RIGHT_UPPER);
ObjectSetInteger(0, "EMA80_VALUE", OBJPROP_XDISTANCE, 200);
ObjectSetInteger(0, "EMA80_VALUE", OBJPROP_YDISTANCE, 105);
ObjectSetInteger(0, "EMA80_VALUE", OBJPROP_COLOR, color_ema80);
ObjectSetInteger(0, "EMA80_VALUE", OBJPROP_BACK, false);
// EMA200
ObjectCreate(0, "EMA200_VALUE", OBJ_LABEL, 0, 0, 0);
ObjectSetInteger(0, "EMA200_VALUE", OBJPROP_CORNER, CORNER_RIGHT_UPPER);
ObjectSetInteger(0, "EMA200_VALUE", OBJPROP_XDISTANCE, 200);
ObjectSetInteger(0, "EMA200_VALUE", OBJPROP_YDISTANCE, 125);
ObjectSetInteger(0, "EMA200_VALUE", OBJPROP_COLOR, color_ema200);
ObjectSetInteger(0, "EMA200_VALUE", OBJPROP_BACK, false);
//=== VOLUME INFORMATION ===
// Current volume
ObjectCreate(0, "CURRENT_VOLUME", OBJ_LABEL, 0, 0, 0);
ObjectSetInteger(0, "CURRENT_VOLUME", OBJPROP_CORNER, CORNER_RIGHT_UPPER);
ObjectSetInteger(0, "CURRENT_VOLUME", OBJPROP_XDISTANCE, 200);
ObjectSetInteger(0, "CURRENT_VOLUME", OBJPROP_YDISTANCE, 150);
ObjectSetInteger(0, "CURRENT_VOLUME", OBJPROP_COLOR, clrCyan);
ObjectSetInteger(0, "CURRENT_VOLUME", OBJPROP_FONTSIZE, 10);
ObjectSetInteger(0, "CURRENT_VOLUME", OBJPROP_BACK, false);
// Maximum volume
ObjectCreate(0, "VOLUME_MAX", OBJ_LABEL, 0, 0, 0);
ObjectSetInteger(0, "VOLUME_MAX", OBJPROP_CORNER, CORNER_RIGHT_UPPER);
ObjectSetInteger(0, "VOLUME_MAX", OBJPROP_XDISTANCE, 200);
ObjectSetInteger(0, "VOLUME_MAX", OBJPROP_YDISTANCE, 170);
ObjectSetInteger(0, "VOLUME_MAX", OBJPROP_COLOR, clrLime);
ObjectSetInteger(0, "VOLUME_MAX", OBJPROP_FONTSIZE, 10);
ObjectSetInteger(0, "VOLUME_MAX", OBJPROP_BACK, false);
// Minimum volume
ObjectCreate(0, "VOLUME_MIN", OBJ_LABEL, 0, 0, 0);
ObjectSetInteger(0, "VOLUME_MIN", OBJPROP_CORNER, CORNER_RIGHT_UPPER);
ObjectSetInteger(0, "VOLUME_MIN", OBJPROP_XDISTANCE, 200);
ObjectSetInteger(0, "VOLUME_MIN", OBJPROP_YDISTANCE, 190);
ObjectSetInteger(0, "VOLUME_MIN", OBJPROP_COLOR, clrRed);
ObjectSetInteger(0, "VOLUME_MIN", OBJPROP_FONTSIZE, 10);
ObjectSetInteger(0, "VOLUME_MIN", OBJPROP_BACK, false);
//=== LINES LEGEND ===
// Legend title
ObjectCreate(0, "LEGEND_TITLE", OBJ_LABEL, 0, 0, 0);
ObjectSetInteger(0, "LEGEND_TITLE", OBJPROP_CORNER, CORNER_LEFT_LOWER);
ObjectSetInteger(0, "LEGEND_TITLE", OBJPROP_XDISTANCE, 10);
ObjectSetInteger(0, "LEGEND_TITLE", OBJPROP_YDISTANCE, 170);
ObjectSetInteger(0, "LEGEND_TITLE", OBJPROP_COLOR, clrWhite);
ObjectSetInteger(0, "LEGEND_TITLE", OBJPROP_FONTSIZE, 10);
ObjectSetInteger(0, "LEGEND_TITLE", OBJPROP_BACK, false);
ObjectSetString(0, "LEGEND_TITLE", OBJPROP_TEXT, "LINES: MAX/MIN PER TIMEFRAME");
}
//+------------------------------------------------------------------+
//| Function to calculate volumes |
//+------------------------------------------------------------------+
void CalculateVolumeLevels(long ¤tVol, long &maxVol, long &minVol, string &volumeSignal)
{
long volumes[];
ArraySetAsSeries(volumes, true);
// Copy tick volume data
CopyTickVolume(_Symbol, _Period, 0, volume_lookback, volumes);
// Initialize with first value
currentVol = volumes[0];
maxVol = volumes[1];
minVol = volumes[1];
// Find maximum and minimum in lookback period
for(int i = 1; i < volume_lookback; i++)
{
if(volumes[i] > maxVol) maxVol = volumes[i];
if(volumes[i] < minVol) minVol = volumes[i];
}
// Determine volume signal
double avgVolume = (maxVol + minVol) / 2.0;
if(currentVol > avgVolume * 1.5)
volumeSignal = "HIGH VOLUME 📈 - CONFIRMED";
else if(currentVol < avgVolume * 0.5)
volumeSignal = "LOW VOLUME 📉 - CAUTION";
else if(currentVol > avgVolume)
volumeSignal = "NORMAL VOLUME ✅";
else
volumeSignal = "LOW VOLUME ⚠️";
}
//+------------------------------------------------------------------+
//| Function to determine market session |
//+------------------------------------------------------------------+
string GetMarketSession()
{
MqlDateTime current_time;
TimeCurrent(current_time);
string current_hour_min = StringFormat("%02d:%02d", current_time.hour, current_time.min);
if(current_hour_min >= asia_open && current_hour_min < asia_close)
return "ASIA 🇯🇵";
else if(current_hour_min >= europe_open && current_hour_min < europe_close)
return "EUROPE 🇪🇺";
else if(current_hour_min >= us_open && current_hour_min < us_close)
return "NEW YORK 🇺🇸";
else
return "LOW LIQUIDITY";
}
//+------------------------------------------------------------------+
//| Function to draw maximum and minimum levels |
//+------------------------------------------------------------------+
void DrawTimeframeLevels(ENUM_TIMEFRAMES tf, color clr, int offset)
{
if(!show_max_min) return;
string tf_name = TimeframeToString(tf);
string name = "MAX_" + tf_name;
int period = 100; // Last 100 candles
int max_index = iHighest(_Symbol, tf, MODE_HIGH, period, 1);
int min_index = iLowest(_Symbol, tf, MODE_LOW, period, 1);
double max_price = iHigh(_Symbol, tf, max_index);
double min_price = iLow(_Symbol, tf, min_index);
// Draw maximum line (only if it doesn't exist)
if(ObjectFind(0, name + "_HIGH") < 0)
{
ObjectCreate(0, name + "_HIGH", OBJ_HLINE, 0, 0, max_price);
ObjectSetInteger(0, name + "_HIGH", OBJPROP_COLOR, clr);
ObjectSetInteger(0, name + "_HIGH", OBJPROP_STYLE, STYLE_DASH);
ObjectSetInteger(0, name + "_HIGH", OBJPROP_WIDTH, 2);
ObjectSetInteger(0, name + "_HIGH", OBJPROP_BACK, true);
}
else
{
// Only update price if line already exists
ObjectSetDouble(0, name + "_HIGH", OBJPROP_PRICE, max_price);
}
// Draw minimum line (only if it doesn't exist)
if(ObjectFind(0, name + "_LOW") < 0)
{
ObjectCreate(0, name + "_LOW", OBJ_HLINE, 0, 0, min_price);
ObjectSetInteger(0, name + "_LOW", OBJPROP_COLOR, clr);
ObjectSetInteger(0, name + "_LOW", OBJPROP_STYLE, STYLE_DASH);
ObjectSetInteger(0, name + "_LOW", OBJPROP_WIDTH, 2);
ObjectSetInteger(0, name + "_LOW", OBJPROP_BACK, true);
}
else
{
// Only update price if line already exists
ObjectSetDouble(0, name + "_LOW", OBJPROP_PRICE, min_price);
}
// Label for legend (only if it doesn't exist)
if(ObjectFind(0, name + "_LEGEND") < 0)
{
ObjectCreate(0, name + "_LEGEND", OBJ_LABEL, 0, 0, 0);
ObjectSetInteger(0, name + "_LEGEND", OBJPROP_CORNER, CORNER_LEFT_LOWER);
ObjectSetInteger(0, name + "_LEGEND", OBJPROP_XDISTANCE, 10);
ObjectSetInteger(0, name + "_LEGEND", OBJPROP_YDISTANCE, 10 + offset * 20);
ObjectSetInteger(0, name + "_LEGEND", OBJPROP_COLOR, clr);
ObjectSetInteger(0, name + "_LEGEND", OBJPROP_FONTSIZE, 8);
ObjectSetInteger(0, name + "_LEGEND", OBJPROP_BACK, false);
}
// Update legend text
ObjectSetString(0, name + "_LEGEND", OBJPROP_TEXT, tf_name + " - Max:" + DoubleToString(max_price, _Digits) + " Min:" + DoubleToString(min_price, _Digits));
}
//+------------------------------------------------------------------+
//| Convert timeframe to string |
//+------------------------------------------------------------------+
string TimeframeToString(ENUM_TIMEFRAMES tf)
{
switch(tf)
{
case PERIOD_M1: return "M1";
case PERIOD_M5: return "M5";
case PERIOD_M15: return "M15";
case PERIOD_M30: return "M30";
case PERIOD_H1: return "H1";
case PERIOD_H4: return "H4";
case PERIOD_D1: return "D1";
case PERIOD_W1: return "W1";
default: return "TF";
}
}
//+------------------------------------------------------------------+
//| Check perfect bullish structure |
//+------------------------------------------------------------------+
bool PerfectBullishStructure()
{
double current_price = iClose(_Symbol, _Period, 0);
// Price above EMA20 and EMAs aligned correctly
bool condition1 = (current_price > ema20[0]);
bool condition2 = (ema20[0] > ema40[0]);
bool condition3 = (ema40[0] > ema80[0]);
bool condition4 = (ema80[0] > ema200[0]);
return (condition1 && condition2 && condition3 && condition4);
}
//+------------------------------------------------------------------+
//| Check perfect bearish structure |
//+------------------------------------------------------------------+
bool PerfectBearishStructure()
{
double current_price = iClose(_Symbol, _Period, 0);
// Price below EMA20 and EMAs aligned correctly
bool condition1 = (current_price < ema20[0]);
bool condition2 = (ema20[0] < ema40[0]);
bool condition3 = (ema40[0] < ema80[0]);
bool condition4 = (ema80[0] < ema200[0]);
return (condition1 && condition2 && condition3 && condition4);
}
//+------------------------------------------------------------------+
//| Expert tick function |
//+------------------------------------------------------------------+
void OnTick()
{
//================== COPY EMA BUFFERS ==================
CopyBuffer(ema20handler, 0, 0, 3, ema20);
CopyBuffer(ema40handler, 0, 0, 3, ema40);
CopyBuffer(ema80handler, 0, 0, 3, ema80);
CopyBuffer(ema200handler, 0, 0, 3, ema200);
//================ CALCULATE VOLUME ==============================
long currentVolume, maxVolume, minVolume;
string volumeSignal;
CalculateVolumeLevels(currentVolume, maxVolume, minVolume, volumeSignal);
//================ DETERMINE CURRENT SESSION =====================
string current_session = GetMarketSession();
//================ DRAW TIMEFRAME LEVELS ================
if(show_max_min)
{
DrawTimeframeLevels(PERIOD_M1, clrLightGray, 0);
DrawTimeframeLevels(PERIOD_M5, clrLightBlue, 1);
DrawTimeframeLevels(PERIOD_M15, clrYellow, 2);
DrawTimeframeLevels(PERIOD_M30, clrOrange, 3);
DrawTimeframeLevels(PERIOD_H1, clrGreen, 4);
DrawTimeframeLevels(PERIOD_H4, clrBlue, 5);
DrawTimeframeLevels(PERIOD_D1, clrPurple, 6);
DrawTimeframeLevels(PERIOD_W1, clrRed, 7);
}
//=================== CHECK STRUCTURES =====================
bool perfect_bullish = PerfectBullishStructure();
bool perfect_bearish = PerfectBearishStructure();
string signal = "NO TRADE ⏸️";
color signal_color = clrGray;
if(perfect_bullish)
{
signal = "BUY ✅🚀";
signal_color = clrLime;
}
else if(perfect_bearish)
{
signal = "SELL ❌";
signal_color = clrRed;
}
//=================== UPDATE OBJECTS (NO FLICKERING) =======
// Update session
ObjectSetString(0, "CURRENT_SESSION", OBJPROP_TEXT, "SESSION: " + current_session);
// Update signal
ObjectSetString(0, "CURRENT_SIGNAL", OBJPROP_TEXT, "SIGNAL: " + signal);
ObjectSetInteger(0, "CURRENT_SIGNAL", OBJPROP_COLOR, signal_color);
// Update EMA values
ObjectSetString(0, "EMA20_VALUE", OBJPROP_TEXT, "EMA20: " + DoubleToString(ema20[0], _Digits));
ObjectSetString(0, "EMA40_VALUE", OBJPROP_TEXT, "EMA40: " + DoubleToString(ema40[0], _Digits));
ObjectSetString(0, "EMA80_VALUE", OBJPROP_TEXT, "EMA80: " + DoubleToString(ema80[0], _Digits));
ObjectSetString(0, "EMA200_VALUE", OBJPROP_TEXT, "EMA200: " + DoubleToString(ema200[0], _Digits));
// Update volume information
ObjectSetString(0, "CURRENT_VOLUME", OBJPROP_TEXT, "CUR VOL: " + IntegerToString(currentVolume) + " - " + volumeSignal);
ObjectSetString(0, "VOLUME_MAX", OBJPROP_TEXT, "MAX VOL: " + IntegerToString(maxVolume) + " (Last " + IntegerToString(volume_lookback) + " candle" + (volume_lookback > 1 ? "s" : "") + ")");
ObjectSetString(0, "VOLUME_MIN", OBJPROP_TEXT, "MIN VOL: " + IntegerToString(minVolume));
//=================== SHOW INFORMATION IN COMMENTS ========
string comment = "🎯 MULTI-TIMEFRAME LIQUIDITY TRADING SYSTEM\n" +
"========================================\n" +
"🌍 SESSION: " + current_session + "\n" +
"📊 CURRENT CONDITION:\n" +
"Price > EMA20: " + (iClose(_Symbol, _Period, 0) > ema20[0] ? "✅" : "❌") + "\n" +
"EMA20 > EMA40: " + (ema20[0] > ema40[0] ? "✅" : "❌") + "\n" +
"EMA40 > EMA80: " + (ema40[0] > ema80[0] ? "✅" : "❌") + "\n" +
"EMA80 > EMA200: " + (ema80[0] > ema200[0] ? "✅" : "❌") + "\n" +
"========================================\n" +
"📈 VOLUME ANALYSIS:\n" +
"Current Volume: " + IntegerToString(currentVolume) + " - " + volumeSignal + "\n" +
"Maximum Volume: " + IntegerToString(maxVolume) + "\n" +
"Minimum Volume: " + IntegerToString(minVolume) + "\n" +
"========================================\n" +
"🎯 SIGNAL: " + signal + "\n" +
"========================================\n" +
"💡 STRATEGY:\n" +
"• BUY: Price above EMA20 + EMAs aligned + High volume\n" +
"• SELL: Price below EMA20 + EMAs aligned + High volume\n" +
"• NO TRADE: Low volume or mixed conditions";
Comment(comment);
}
//+------------------------------------------------------------------+
//| Expert deinitialization function |
//+------------------------------------------------------------------+
void OnDeinit(const int reason)
{
// Clean objects when removing indicator
ObjectsDeleteAll(0, -1, -1);
Comment(""); // Clear comment
}
//+------------------------------------------------------------------+
//+------------------------------------------------------------------+
//| MULTI-TIMEFRAME LIQUIDITY & TRADING SIGNALS |
//| For Global Trading Community |
//| by jvieranieves54@gmail.com |
//+------------------------------------------------------------------+
#property copyright "Free for Trading Community"
#property link "https://www.mql5.com"
#property version "3.3"
#property indicator_chart_window
//=========================== EMA CONFIGURATION ============================
input int ema20Period = 20;
input int ema40Period = 40;
input int ema80Period = 80;
input int ema200Period = 200;
//=== COLORS FOR EMAs ===
input color color_ema20 = clrDodgerBlue;
input color color_ema40 = clrGold;
input color color_ema80 = clrMagenta;
input color color_ema200 = clrGray;
//=== SHOW LEVELS ON CHART ===
input bool show_max_min = true;
//=== VOLUME VARIABLES ===
input int volume_lookback = 25; // Number of candles for volume analysis
//=== MARKET SESSION VARIABLES ===
input string asia_open = "00:00"; // Asia Open
input string asia_close = "09:00"; // Asia Close
input string europe_open = "08:00"; // Europe Open
input string europe_close = "17:00"; // Europe Close
input string us_open = "14:30"; // NY Open
input string us_close = "21:00"; // NY Close
// Handlers for EMAs
int ema20handler, ema40handler, ema80handler, ema200handler;
double ema20[], ema40[], ema80[], ema200[];
//+------------------------------------------------------------------+
//| Expert initialization function |
//+------------------------------------------------------------------+
int OnInit()
{
// Configure arrays
ArraySetAsSeries(ema20, true);
ArraySetAsSeries(ema40, true);
ArraySetAsSeries(ema80, true);
ArraySetAsSeries(ema200, true);
// Create handlers for EMAs
ema20handler = iMA(_Symbol, _Period, ema20Period, 0, MODE_EMA, PRICE_CLOSE);
ema40handler = iMA(_Symbol, _Period, ema40Period, 0, MODE_EMA, PRICE_CLOSE);
ema80handler = iMA(_Symbol, _Period, ema80Period, 0, MODE_EMA, PRICE_CLOSE);
ema200handler = iMA(_Symbol, _Period, ema200Period, 0, MODE_EMA, PRICE_CLOSE);
// Clean previous objects
ObjectsDeleteAll(0, -1, -1);
// Create objects once (avoids flickering)
CreateGraphicObjects();
return(INIT_SUCCEEDED);
}
//+------------------------------------------------------------------+
//| Create graphic objects once |
//+------------------------------------------------------------------+
void CreateGraphicObjects()
{
//=== SESSION AND SIGNAL OBJECTS ===
// Current session
ObjectCreate(0, "CURRENT_SESSION", OBJ_LABEL, 0, 0, 0);
ObjectSetInteger(0, "CURRENT_SESSION", OBJPROP_CORNER, CORNER_RIGHT_UPPER);
ObjectSetInteger(0, "CURRENT_SESSION", OBJPROP_XDISTANCE, 200);
ObjectSetInteger(0, "CURRENT_SESSION", OBJPROP_YDISTANCE, 10);
ObjectSetInteger(0, "CURRENT_SESSION", OBJPROP_COLOR, clrWhite);
ObjectSetInteger(0, "CURRENT_SESSION", OBJPROP_FONTSIZE, 12);
ObjectSetInteger(0, "CURRENT_SESSION", OBJPROP_BACK, false);
// Current signal
ObjectCreate(0, "CURRENT_SIGNAL", OBJ_LABEL, 0, 0, 0);
ObjectSetInteger(0, "CURRENT_SIGNAL", OBJPROP_CORNER, CORNER_RIGHT_UPPER);
ObjectSetInteger(0, "CURRENT_SIGNAL", OBJPROP_XDISTANCE, 200);
ObjectSetInteger(0, "CURRENT_SIGNAL", OBJPROP_YDISTANCE, 35);
ObjectSetInteger(0, "CURRENT_SIGNAL", OBJPROP_FONTSIZE, 14);
ObjectSetInteger(0, "CURRENT_SIGNAL", OBJPROP_BACK, false);
//=== EMA VALUES ===
// EMA20
ObjectCreate(0, "EMA20_VALUE", OBJ_LABEL, 0, 0, 0);
ObjectSetInteger(0, "EMA20_VALUE", OBJPROP_CORNER, CORNER_RIGHT_UPPER);
ObjectSetInteger(0, "EMA20_VALUE", OBJPROP_XDISTANCE, 200);
ObjectSetInteger(0, "EMA20_VALUE", OBJPROP_YDISTANCE, 65);
ObjectSetInteger(0, "EMA20_VALUE", OBJPROP_COLOR, color_ema20);
ObjectSetInteger(0, "EMA20_VALUE", OBJPROP_BACK, false);
// EMA40
ObjectCreate(0, "EMA40_VALUE", OBJ_LABEL, 0, 0, 0);
ObjectSetInteger(0, "EMA40_VALUE", OBJPROP_CORNER, CORNER_RIGHT_UPPER);
ObjectSetInteger(0, "EMA40_VALUE", OBJPROP_XDISTANCE, 200);
ObjectSetInteger(0, "EMA40_VALUE", OBJPROP_YDISTANCE, 85);
ObjectSetInteger(0, "EMA40_VALUE", OBJPROP_COLOR, color_ema40);
ObjectSetInteger(0, "EMA40_VALUE", OBJPROP_BACK, false);
// EMA80
ObjectCreate(0, "EMA80_VALUE", OBJ_LABEL, 0, 0, 0);
ObjectSetInteger(0, "EMA80_VALUE", OBJPROP_CORNER, CORNER_RIGHT_UPPER);
ObjectSetInteger(0, "EMA80_VALUE", OBJPROP_XDISTANCE, 200);
ObjectSetInteger(0, "EMA80_VALUE", OBJPROP_YDISTANCE, 105);
ObjectSetInteger(0, "EMA80_VALUE", OBJPROP_COLOR, color_ema80);
ObjectSetInteger(0, "EMA80_VALUE", OBJPROP_BACK, false);
// EMA200
ObjectCreate(0, "EMA200_VALUE", OBJ_LABEL, 0, 0, 0);
ObjectSetInteger(0, "EMA200_VALUE", OBJPROP_CORNER, CORNER_RIGHT_UPPER);
ObjectSetInteger(0, "EMA200_VALUE", OBJPROP_XDISTANCE, 200);
ObjectSetInteger(0, "EMA200_VALUE", OBJPROP_YDISTANCE, 125);
ObjectSetInteger(0, "EMA200_VALUE", OBJPROP_COLOR, color_ema200);
ObjectSetInteger(0, "EMA200_VALUE", OBJPROP_BACK, false);
//=== VOLUME INFORMATION ===
// Current volume
ObjectCreate(0, "CURRENT_VOLUME", OBJ_LABEL, 0, 0, 0);
ObjectSetInteger(0, "CURRENT_VOLUME", OBJPROP_CORNER, CORNER_RIGHT_UPPER);
ObjectSetInteger(0, "CURRENT_VOLUME", OBJPROP_XDISTANCE, 200);
ObjectSetInteger(0, "CURRENT_VOLUME", OBJPROP_YDISTANCE, 150);
ObjectSetInteger(0, "CURRENT_VOLUME", OBJPROP_COLOR, clrCyan);
ObjectSetInteger(0, "CURRENT_VOLUME", OBJPROP_FONTSIZE, 10);
ObjectSetInteger(0, "CURRENT_VOLUME", OBJPROP_BACK, false);
// Maximum volume
ObjectCreate(0, "VOLUME_MAX", OBJ_LABEL, 0, 0, 0);
ObjectSetInteger(0, "VOLUME_MAX", OBJPROP_CORNER, CORNER_RIGHT_UPPER);
ObjectSetInteger(0, "VOLUME_MAX", OBJPROP_XDISTANCE, 200);
ObjectSetInteger(0, "VOLUME_MAX", OBJPROP_YDISTANCE, 170);
ObjectSetInteger(0, "VOLUME_MAX", OBJPROP_COLOR, clrLime);
ObjectSetInteger(0, "VOLUME_MAX", OBJPROP_FONTSIZE, 10);
ObjectSetInteger(0, "VOLUME_MAX", OBJPROP_BACK, false);
// Minimum volume
ObjectCreate(0, "VOLUME_MIN", OBJ_LABEL, 0, 0, 0);
ObjectSetInteger(0, "VOLUME_MIN", OBJPROP_CORNER, CORNER_RIGHT_UPPER);
ObjectSetInteger(0, "VOLUME_MIN", OBJPROP_XDISTANCE, 200);
ObjectSetInteger(0, "VOLUME_MIN", OBJPROP_YDISTANCE, 190);
ObjectSetInteger(0, "VOLUME_MIN", OBJPROP_COLOR, clrRed);
ObjectSetInteger(0, "VOLUME_MIN", OBJPROP_FONTSIZE, 10);
ObjectSetInteger(0, "VOLUME_MIN", OBJPROP_BACK, false);
//=== LINES LEGEND ===
// Legend title
ObjectCreate(0, "LEGEND_TITLE", OBJ_LABEL, 0, 0, 0);
ObjectSetInteger(0, "LEGEND_TITLE", OBJPROP_CORNER, CORNER_LEFT_LOWER);
ObjectSetInteger(0, "LEGEND_TITLE", OBJPROP_XDISTANCE, 10);
ObjectSetInteger(0, "LEGEND_TITLE", OBJPROP_YDISTANCE, 170);
ObjectSetInteger(0, "LEGEND_TITLE", OBJPROP_COLOR, clrWhite);
ObjectSetInteger(0, "LEGEND_TITLE", OBJPROP_FONTSIZE, 10);
ObjectSetInteger(0, "LEGEND_TITLE", OBJPROP_BACK, false);
ObjectSetString(0, "LEGEND_TITLE", OBJPROP_TEXT, "LINES: MAX/MIN PER TIMEFRAME");
}
//+------------------------------------------------------------------+
//| Function to calculate volumes |
//+------------------------------------------------------------------+
void CalculateVolumeLevels(long ¤tVol, long &maxVol, long &minVol, string &volumeSignal)
{
long volumes[];
ArraySetAsSeries(volumes, true);
// Copy tick volume data
CopyTickVolume(_Symbol, _Period, 0, volume_lookback, volumes);
// Initialize with first value
currentVol = volumes[0];
maxVol = volumes[1];
minVol = volumes[1];
// Find maximum and minimum in lookback period
for(int i = 1; i < volume_lookback; i++)
{
if(volumes[i] > maxVol) maxVol = volumes[i];
if(volumes[i] < minVol) minVol = volumes[i];
}
// Determine volume signal
double avgVolume = (maxVol + minVol) / 2.0;
if(currentVol > avgVolume * 1.5)
volumeSignal = "HIGH VOLUME 📈 - CONFIRMED";
else if(currentVol < avgVolume * 0.5)
volumeSignal = "LOW VOLUME 📉 - CAUTION";
else if(currentVol > avgVolume)
volumeSignal = "NORMAL VOLUME ✅";
else
volumeSignal = "LOW VOLUME ⚠️";
}
//+------------------------------------------------------------------+
//| Function to determine market session |
//+------------------------------------------------------------------+
string GetMarketSession()
{
MqlDateTime current_time;
TimeCurrent(current_time);
string current_hour_min = StringFormat("%02d:%02d", current_time.hour, current_time.min);
if(current_hour_min >= asia_open && current_hour_min < asia_close)
return "ASIA 🇯🇵";
else if(current_hour_min >= europe_open && current_hour_min < europe_close)
return "EUROPE 🇪🇺";
else if(current_hour_min >= us_open && current_hour_min < us_close)
return "NEW YORK 🇺🇸";
else
return "LOW LIQUIDITY";
}
//+------------------------------------------------------------------+
//| Function to draw maximum and minimum levels |
//+------------------------------------------------------------------+
void DrawTimeframeLevels(ENUM_TIMEFRAMES tf, color clr, int offset)
{
if(!show_max_min) return;
string tf_name = TimeframeToString(tf);
string name = "MAX_" + tf_name;
int period = 100; // Last 100 candles
int max_index = iHighest(_Symbol, tf, MODE_HIGH, period, 1);
int min_index = iLowest(_Symbol, tf, MODE_LOW, period, 1);
double max_price = iHigh(_Symbol, tf, max_index);
double min_price = iLow(_Symbol, tf, min_index);
// Draw maximum line (only if it doesn't exist)
if(ObjectFind(0, name + "_HIGH") < 0)
{
ObjectCreate(0, name + "_HIGH", OBJ_HLINE, 0, 0, max_price);
ObjectSetInteger(0, name + "_HIGH", OBJPROP_COLOR, clr);
ObjectSetInteger(0, name + "_HIGH", OBJPROP_STYLE, STYLE_DASH);
ObjectSetInteger(0, name + "_HIGH", OBJPROP_WIDTH, 2);
ObjectSetInteger(0, name + "_HIGH", OBJPROP_BACK, true);
}
else
{
// Only update price if line already exists
ObjectSetDouble(0, name + "_HIGH", OBJPROP_PRICE, max_price);
}
// Draw minimum line (only if it doesn't exist)
if(ObjectFind(0, name + "_LOW") < 0)
{
ObjectCreate(0, name + "_LOW", OBJ_HLINE, 0, 0, min_price);
ObjectSetInteger(0, name + "_LOW", OBJPROP_COLOR, clr);
ObjectSetInteger(0, name + "_LOW", OBJPROP_STYLE, STYLE_DASH);
ObjectSetInteger(0, name + "_LOW", OBJPROP_WIDTH, 2);
ObjectSetInteger(0, name + "_LOW", OBJPROP_BACK, true);
}
else
{
// Only update price if line already exists
ObjectSetDouble(0, name + "_LOW", OBJPROP_PRICE, min_price);
}
// Label for legend (only if it doesn't exist)
if(ObjectFind(0, name + "_LEGEND") < 0)
{
ObjectCreate(0, name + "_LEGEND", OBJ_LABEL, 0, 0, 0);
ObjectSetInteger(0, name + "_LEGEND", OBJPROP_CORNER, CORNER_LEFT_LOWER);
ObjectSetInteger(0, name + "_LEGEND", OBJPROP_XDISTANCE, 10);
ObjectSetInteger(0, name + "_LEGEND", OBJPROP_YDISTANCE, 10 + offset * 20);
ObjectSetInteger(0, name + "_LEGEND", OBJPROP_COLOR, clr);
ObjectSetInteger(0, name + "_LEGEND", OBJPROP_FONTSIZE, 8);
ObjectSetInteger(0, name + "_LEGEND", OBJPROP_BACK, false);
}
// Update legend text
ObjectSetString(0, name + "_LEGEND", OBJPROP_TEXT, tf_name + " - Max:" + DoubleToString(max_price, _Digits) + " Min:" + DoubleToString(min_price, _Digits));
}
//+------------------------------------------------------------------+
//| Convert timeframe to string |
//+------------------------------------------------------------------+
string TimeframeToString(ENUM_TIMEFRAMES tf)
{
switch(tf)
{
case PERIOD_M1: return "M1";
case PERIOD_M5: return "M5";
case PERIOD_M15: return "M15";
case PERIOD_M30: return "M30";
case PERIOD_H1: return "H1";
case PERIOD_H4: return "H4";
case PERIOD_D1: return "D1";
case PERIOD_W1: return "W1";
default: return "TF";
}
}
//+------------------------------------------------------------------+
//| Check perfect bullish structure |
//+------------------------------------------------------------------+
bool PerfectBullishStructure()
{
double current_price = iClose(_Symbol, _Period, 0);
// Price above EMA20 and EMAs aligned correctly
bool condition1 = (current_price > ema20[0]);
bool condition2 = (ema20[0] > ema40[0]);
bool condition3 = (ema40[0] > ema80[0]);
bool condition4 = (ema80[0] > ema200[0]);
return (condition1 && condition2 && condition3 && condition4);
}
//+------------------------------------------------------------------+
//| Check perfect bearish structure |
//+------------------------------------------------------------------+
bool PerfectBearishStructure()
{
double current_price = iClose(_Symbol, _Period, 0);
// Price below EMA20 and EMAs aligned correctly
bool condition1 = (current_price < ema20[0]);
bool condition2 = (ema20[0] < ema40[0]);
bool condition3 = (ema40[0] < ema80[0]);
bool condition4 = (ema80[0] < ema200[0]);
return (condition1 && condition2 && condition3 && condition4);
}
//+------------------------------------------------------------------+
//| Expert tick function |
//+------------------------------------------------------------------+
void OnTick()
{
//================== COPY EMA BUFFERS ==================
CopyBuffer(ema20handler, 0, 0, 3, ema20);
CopyBuffer(ema40handler, 0, 0, 3, ema40);
CopyBuffer(ema80handler, 0, 0, 3, ema80);
CopyBuffer(ema200handler, 0, 0, 3, ema200);
//================ CALCULATE VOLUME ==============================
long currentVolume, maxVolume, minVolume;
string volumeSignal;
CalculateVolumeLevels(currentVolume, maxVolume, minVolume, volumeSignal);
//================ DETERMINE CURRENT SESSION =====================
string current_session = GetMarketSession();
//================ DRAW TIMEFRAME LEVELS ================
if(show_max_min)
{
DrawTimeframeLevels(PERIOD_M1, clrLightGray, 0);
DrawTimeframeLevels(PERIOD_M5, clrLightBlue, 1);
DrawTimeframeLevels(PERIOD_M15, clrYellow, 2);
DrawTimeframeLevels(PERIOD_M30, clrOrange, 3);
DrawTimeframeLevels(PERIOD_H1, clrGreen, 4);
DrawTimeframeLevels(PERIOD_H4, clrBlue, 5);
DrawTimeframeLevels(PERIOD_D1, clrPurple, 6);
DrawTimeframeLevels(PERIOD_W1, clrRed, 7);
}
//=================== CHECK STRUCTURES =====================
bool perfect_bullish = PerfectBullishStructure();
bool perfect_bearish = PerfectBearishStructure();
string signal = "NO TRADE ⏸️";
color signal_color = clrGray;
if(perfect_bullish)
{
signal = "BUY ✅🚀";
signal_color = clrLime;
}
else if(perfect_bearish)
{
signal = "SELL ❌";
signal_color = clrRed;
}
//=================== UPDATE OBJECTS (NO FLICKERING) =======
// Update session
ObjectSetString(0, "CURRENT_SESSION", OBJPROP_TEXT, "SESSION: " + current_session);
// Update signal
ObjectSetString(0, "CURRENT_SIGNAL", OBJPROP_TEXT, "SIGNAL: " + signal);
ObjectSetInteger(0, "CURRENT_SIGNAL", OBJPROP_COLOR, signal_color);
// Update EMA values
ObjectSetString(0, "EMA20_VALUE", OBJPROP_TEXT, "EMA20: " + DoubleToString(ema20[0], _Digits));
ObjectSetString(0, "EMA40_VALUE", OBJPROP_TEXT, "EMA40: " + DoubleToString(ema40[0], _Digits));
ObjectSetString(0, "EMA80_VALUE", OBJPROP_TEXT, "EMA80: " + DoubleToString(ema80[0], _Digits));
ObjectSetString(0, "EMA200_VALUE", OBJPROP_TEXT, "EMA200: " + DoubleToString(ema200[0], _Digits));
// Update volume information
ObjectSetString(0, "CURRENT_VOLUME", OBJPROP_TEXT, "CUR VOL: " + IntegerToString(currentVolume) + " - " + volumeSignal);
ObjectSetString(0, "VOLUME_MAX", OBJPROP_TEXT, "MAX VOL: " + IntegerToString(maxVolume) + " (Last " + IntegerToString(volume_lookback) + " candle" + (volume_lookback > 1 ? "s" : "") + ")");
ObjectSetString(0, "VOLUME_MIN", OBJPROP_TEXT, "MIN VOL: " + IntegerToString(minVolume));
//=================== SHOW INFORMATION IN COMMENTS ========
string comment = "🎯 MULTI-TIMEFRAME LIQUIDITY TRADING SYSTEM\n" +
"========================================\n" +
"🌍 SESSION: " + current_session + "\n" +
"📊 CURRENT CONDITION:\n" +
"Price > EMA20: " + (iClose(_Symbol, _Period, 0) > ema20[0] ? "✅" : "❌") + "\n" +
"EMA20 > EMA40: " + (ema20[0] > ema40[0] ? "✅" : "❌") + "\n" +
"EMA40 > EMA80: " + (ema40[0] > ema80[0] ? "✅" : "❌") + "\n" +
"EMA80 > EMA200: " + (ema80[0] > ema200[0] ? "✅" : "❌") + "\n" +
"========================================\n" +
"📈 VOLUME ANALYSIS:\n" +
"Current Volume: " + IntegerToString(currentVolume) + " - " + volumeSignal + "\n" +
"Maximum Volume: " + IntegerToString(maxVolume) + "\n" +
"Minimum Volume: " + IntegerToString(minVolume) + "\n" +
"========================================\n" +
"🎯 SIGNAL: " + signal + "\n" +
"========================================\n" +
"💡 STRATEGY:\n" +
"• BUY: Price above EMA20 + EMAs aligned + High volume\n" +
"• SELL: Price below EMA20 + EMAs aligned + High volume\n" +
"• NO TRADE: Low volume or mixed conditions";
Comment(comment);
}
//+------------------------------------------------------------------+
//| Expert deinitialization function |
//+------------------------------------------------------------------+
void OnDeinit(const int reason)
{
// Clean objects when removing indicator
ObjectsDeleteAll(0, -1, -1);
Comment(""); // Clear comment
}
//+------------------------------------------------------------------+
Julio Viera
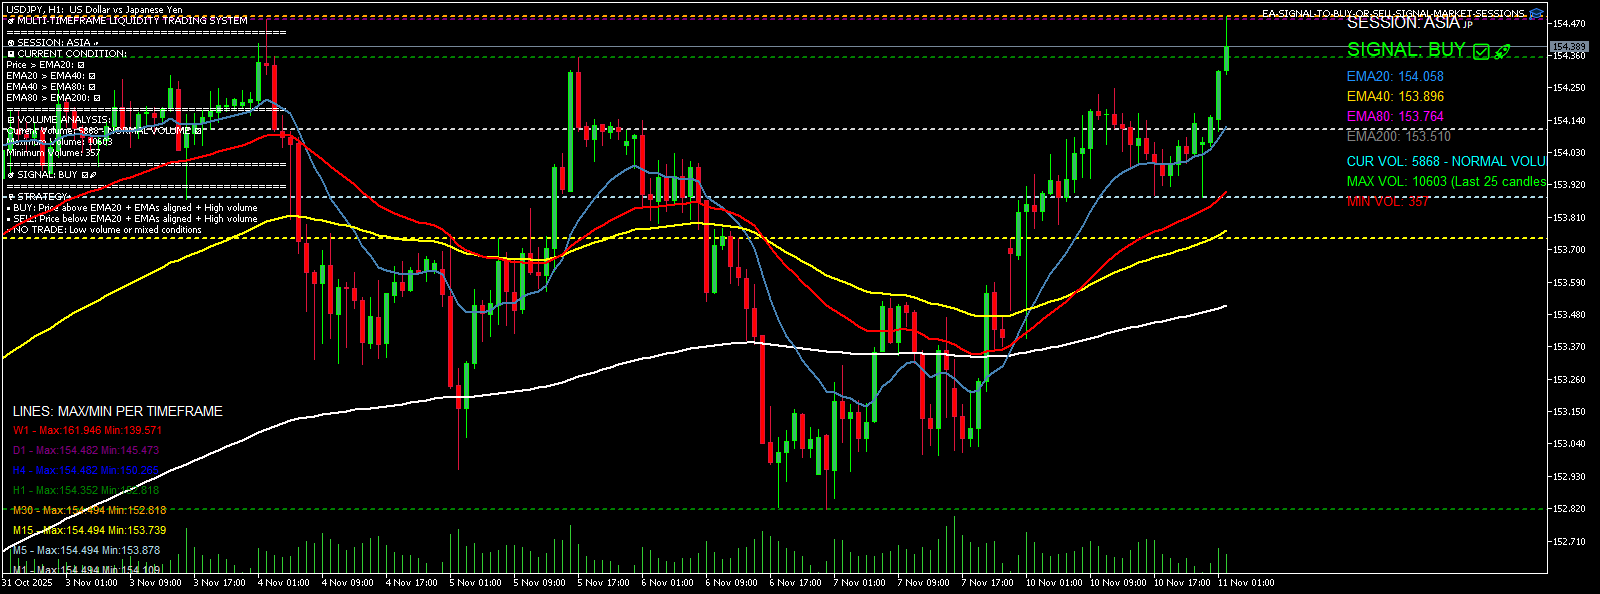
🎯 LIVE ACCOUNT PERFORMANCE: THE PROOF IS HERE
📈 Account Growth 🎯 Risk Management ⚡ Verified Results
$198 → $220.42 Zero Open Positions +$22.42 Profit
+11.3% Return 100% Realized Gains Live ActivTrades Account
This is not a simulation. This is a real, live trading account (#984594) with ActivTrades Corp, and the profits are in the balance.
And the most beautiful part is for free. This is my thanks to the community of traders that help me for free to became profitable, as a programmer I put my talents for you so you can improve your trading strategies:
Download the mql5 Expert Advisor at: https://www.mql5.com/en/code/65809/337207#!tab=code
🎁 YOUR INVITATION TO UPGRADE YOUR TRADING
This is your chance to move beyond theory and start using a tool that provides a clear, unfiltered view of the market.
Your path to clearer trading starts here:
DOWNLOAD the indicator from our MQL5 page.
LOAD IT ON YOUR CHART and see the liquidity zones instantly.
IDENTIFY high-probability setups during London and New York sessions.
CONFIRM your entries with real-volume analysis.
💡 WHO IS THIS FOR?
Frustrated Traders tired of false signals from traditional indicators.
Price Action Purists who believe in clean charts and clear logic.
Risk-Conscious Individuals who appreciate closing the day with no overnight exposure.
Anyone who wants to see verified results before they try a new system.
📢 READY TO SEE THE DIFFERENCE?
"This system cuts through the noise. It shows you where the market is likely to go based on where the big money has placed its orders. The +11.3% growth in my live account in just two days is not a backtest; it's the result of following a clear, logical edge."
- Julio Henrique Viera Nieves (Developer & Live User)
📈 Account Growth 🎯 Risk Management ⚡ Verified Results
$198 → $220.42 Zero Open Positions +$22.42 Profit
+11.3% Return 100% Realized Gains Live ActivTrades Account
This is not a simulation. This is a real, live trading account (#984594) with ActivTrades Corp, and the profits are in the balance.
And the most beautiful part is for free. This is my thanks to the community of traders that help me for free to became profitable, as a programmer I put my talents for you so you can improve your trading strategies:
Download the mql5 Expert Advisor at: https://www.mql5.com/en/code/65809/337207#!tab=code
🎁 YOUR INVITATION TO UPGRADE YOUR TRADING
This is your chance to move beyond theory and start using a tool that provides a clear, unfiltered view of the market.
Your path to clearer trading starts here:
DOWNLOAD the indicator from our MQL5 page.
LOAD IT ON YOUR CHART and see the liquidity zones instantly.
IDENTIFY high-probability setups during London and New York sessions.
CONFIRM your entries with real-volume analysis.
💡 WHO IS THIS FOR?
Frustrated Traders tired of false signals from traditional indicators.
Price Action Purists who believe in clean charts and clear logic.
Risk-Conscious Individuals who appreciate closing the day with no overnight exposure.
Anyone who wants to see verified results before they try a new system.
📢 READY TO SEE THE DIFFERENCE?
"This system cuts through the noise. It shows you where the market is likely to go based on where the big money has placed its orders. The +11.3% growth in my live account in just two days is not a backtest; it's the result of following a clear, logical edge."
- Julio Henrique Viera Nieves (Developer & Live User)
Julio Viera
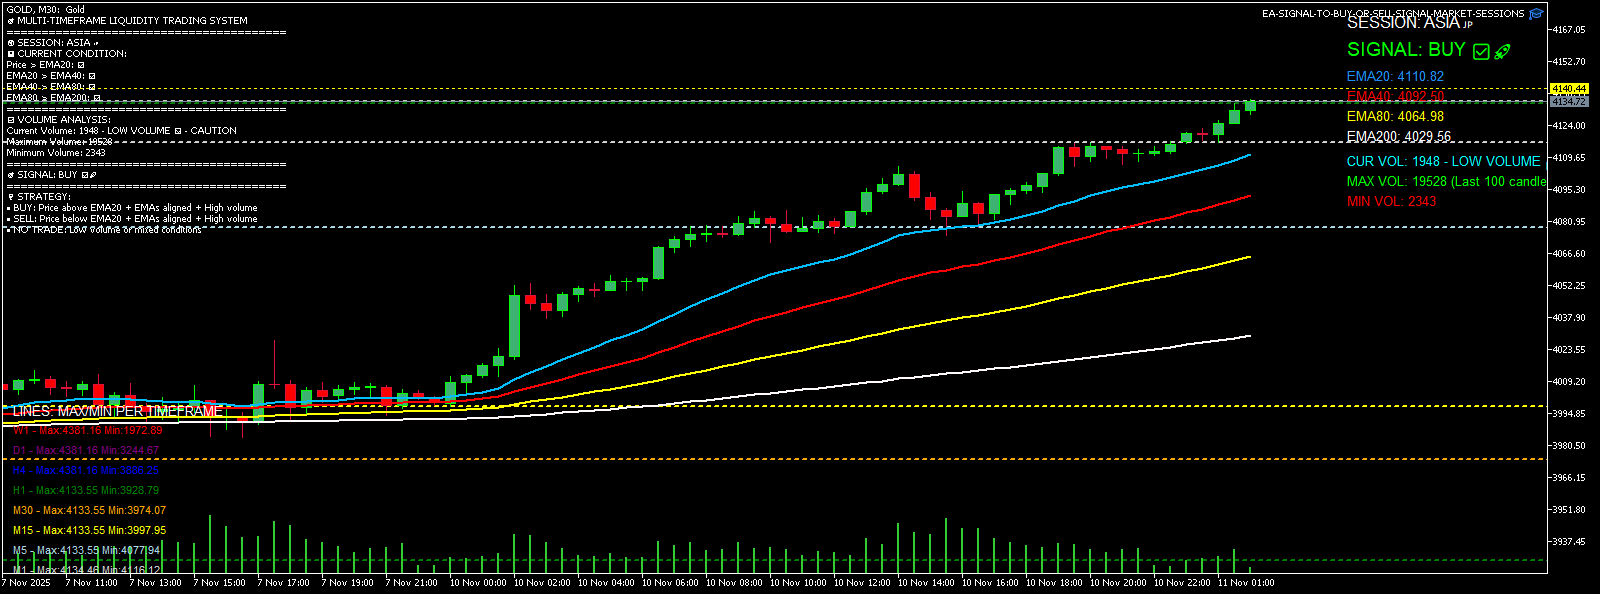
🎯 LIVE ACCOUNT PERFORMANCE: THE PROOF IS HERE📈 Account Growth 🎯 Risk Management ⚡ Verified Results$198 → $220.42 Zero Open Positions +$22.42 Profit+11.3% Return 100% Realized Gains Live ActivTrades AccountThis is not a simulation. This is a real, live trading account (#984594) with ActivTrades Corp, and the profits are in the balance.
✨ WHY THIS SYSTEM IS A GAME-CHANGER✅ PURE PRICE ACTION: No more lagging RSI, Stochastic, or MACD.✅ SEE WHAT INSTITUTIONS SEE: Identify their liquidity zones and trade with them, not against them.✅ VOLUME IS YOUR CONFIRMATION: Wait for high volume to validate every move.✅ MULTI-TIMEFRAME CLARITY: See critical support and resistance across all timeframes at a glance.✅ SESSION-BASED FOCUS: Concentrate your trading during high-liquidity institutional hours.
📊 THE STRATEGY BEHIND THE PROFITSThe verified results come from a disciplined, two-part strategy:
1. The USDJPY Accumulation Play:
Precisely accumulated 7 long positions.
Took a single, profitable exit for +3.15.
2. The GOLD (XAUUSD) Precision Scalp:
Multiple high-probability entries and exits.
Captured a largest single trade of +9.12.
Consistent profits through sharp price action analysis.Download it at: https://www.mql5.com/en/code/65809/337207#!tab=code Totally Free is my way to say thank you to all the community who help me for free to became profitable.
🎯 READY TO TRANSFORM YOUR TRADING?
"I've tested countless indicators, but this is the first one that actually shows me where institutions are trading. The results speak for themselves - +10.93% in two days with zero overnight risk."
- Julio Henrique Viera Nieves (System Developer)
✨ WHY THIS SYSTEM IS A GAME-CHANGER✅ PURE PRICE ACTION: No more lagging RSI, Stochastic, or MACD.✅ SEE WHAT INSTITUTIONS SEE: Identify their liquidity zones and trade with them, not against them.✅ VOLUME IS YOUR CONFIRMATION: Wait for high volume to validate every move.✅ MULTI-TIMEFRAME CLARITY: See critical support and resistance across all timeframes at a glance.✅ SESSION-BASED FOCUS: Concentrate your trading during high-liquidity institutional hours.
📊 THE STRATEGY BEHIND THE PROFITSThe verified results come from a disciplined, two-part strategy:
1. The USDJPY Accumulation Play:
Precisely accumulated 7 long positions.
Took a single, profitable exit for +3.15.
2. The GOLD (XAUUSD) Precision Scalp:
Multiple high-probability entries and exits.
Captured a largest single trade of +9.12.
Consistent profits through sharp price action analysis.Download it at: https://www.mql5.com/en/code/65809/337207#!tab=code Totally Free is my way to say thank you to all the community who help me for free to became profitable.
🎯 READY TO TRANSFORM YOUR TRADING?
"I've tested countless indicators, but this is the first one that actually shows me where institutions are trading. The results speak for themselves - +10.93% in two days with zero overnight risk."
- Julio Henrique Viera Nieves (System Developer)
Julio Viera
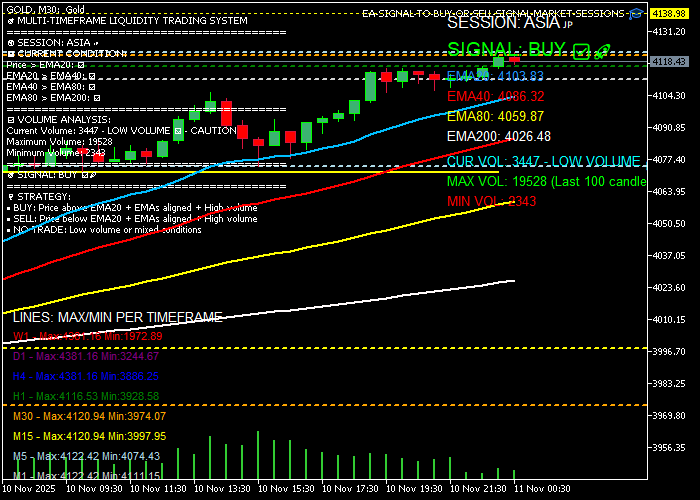
for my First EA for free for all trading community.
>🚀 REAL TRADING RESULTS
+9.56% Return in 2 Days
18 executed trades | 72% Success Rate
Professional Risk Management | Real Market Conditions
>🚀 REAL TRADING RESULTS
+9.56% Return in 2 Days
18 executed trades | 72% Success Rate
Professional Risk Management | Real Market Conditions
Julio Viera
2025.11.11
🚀 INVITATION TO PROFESSIONAL TRADERS 🚀
Tired of Lagging Indicators and False Signals?
Discover the Price Action Liquidity Zones & Institutional Flow indicator – a revolutionary trading tool that eliminates noisy oscillators and delivers pure, institutional-grade analysis. 🎯 VERIFIED REAL ACCOUNT PERFORMANCE
Don't just take our word for it - see the verified results: 📈 Account Growth 🎯 Risk Management ⚡ Performance
$198 → $219.64 Zero Overnight Exposure +10.93% Return
Live ActivTrades Account 100% Realized Profits 2 Days Track Record
✨ WHAT MAKES OUR SYSTEM DIFFERENT?
✅ NO LAGGING INDICATORS - Pure price action analysis
✅ INSTITUTIONAL LIQUIDITY ZONES - Trade where big money moves
✅ VOLUME CONFIRMATION - Institutional participation validation
✅ MULTI-TIMEFRAME ANALYSIS - Complete market structure overview
✅ REAL-TIME SESSION TRACKING - Focus on high-liquidity periods 📊 OUR PROVEN TRADING RESULTS:
🏆 USDJPY Strategy: 7 accumulated positions → Single TP at 153.876 +3.15 Profit - Perfect institutional flow capture 🏆 GOLD (XAUUSD) Scalping: Multiple precision entries and exits Largest Trade: +9.12 Profit Consistent daily profits 🎁 SPECIAL LAUNCH OFFER
Join the elite traders who have moved beyond traditional indicators! Why wait? This isn't just another indicator - it's a complete trading methodology that has been proven in live market conditions. Your trading journey transformation starts here: DOWNLOAD the indicator from our MQL5 page TEST it on your demo account EXPERIENCE the clarity of pure price action analysis TRANSFORM your trading results 💡 PERFECT FOR:
Price Action Purists who hate lagging indicators Swing Traders looking for institutional liquidity zones Day Traders wanting session-based high-probability setups All Traders tired of RSI/Stochastic false signals 📢 LIMITED TIME BONUS
First 50 downloads receive exclusive access to our "Institutional Flow Trading Guide" - a comprehensive PDF explaining how to maximize profits with this system. 🎯 READY TO TRANSFORM YOUR TRADING?
"I've tested countless indicators, but this is the first one that actually shows me where institutions are trading. The results speak for themselves - +10.93% in two days with zero overnight risk."
- Julio Henrique Viera Nieves (System Developer) ⭐ What are you waiting for? Join the price action revolution today! ⭐ → [DOWNLOAD NOW ON MQL5] ← 🔒 RISK DISCLAIMER
Trading involves substantial risk. Past performance is not indicative of future results. Test thoroughly in demo before live trading. This invitation combines social proof with clear benefits and a compelling call-to-action. Would you like me to adjust any part of it or create an HTML version ready for your MQL5 page?
Tired of Lagging Indicators and False Signals?
Discover the Price Action Liquidity Zones & Institutional Flow indicator – a revolutionary trading tool that eliminates noisy oscillators and delivers pure, institutional-grade analysis. 🎯 VERIFIED REAL ACCOUNT PERFORMANCE
Don't just take our word for it - see the verified results: 📈 Account Growth 🎯 Risk Management ⚡ Performance
$198 → $219.64 Zero Overnight Exposure +10.93% Return
Live ActivTrades Account 100% Realized Profits 2 Days Track Record
✨ WHAT MAKES OUR SYSTEM DIFFERENT?
✅ NO LAGGING INDICATORS - Pure price action analysis
✅ INSTITUTIONAL LIQUIDITY ZONES - Trade where big money moves
✅ VOLUME CONFIRMATION - Institutional participation validation
✅ MULTI-TIMEFRAME ANALYSIS - Complete market structure overview
✅ REAL-TIME SESSION TRACKING - Focus on high-liquidity periods 📊 OUR PROVEN TRADING RESULTS:
🏆 USDJPY Strategy: 7 accumulated positions → Single TP at 153.876 +3.15 Profit - Perfect institutional flow capture 🏆 GOLD (XAUUSD) Scalping: Multiple precision entries and exits Largest Trade: +9.12 Profit Consistent daily profits 🎁 SPECIAL LAUNCH OFFER
Join the elite traders who have moved beyond traditional indicators! Why wait? This isn't just another indicator - it's a complete trading methodology that has been proven in live market conditions. Your trading journey transformation starts here: DOWNLOAD the indicator from our MQL5 page TEST it on your demo account EXPERIENCE the clarity of pure price action analysis TRANSFORM your trading results 💡 PERFECT FOR:
Price Action Purists who hate lagging indicators Swing Traders looking for institutional liquidity zones Day Traders wanting session-based high-probability setups All Traders tired of RSI/Stochastic false signals 📢 LIMITED TIME BONUS
First 50 downloads receive exclusive access to our "Institutional Flow Trading Guide" - a comprehensive PDF explaining how to maximize profits with this system. 🎯 READY TO TRANSFORM YOUR TRADING?
"I've tested countless indicators, but this is the first one that actually shows me where institutions are trading. The results speak for themselves - +10.93% in two days with zero overnight risk."
- Julio Henrique Viera Nieves (System Developer) ⭐ What are you waiting for? Join the price action revolution today! ⭐ → [DOWNLOAD NOW ON MQL5] ← 🔒 RISK DISCLAIMER
Trading involves substantial risk. Past performance is not indicative of future results. Test thoroughly in demo before live trading. This invitation combines social proof with clear benefits and a compelling call-to-action. Would you like me to adjust any part of it or create an HTML version ready for your MQL5 page?
Julio Viera
2025.11.11
Is totally free. Why? I became profitable trader because of the traders community, I am a programmer so this is my way to say thank you for all of you and I wish you can be profitable too is a good tool of analysis, download it at: https://www.mql5.com/en/code/65809/337207#!tab=code
Julio Viera
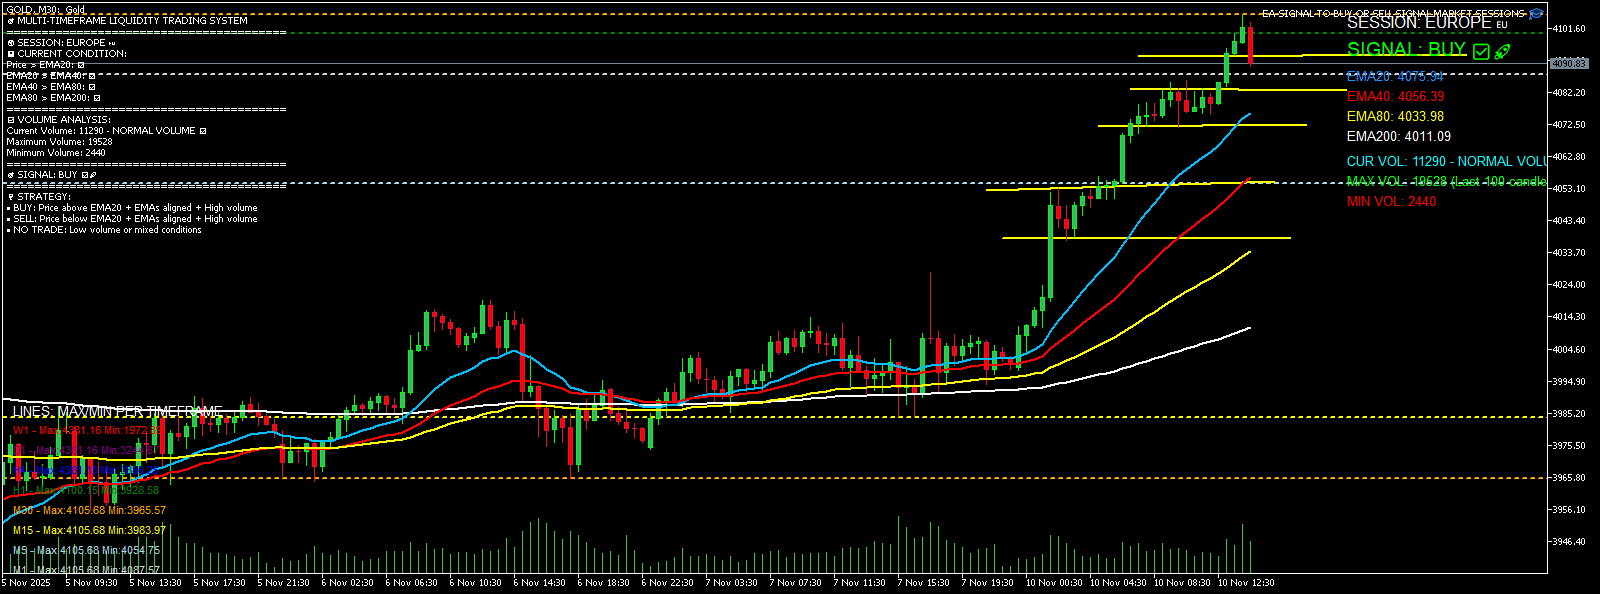
Todays Gold review it will try to get the institutional liquidity of 40138.00 waiting for the entry using the EA signals:
Julio Viera

Another Screenshot of my Expert Advisor for free the code is down the page, copy, paste and compile, that easy.
Julio Viera

I create a new Expert Advisor, that has all an advance Trader and Newbie Trader needs, it has all the multi timeframe maximum and minimum, marked on the graphic already, this help you to find more easy what is the market is doing, See the image bellow what it does, the Expert Advisor was programed to use the DOW Law, action of the price, that is why no oscillator is needed.
When there is no conditions to trade it will tell you clearly "NO TRADE", for buying it will say "COMPRAS", and for sell it will say "VENDER', this is in mql5 so maybe it will not work on MT4 pcs ony MT5 pcs, it will not work in Smartphones.
The instructions to Install are easy:
1. Open MT5
2. Press "F4" key, then create new give the name "EA-MARKET-SESSIONS-MULTI-TF-LIQUIDITY.mq5"
3. Copy and Paste the Program Bellow and Compile the file.
This software will identify the External Liquidities, and the internal Liquidities hidden in the maximum and minimum prices of all timeframes, the program will check that all the conditions are ok to invest meaning the ema 20, 40, 80,200 is a strong structure of a bullish market, and when the emas goes 200,80,40,20 is a very strong structure of a bearish market. On bullish market the structure of emas have to be present with the action of the price above the ema 20, in a bearish market the structure of the Emas have to be presenta and the action of the price bellow the Ema 20 for Sell. My recomendation, do not trade when price is between Ema 200 and Ema 14, you can loose money because is not define where it will go, and can reverse. The program will tell you when is the moment to look for a Buy or a Sell, meanwhile it will say "No Trade".
GOODIES OF THE THIS EXPERT ADVISOR, IS FOR FREE FOR ALL TRADING COMUNITY, WHY? Because I was helped for free by a comunity and I am giving my talents so you can grow on your trading dicipline. My technique is simple is just 4 steps:
1. Look for the tendency in the day and hourly timeframes.
2. Look for the action of the price.
3. Look for the volume.
4. The software do this for you find all the resistance and support, what we call internal liquidities.
5. Look which session you are in the Software is already programed to tell you if you are in the NY session, Asia session, Europe Session and USA session etc.
Many assets got affected by the time session market you are working on. Is totally free for all the traders community.
Here is the software so you can copy, paste and compile for MT5 PC's.
//+------------------------------------------------------------------+
//| SISTEMA SIMPLIFICADO PARA LATINOS |
//| by jvieranieves54@gmail.com |
//+------------------------------------------------------------------+
#property copyright "Para la Comunidad Latina"
#property link "Regalo para Traders Hispanos"
#property version "3.3"
#property indicator_chart_window
//=========================== CONFIGURACIÓN DE EMAS ============================
input int ema20Period = 20;
input int ema40Period = 40;
input int ema80Period = 80;
input int ema200Period = 200;
//=== COLORES PARA LAS EMAS ===
input color color_ema20 = clrDodgerBlue;
input color color_ema40 = clrGold;
input color color_ema80 = clrMagenta;
input color color_ema200 = clrGray;
//=== MOSTRAR NIVELES EN GRAFICO ===
input bool mostrar_max_min = true;
//=== VARIABLES VOLUMEN ===
input int volumen_lookback = 25; // Número de velas para análisis de volumen
//=== VARIABLES HORARIOS MERCADO ===
input string asia_open = "00:00"; // Apertura Asia
input string asia_close = "09:00"; // Cierre Asia
input string europe_open = "08:00"; // Apertura Europa
input string europe_close = "17:00"; // Cierre Europa
input string us_open = "14:30"; // Apertura NY
input string us_close = "21:00"; // Cierre NY
// Handlers para las EMAs
int ema20handler, ema40handler, ema80handler, ema200handler;
double ema20[], ema40[], ema80[], ema200[];
//+------------------------------------------------------------------+
//| Expert initialization function |
//+------------------------------------------------------------------+
int OnInit()
{
// Configurar arrays
ArraySetAsSeries(ema20, true);
ArraySetAsSeries(ema40, true);
ArraySetAsSeries(ema80, true);
ArraySetAsSeries(ema200, true);
// Crear handlers para las EMAs
ema20handler = iMA(_Symbol, _Period, ema20Period, 0, MODE_EMA, PRICE_CLOSE);
ema40handler = iMA(_Symbol, _Period, ema40Period, 0, MODE_EMA, PRICE_CLOSE);
ema80handler = iMA(_Symbol, _Period, ema80Period, 0, MODE_EMA, PRICE_CLOSE);
ema200handler = iMA(_Symbol, _Period, ema200Period, 0, MODE_EMA, PRICE_CLOSE);
// Limpiar objetos anteriores
ObjectsDeleteAll(0, -1, -1);
// Crear objetos una sola vez (evita flickering)
CrearObjetosGraficos();
return(INIT_SUCCEEDED);
}
//+------------------------------------------------------------------+
//| Crear objetos gráficos una sola vez |
//+------------------------------------------------------------------+
void CrearObjetosGraficos()
{
//=== OBJETOS DE SESIÓN Y SEÑAL ===
// Sesión actual
ObjectCreate(0, "SESION_ACTUAL", OBJ_LABEL, 0, 0, 0);
ObjectSetInteger(0, "SESION_ACTUAL", OBJPROP_CORNER, CORNER_RIGHT_UPPER);
ObjectSetInteger(0, "SESION_ACTUAL", OBJPROP_XDISTANCE, 200);
ObjectSetInteger(0, "SESION_ACTUAL", OBJPROP_YDISTANCE, 10);
ObjectSetInteger(0, "SESION_ACTUAL", OBJPROP_COLOR, clrWhite);
ObjectSetInteger(0, "SESION_ACTUAL", OBJPROP_FONTSIZE, 12);
ObjectSetInteger(0, "SESION_ACTUAL", OBJPROP_BACK, false);
// Señal actual
ObjectCreate(0, "SEÑAL_ACTUAL", OBJ_LABEL, 0, 0, 0);
ObjectSetInteger(0, "SEÑAL_ACTUAL", OBJPROP_CORNER, CORNER_RIGHT_UPPER);
ObjectSetInteger(0, "SEÑAL_ACTUAL", OBJPROP_XDISTANCE, 200);
ObjectSetInteger(0, "SEÑAL_ACTUAL", OBJPROP_YDISTANCE, 35);
ObjectSetInteger(0, "SEÑAL_ACTUAL", OBJPROP_FONTSIZE, 14);
ObjectSetInteger(0, "SEÑAL_ACTUAL", OBJPROP_BACK, false);
//=== VALORES DE EMAs ===
// EMA20
ObjectCreate(0, "EMA20_VALOR", OBJ_LABEL, 0, 0, 0);
ObjectSetInteger(0, "EMA20_VALOR", OBJPROP_CORNER, CORNER_RIGHT_UPPER);
ObjectSetInteger(0, "EMA20_VALOR", OBJPROP_XDISTANCE, 200);
ObjectSetInteger(0, "EMA20_VALOR", OBJPROP_YDISTANCE, 65);
ObjectSetInteger(0, "EMA20_VALOR", OBJPROP_COLOR, color_ema20);
ObjectSetInteger(0, "EMA20_VALOR", OBJPROP_BACK, false);
// EMA40
ObjectCreate(0, "EMA40_VALOR", OBJ_LABEL, 0, 0, 0);
ObjectSetInteger(0, "EMA40_VALOR", OBJPROP_CORNER, CORNER_RIGHT_UPPER);
ObjectSetInteger(0, "EMA40_VALOR", OBJPROP_XDISTANCE, 200);
ObjectSetInteger(0, "EMA40_VALOR", OBJPROP_YDISTANCE, 85);
ObjectSetInteger(0, "EMA40_VALOR", OBJPROP_COLOR, color_ema40);
ObjectSetInteger(0, "EMA40_VALOR", OBJPROP_BACK, false);
// EMA80
ObjectCreate(0, "EMA80_VALOR", OBJ_LABEL, 0, 0, 0);
ObjectSetInteger(0, "EMA80_VALOR", OBJPROP_CORNER, CORNER_RIGHT_UPPER);
ObjectSetInteger(0, "EMA80_VALOR", OBJPROP_XDISTANCE, 200);
ObjectSetInteger(0, "EMA80_VALOR", OBJPROP_YDISTANCE, 105);
ObjectSetInteger(0, "EMA80_VALOR", OBJPROP_COLOR, color_ema80);
ObjectSetInteger(0, "EMA80_VALOR", OBJPROP_BACK, false);
// EMA200
ObjectCreate(0, "EMA200_VALOR", OBJ_LABEL, 0, 0, 0);
ObjectSetInteger(0, "EMA200_VALOR", OBJPROP_CORNER, CORNER_RIGHT_UPPER);
ObjectSetInteger(0, "EMA200_VALOR", OBJPROP_XDISTANCE, 200);
ObjectSetInteger(0, "EMA200_VALOR", OBJPROP_YDISTANCE, 125);
ObjectSetInteger(0, "EMA200_VALOR", OBJPROP_COLOR, color_ema200);
ObjectSetInteger(0, "EMA200_VALOR", OBJPROP_BACK, false);
//=== INFORMACIÓN DE VOLUMEN ===
// Volumen actual
ObjectCreate(0, "VOLUMEN_ACTUAL", OBJ_LABEL, 0, 0, 0);
ObjectSetInteger(0, "VOLUMEN_ACTUAL", OBJPROP_CORNER, CORNER_RIGHT_UPPER);
ObjectSetInteger(0, "VOLUMEN_ACTUAL", OBJPROP_XDISTANCE, 200);
ObjectSetInteger(0, "VOLUMEN_ACTUAL", OBJPROP_YDISTANCE, 150);
ObjectSetInteger(0, "VOLUMEN_ACTUAL", OBJPROP_COLOR, clrCyan);
ObjectSetInteger(0, "VOLUMEN_ACTUAL", OBJPROP_FONTSIZE, 10);
ObjectSetInteger(0, "VOLUMEN_ACTUAL", OBJPROP_BACK, false);
// Volumen máximo
ObjectCreate(0, "VOLUMEN_MAX", OBJ_LABEL, 0, 0, 0);
ObjectSetInteger(0, "VOLUMEN_MAX", OBJPROP_CORNER, CORNER_RIGHT_UPPER);
ObjectSetInteger(0, "VOLUMEN_MAX", OBJPROP_XDISTANCE, 200);
ObjectSetInteger(0, "VOLUMEN_MAX", OBJPROP_YDISTANCE, 170);
ObjectSetInteger(0, "VOLUMEN_MAX", OBJPROP_COLOR, clrLime);
ObjectSetInteger(0, "VOLUMEN_MAX", OBJPROP_FONTSIZE, 10);
ObjectSetInteger(0, "VOLUMEN_MAX", OBJPROP_BACK, false);
// Volumen mínimo
ObjectCreate(0, "VOLUMEN_MIN", OBJ_LABEL, 0, 0, 0);
ObjectSetInteger(0, "VOLUMEN_MIN", OBJPROP_CORNER, CORNER_RIGHT_UPPER);
ObjectSetInteger(0, "VOLUMEN_MIN", OBJPROP_XDISTANCE, 200);
ObjectSetInteger(0, "VOLUMEN_MIN", OBJPROP_YDISTANCE, 190);
ObjectSetInteger(0, "VOLUMEN_MIN", OBJPROP_COLOR, clrRed);
ObjectSetInteger(0, "VOLUMEN_MIN", OBJPROP_FONTSIZE, 10);
ObjectSetInteger(0, "VOLUMEN_MIN", OBJPROP_BACK, false);
//=== LEYENDA DE LÍNEAS ===
// Título leyenda
ObjectCreate(0, "LEYENDA_TITULO", OBJ_LABEL, 0, 0, 0);
ObjectSetInteger(0, "LEYENDA_TITULO", OBJPROP_CORNER, CORNER_LEFT_LOWER);
ObjectSetInteger(0, "LEYENDA_TITULO", OBJPROP_XDISTANCE, 10);
ObjectSetInteger(0, "LEYENDA_TITULO", OBJPROP_YDISTANCE, 170);
ObjectSetInteger(0, "LEYENDA_TITULO", OBJPROP_COLOR, clrWhite);
ObjectSetInteger(0, "LEYENDA_TITULO", OBJPROP_FONTSIZE, 10);
ObjectSetInteger(0, "LEYENDA_TITULO", OBJPROP_BACK, false);
ObjectSetString(0, "LEYENDA_TITULO", OBJPROP_TEXT, "LÍNEAS: MÁX/MÍN POR TIMEFRAME");
}
//+------------------------------------------------------------------+
//| Función para calcular volúmenes |
//+------------------------------------------------------------------+
void CalculateVolumeLevels(long ¤tVol, long &maxVol, long &minVol, string &volumeSignal)
{
long volumes[];
ArraySetAsSeries(volumes, true);
// Copiar datos de tick volume
CopyTickVolume(_Symbol, _Period, 0, volumen_lookback, volumes);
// Inicializar con primer valor
currentVol = volumes[0];
maxVol = volumes[1];
minVol = volumes[1];
// Encontrar máximo y mínimo en el lookback
for(int i = 1; i < volumen_lookback; i++)
{
if(volumes[i] > maxVol) maxVol = volumes[i];
if(volumes[i] < minVol) minVol = volumes[i];
}
// Determinar señal de volumen
double avgVolume = (maxVol + minVol) / 2.0;
if(currentVol > avgVolume * 1.5)
volumeSignal = "ALTO VOLUMEN 📈 - CONFIRMA";
else if(currentVol < avgVolume * 0.5)
volumeSignal = "VOLUMEN BAJO 📉 - CUIDADO";
else if(currentVol > avgVolume)
volumeSignal = "VOLUMEN NORMAL ✅";
else
volumeSignal = "VOLUMEN BAJO ⚠️";
}
//+------------------------------------------------------------------+
//| Función para determinar sesión de mercado |
//+------------------------------------------------------------------+
string GetMarketSession()
{
MqlDateTime current_time;
TimeCurrent(current_time);
string current_hour_min = StringFormat("%02d:%02d", current_time.hour, current_time.min);
if(current_hour_min >= asia_open && current_hour_min < asia_close)
return "ASIA 🇯🇵";
else if(current_hour_min >= europe_open && current_hour_min < europe_close)
return "EUROPA 🇪🇺";
else if(current_hour_min >= us_open && current_hour_min < us_close)
return "NUEVA YORK 🇺🇸";
else
return "BAJA LIQUIDEZ";
}
//+------------------------------------------------------------------+
//| Función para dibujar niveles máximos y mínimos |
//+------------------------------------------------------------------+
void DibujarNivelesTimeframe(ENUM_TIMEFRAMES tf, color clr, int desplazamiento)
{
if(!mostrar_max_min) return;
string tf_name = TimeframeToString(tf);
string nombre = "MAX_" + tf_name;
int periodo = 100; // Últimas 100 velas
int indice_maximo = iHighest(_Symbol, tf, MODE_HIGH, periodo, 1);
int indice_minimo = iLowest(_Symbol, tf, MODE_LOW, periodo, 1);
double precio_maximo = iHigh(_Symbol, tf, indice_maximo);
double precio_minimo = iLow(_Symbol, tf, indice_minimo);
// Dibujar línea de máximo (solo si no existe)
if(ObjectFind(0, nombre + "_HIGH") < 0)
{
ObjectCreate(0, nombre + "_HIGH", OBJ_HLINE, 0, 0, precio_maximo);
ObjectSetInteger(0, nombre + "_HIGH", OBJPROP_COLOR, clr);
ObjectSetInteger(0, nombre + "_HIGH", OBJPROP_STYLE, STYLE_DASH);
ObjectSetInteger(0, nombre + "_HIGH", OBJPROP_WIDTH, 2);
ObjectSetInteger(0, nombre + "_HIGH", OBJPROP_BACK, true);
}
else
{
// Solo actualizar el precio si la línea ya existe
ObjectSetDouble(0, nombre + "_HIGH", OBJPROP_PRICE, precio_maximo);
}
// Dibujar línea de mínimo (solo si no existe)
if(ObjectFind(0, nombre + "_LOW") < 0)
{
ObjectCreate(0, nombre + "_LOW", OBJ_HLINE, 0, 0, precio_minimo);
ObjectSetInteger(0, nombre + "_LOW", OBJPROP_COLOR, clr);
ObjectSetInteger(0, nombre + "_LOW", OBJPROP_STYLE, STYLE_DASH);
ObjectSetInteger(0, nombre + "_LOW", OBJPROP_WIDTH, 2);
ObjectSetInteger(0, nombre + "_LOW", OBJPROP_BACK, true);
}
else
{
// Solo actualizar el precio si la línea ya existe
ObjectSetDouble(0, nombre + "_LOW", OBJPROP_PRICE, precio_minimo);
}
// Etiqueta para la leyenda (solo si no existe)
if(ObjectFind(0, nombre + "_LEYENDA") < 0)
{
ObjectCreate(0, nombre + "_LEYENDA", OBJ_LABEL, 0, 0, 0);
ObjectSetInteger(0, nombre + "_LEYENDA", OBJPROP_CORNER, CORNER_LEFT_LOWER);
ObjectSetInteger(0, nombre + "_LEYENDA", OBJPROP_XDISTANCE, 10);
ObjectSetInteger(0, nombre + "_LEYENDA", OBJPROP_YDISTANCE, 10 + desplazamiento * 20);
ObjectSetInteger(0, nombre + "_LEYENDA", OBJPROP_COLOR, clr);
ObjectSetInteger(0, nombre + "_LEYENDA", OBJPROP_FONTSIZE, 8);
ObjectSetInteger(0, nombre + "_LEYENDA", OBJPROP_BACK, false);
}
// Actualizar texto de la leyenda
ObjectSetString(0, nombre + "_LEYENDA", OBJPROP_TEXT, tf_name + " - M:" + DoubleToString(precio_maximo, _Digits) + " m:" + DoubleToString(precio_minimo, _Digits));
}
//+------------------------------------------------------------------+
//| Convertir timeframe a string |
//+------------------------------------------------------------------+
string TimeframeToString(ENUM_TIMEFRAMES tf)
{
switch(tf)
{
case PERIOD_M1: return "M1";
case PERIOD_M5: return "M5";
case PERIOD_M15: return "M15";
case PERIOD_M30: return "M30";
case PERIOD_H1: return "H1";
case PERIOD_H4: return "H4";
case PERIOD_D1: return "D1";
case PERIOD_W1: return "W1";
default: return "TF";
}
}
//+------------------------------------------------------------------+
//| Verificar estructura alcista perfecta |
//+------------------------------------------------------------------+
bool EstructuraAlcistaPerfecta()
{
double precio_actual = iClose(_Symbol, _Period, 0);
// Precio sobre EMA20 y EMAs alineadas correctamente
bool condicion1 = (precio_actual > ema20[0]);
bool condicion2 = (ema20[0] > ema40[0]);
bool condicion3 = (ema40[0] > ema80[0]);
bool condicion4 = (ema80[0] > ema200[0]);
return (condicion1 && condicion2 && condicion3 && condicion4);
}
//+------------------------------------------------------------------+
//| Verificar estructura bajista perfecta |
//+------------------------------------------------------------------+
bool EstructuraBajistaPerfecta()
{
double precio_actual = iClose(_Symbol, _Period, 0);
// Precio bajo EMA20 y EMAs alineadas correctamente
bool condicion1 = (precio_actual < ema20[0]);
bool condicion2 = (ema20[0] < ema40[0]);
bool condicion3 = (ema40[0] < ema80[0]);
bool condicion4 = (ema80[0] < ema200[0]);
return (condicion1 && condicion2 && condicion3 && condicion4);
}
//+------------------------------------------------------------------+
//| Expert tick function |
//+------------------------------------------------------------------+
void OnTick()
{
//================== COPIAR BUFFERS DE LAS EMAS ==================
CopyBuffer(ema20handler, 0, 0, 3, ema20);
CopyBuffer(ema40handler, 0, 0, 3, ema40);
CopyBuffer(ema80handler, 0, 0, 3, ema80);
CopyBuffer(ema200handler, 0, 0, 3, ema200);
//================ CALCULAR VOLUMEN ==============================
long currentVolume, maxVolume, minVolume;
string volumeSignal;
CalculateVolumeLevels(currentVolume, maxVolume, minVolume, volumeSignal);
//================ DETERMINAR SESIÓN ACTUAL =====================
string sesion_actual = GetMarketSession();
//================ DIBUJAR NIVELES EN TIMEFRAMES ================
if(mostrar_max_min)
{
DibujarNivelesTimeframe(PERIOD_M1, clrLightGray, 0);
DibujarNivelesTimeframe(PERIOD_M5, clrLightBlue, 1);
DibujarNivelesTimeframe(PERIOD_M15, clrYellow, 2);
DibujarNivelesTimeframe(PERIOD_M30, clrOrange, 3);
DibujarNivelesTimeframe(PERIOD_H1, clrGreen, 4);
DibujarNivelesTimeframe(PERIOD_H4, clrBlue, 5);
DibujarNivelesTimeframe(PERIOD_D1, clrPurple, 6);
DibujarNivelesTimeframe(PERIOD_W1, clrRed, 7);
}
//=================== VERIFICAR ESTRUCTURAS =====================
bool alcista_perfecta = EstructuraAlcistaPerfecta();
bool bajista_perfecta = EstructuraBajistaPerfecta();
string señal = "NO TRADE ⏸️";
color color_señal = clrGray;
if(alcista_perfecta)
{
señal = "COMPRA ✅🚀";
color_señal = clrLime;
}
else if(bajista_perfecta)
{
señal = "VENDER ❌";
color_señal = clrRed;
}
//=================== ACTUALIZAR OBJETOS (SIN FLICKERING) =======
// Actualizar sesión
ObjectSetString(0, "SESION_ACTUAL", OBJPROP_TEXT, "SESIÓN: " + sesion_actual);
// Actualizar señal
ObjectSetString(0, "SEÑAL_ACTUAL", OBJPROP_TEXT, "SEÑAL: " + señal);
ObjectSetInteger(0, "SEÑAL_ACTUAL", OBJPROP_COLOR, color_señal);
// Actualizar valores EMAs
ObjectSetString(0, "EMA20_VALOR", OBJPROP_TEXT, "EMA20: " + DoubleToString(ema20[0], _Digits));
ObjectSetString(0, "EMA40_VALOR", OBJPROP_TEXT, "EMA40: " + DoubleToString(ema40[0], _Digits));
ObjectSetString(0, "EMA80_VALOR", OBJPROP_TEXT, "EMA80: " + DoubleToString(ema80[0], _Digits));
ObjectSetString(0, "EMA200_VALOR", OBJPROP_TEXT, "EMA200: " + DoubleToString(ema200[0], _Digits));
// Actualizar información de volumen
ObjectSetString(0, "VOLUMEN_ACTUAL", OBJPROP_TEXT, "VOL ACT: " + IntegerToString(currentVolume) + " - " + volumeSignal);
ObjectSetString(0, "VOLUMEN_MAX", OBJPROP_TEXT, "VOL MAX: " + IntegerToString(maxVolume) + " (Últ " + IntegerToString(volumen_lookback) + " vela" + (volumen_lookback > 1 ? "s" : "") + ")");
ObjectSetString(0, "VOLUMEN_MIN", OBJPROP_TEXT, "VOL MIN: " + IntegerToString(minVolume));
//=================== MOSTRAR INFORMACIÓN EN COMENTARIOS ========
string comentario = "🎯 SISTEMA SIMPLIFICADO - COMUNIDAD LATINA\n" +
"========================================\n" +
"🌍 SESIÓN: " + sesion_actual + "\n" +
"📊 CONDICIÓN ACTUAL:\n" +
"Precio > EMA20: " + (iClose(_Symbol, _Period, 0) > ema20[0] ? "✅" : "❌") + "\n" +
"EMA20 > EMA40: " + (ema20[0] > ema40[0] ? "✅" : "❌") + "\n" +
"EMA40 > EMA80: " + (ema40[0] > ema80[0] ? "✅" : "❌") + "\n" +
"EMA80 > EMA200: " + (ema80[0] > ema200[0] ? "✅" : "❌") + "\n" +
"========================================\n" +
"📈 ANÁLISIS DE VOLUMEN:\n" +
"Volumen Actual: " + IntegerToString(currentVolume) + " - " + volumeSignal + "\n" +
"Máximo Volumen: " + IntegerToString(maxVolume) + "\n" +
"Mínimo Volumen: " + IntegerToString(minVolume) + "\n" +
"========================================\n" +
"🎯 SEÑAL: " + señal + "\n" +
"========================================\n" +
"💡 ESTRATEGIA:\n" +
"• COMPRA: Precio sobre EMA20 + EMAs alineadas + Volumen alto\n" +
"• VENDER: Precio bajo EMA20 + EMAs alineadas + Volumen alto\n" +
"• NO TRADE: Volumen bajo o condiciones mixtas";
Comment(comentario);
}
//+------------------------------------------------------------------+
//| Expert deinitialization function |
//+------------------------------------------------------------------+
void OnDeinit(const int reason)
{
// Limpiar objetos al quitar el indicador
ObjectsDeleteAll(0, -1, -1);
Comment(""); // Limpiar comentario
}
When there is no conditions to trade it will tell you clearly "NO TRADE", for buying it will say "COMPRAS", and for sell it will say "VENDER', this is in mql5 so maybe it will not work on MT4 pcs ony MT5 pcs, it will not work in Smartphones.
The instructions to Install are easy:
1. Open MT5
2. Press "F4" key, then create new give the name "EA-MARKET-SESSIONS-MULTI-TF-LIQUIDITY.mq5"
3. Copy and Paste the Program Bellow and Compile the file.
This software will identify the External Liquidities, and the internal Liquidities hidden in the maximum and minimum prices of all timeframes, the program will check that all the conditions are ok to invest meaning the ema 20, 40, 80,200 is a strong structure of a bullish market, and when the emas goes 200,80,40,20 is a very strong structure of a bearish market. On bullish market the structure of emas have to be present with the action of the price above the ema 20, in a bearish market the structure of the Emas have to be presenta and the action of the price bellow the Ema 20 for Sell. My recomendation, do not trade when price is between Ema 200 and Ema 14, you can loose money because is not define where it will go, and can reverse. The program will tell you when is the moment to look for a Buy or a Sell, meanwhile it will say "No Trade".
GOODIES OF THE THIS EXPERT ADVISOR, IS FOR FREE FOR ALL TRADING COMUNITY, WHY? Because I was helped for free by a comunity and I am giving my talents so you can grow on your trading dicipline. My technique is simple is just 4 steps:
1. Look for the tendency in the day and hourly timeframes.
2. Look for the action of the price.
3. Look for the volume.
4. The software do this for you find all the resistance and support, what we call internal liquidities.
5. Look which session you are in the Software is already programed to tell you if you are in the NY session, Asia session, Europe Session and USA session etc.
Many assets got affected by the time session market you are working on. Is totally free for all the traders community.
Here is the software so you can copy, paste and compile for MT5 PC's.
//+------------------------------------------------------------------+
//| SISTEMA SIMPLIFICADO PARA LATINOS |
//| by jvieranieves54@gmail.com |
//+------------------------------------------------------------------+
#property copyright "Para la Comunidad Latina"
#property link "Regalo para Traders Hispanos"
#property version "3.3"
#property indicator_chart_window
//=========================== CONFIGURACIÓN DE EMAS ============================
input int ema20Period = 20;
input int ema40Period = 40;
input int ema80Period = 80;
input int ema200Period = 200;
//=== COLORES PARA LAS EMAS ===
input color color_ema20 = clrDodgerBlue;
input color color_ema40 = clrGold;
input color color_ema80 = clrMagenta;
input color color_ema200 = clrGray;
//=== MOSTRAR NIVELES EN GRAFICO ===
input bool mostrar_max_min = true;
//=== VARIABLES VOLUMEN ===
input int volumen_lookback = 25; // Número de velas para análisis de volumen
//=== VARIABLES HORARIOS MERCADO ===
input string asia_open = "00:00"; // Apertura Asia
input string asia_close = "09:00"; // Cierre Asia
input string europe_open = "08:00"; // Apertura Europa
input string europe_close = "17:00"; // Cierre Europa
input string us_open = "14:30"; // Apertura NY
input string us_close = "21:00"; // Cierre NY
// Handlers para las EMAs
int ema20handler, ema40handler, ema80handler, ema200handler;
double ema20[], ema40[], ema80[], ema200[];
//+------------------------------------------------------------------+
//| Expert initialization function |
//+------------------------------------------------------------------+
int OnInit()
{
// Configurar arrays
ArraySetAsSeries(ema20, true);
ArraySetAsSeries(ema40, true);
ArraySetAsSeries(ema80, true);
ArraySetAsSeries(ema200, true);
// Crear handlers para las EMAs
ema20handler = iMA(_Symbol, _Period, ema20Period, 0, MODE_EMA, PRICE_CLOSE);
ema40handler = iMA(_Symbol, _Period, ema40Period, 0, MODE_EMA, PRICE_CLOSE);
ema80handler = iMA(_Symbol, _Period, ema80Period, 0, MODE_EMA, PRICE_CLOSE);
ema200handler = iMA(_Symbol, _Period, ema200Period, 0, MODE_EMA, PRICE_CLOSE);
// Limpiar objetos anteriores
ObjectsDeleteAll(0, -1, -1);
// Crear objetos una sola vez (evita flickering)
CrearObjetosGraficos();
return(INIT_SUCCEEDED);
}
//+------------------------------------------------------------------+
//| Crear objetos gráficos una sola vez |
//+------------------------------------------------------------------+
void CrearObjetosGraficos()
{
//=== OBJETOS DE SESIÓN Y SEÑAL ===
// Sesión actual
ObjectCreate(0, "SESION_ACTUAL", OBJ_LABEL, 0, 0, 0);
ObjectSetInteger(0, "SESION_ACTUAL", OBJPROP_CORNER, CORNER_RIGHT_UPPER);
ObjectSetInteger(0, "SESION_ACTUAL", OBJPROP_XDISTANCE, 200);
ObjectSetInteger(0, "SESION_ACTUAL", OBJPROP_YDISTANCE, 10);
ObjectSetInteger(0, "SESION_ACTUAL", OBJPROP_COLOR, clrWhite);
ObjectSetInteger(0, "SESION_ACTUAL", OBJPROP_FONTSIZE, 12);
ObjectSetInteger(0, "SESION_ACTUAL", OBJPROP_BACK, false);
// Señal actual
ObjectCreate(0, "SEÑAL_ACTUAL", OBJ_LABEL, 0, 0, 0);
ObjectSetInteger(0, "SEÑAL_ACTUAL", OBJPROP_CORNER, CORNER_RIGHT_UPPER);
ObjectSetInteger(0, "SEÑAL_ACTUAL", OBJPROP_XDISTANCE, 200);
ObjectSetInteger(0, "SEÑAL_ACTUAL", OBJPROP_YDISTANCE, 35);
ObjectSetInteger(0, "SEÑAL_ACTUAL", OBJPROP_FONTSIZE, 14);
ObjectSetInteger(0, "SEÑAL_ACTUAL", OBJPROP_BACK, false);
//=== VALORES DE EMAs ===
// EMA20
ObjectCreate(0, "EMA20_VALOR", OBJ_LABEL, 0, 0, 0);
ObjectSetInteger(0, "EMA20_VALOR", OBJPROP_CORNER, CORNER_RIGHT_UPPER);
ObjectSetInteger(0, "EMA20_VALOR", OBJPROP_XDISTANCE, 200);
ObjectSetInteger(0, "EMA20_VALOR", OBJPROP_YDISTANCE, 65);
ObjectSetInteger(0, "EMA20_VALOR", OBJPROP_COLOR, color_ema20);
ObjectSetInteger(0, "EMA20_VALOR", OBJPROP_BACK, false);
// EMA40
ObjectCreate(0, "EMA40_VALOR", OBJ_LABEL, 0, 0, 0);
ObjectSetInteger(0, "EMA40_VALOR", OBJPROP_CORNER, CORNER_RIGHT_UPPER);
ObjectSetInteger(0, "EMA40_VALOR", OBJPROP_XDISTANCE, 200);
ObjectSetInteger(0, "EMA40_VALOR", OBJPROP_YDISTANCE, 85);
ObjectSetInteger(0, "EMA40_VALOR", OBJPROP_COLOR, color_ema40);
ObjectSetInteger(0, "EMA40_VALOR", OBJPROP_BACK, false);
// EMA80
ObjectCreate(0, "EMA80_VALOR", OBJ_LABEL, 0, 0, 0);
ObjectSetInteger(0, "EMA80_VALOR", OBJPROP_CORNER, CORNER_RIGHT_UPPER);
ObjectSetInteger(0, "EMA80_VALOR", OBJPROP_XDISTANCE, 200);
ObjectSetInteger(0, "EMA80_VALOR", OBJPROP_YDISTANCE, 105);
ObjectSetInteger(0, "EMA80_VALOR", OBJPROP_COLOR, color_ema80);
ObjectSetInteger(0, "EMA80_VALOR", OBJPROP_BACK, false);
// EMA200
ObjectCreate(0, "EMA200_VALOR", OBJ_LABEL, 0, 0, 0);
ObjectSetInteger(0, "EMA200_VALOR", OBJPROP_CORNER, CORNER_RIGHT_UPPER);
ObjectSetInteger(0, "EMA200_VALOR", OBJPROP_XDISTANCE, 200);
ObjectSetInteger(0, "EMA200_VALOR", OBJPROP_YDISTANCE, 125);
ObjectSetInteger(0, "EMA200_VALOR", OBJPROP_COLOR, color_ema200);
ObjectSetInteger(0, "EMA200_VALOR", OBJPROP_BACK, false);
//=== INFORMACIÓN DE VOLUMEN ===
// Volumen actual
ObjectCreate(0, "VOLUMEN_ACTUAL", OBJ_LABEL, 0, 0, 0);
ObjectSetInteger(0, "VOLUMEN_ACTUAL", OBJPROP_CORNER, CORNER_RIGHT_UPPER);
ObjectSetInteger(0, "VOLUMEN_ACTUAL", OBJPROP_XDISTANCE, 200);
ObjectSetInteger(0, "VOLUMEN_ACTUAL", OBJPROP_YDISTANCE, 150);
ObjectSetInteger(0, "VOLUMEN_ACTUAL", OBJPROP_COLOR, clrCyan);
ObjectSetInteger(0, "VOLUMEN_ACTUAL", OBJPROP_FONTSIZE, 10);
ObjectSetInteger(0, "VOLUMEN_ACTUAL", OBJPROP_BACK, false);
// Volumen máximo
ObjectCreate(0, "VOLUMEN_MAX", OBJ_LABEL, 0, 0, 0);
ObjectSetInteger(0, "VOLUMEN_MAX", OBJPROP_CORNER, CORNER_RIGHT_UPPER);
ObjectSetInteger(0, "VOLUMEN_MAX", OBJPROP_XDISTANCE, 200);
ObjectSetInteger(0, "VOLUMEN_MAX", OBJPROP_YDISTANCE, 170);
ObjectSetInteger(0, "VOLUMEN_MAX", OBJPROP_COLOR, clrLime);
ObjectSetInteger(0, "VOLUMEN_MAX", OBJPROP_FONTSIZE, 10);
ObjectSetInteger(0, "VOLUMEN_MAX", OBJPROP_BACK, false);
// Volumen mínimo
ObjectCreate(0, "VOLUMEN_MIN", OBJ_LABEL, 0, 0, 0);
ObjectSetInteger(0, "VOLUMEN_MIN", OBJPROP_CORNER, CORNER_RIGHT_UPPER);
ObjectSetInteger(0, "VOLUMEN_MIN", OBJPROP_XDISTANCE, 200);
ObjectSetInteger(0, "VOLUMEN_MIN", OBJPROP_YDISTANCE, 190);
ObjectSetInteger(0, "VOLUMEN_MIN", OBJPROP_COLOR, clrRed);
ObjectSetInteger(0, "VOLUMEN_MIN", OBJPROP_FONTSIZE, 10);
ObjectSetInteger(0, "VOLUMEN_MIN", OBJPROP_BACK, false);
//=== LEYENDA DE LÍNEAS ===
// Título leyenda
ObjectCreate(0, "LEYENDA_TITULO", OBJ_LABEL, 0, 0, 0);
ObjectSetInteger(0, "LEYENDA_TITULO", OBJPROP_CORNER, CORNER_LEFT_LOWER);
ObjectSetInteger(0, "LEYENDA_TITULO", OBJPROP_XDISTANCE, 10);
ObjectSetInteger(0, "LEYENDA_TITULO", OBJPROP_YDISTANCE, 170);
ObjectSetInteger(0, "LEYENDA_TITULO", OBJPROP_COLOR, clrWhite);
ObjectSetInteger(0, "LEYENDA_TITULO", OBJPROP_FONTSIZE, 10);
ObjectSetInteger(0, "LEYENDA_TITULO", OBJPROP_BACK, false);
ObjectSetString(0, "LEYENDA_TITULO", OBJPROP_TEXT, "LÍNEAS: MÁX/MÍN POR TIMEFRAME");
}
//+------------------------------------------------------------------+
//| Función para calcular volúmenes |
//+------------------------------------------------------------------+
void CalculateVolumeLevels(long ¤tVol, long &maxVol, long &minVol, string &volumeSignal)
{
long volumes[];
ArraySetAsSeries(volumes, true);
// Copiar datos de tick volume
CopyTickVolume(_Symbol, _Period, 0, volumen_lookback, volumes);
// Inicializar con primer valor
currentVol = volumes[0];
maxVol = volumes[1];
minVol = volumes[1];
// Encontrar máximo y mínimo en el lookback
for(int i = 1; i < volumen_lookback; i++)
{
if(volumes[i] > maxVol) maxVol = volumes[i];
if(volumes[i] < minVol) minVol = volumes[i];
}
// Determinar señal de volumen
double avgVolume = (maxVol + minVol) / 2.0;
if(currentVol > avgVolume * 1.5)
volumeSignal = "ALTO VOLUMEN 📈 - CONFIRMA";
else if(currentVol < avgVolume * 0.5)
volumeSignal = "VOLUMEN BAJO 📉 - CUIDADO";
else if(currentVol > avgVolume)
volumeSignal = "VOLUMEN NORMAL ✅";
else
volumeSignal = "VOLUMEN BAJO ⚠️";
}
//+------------------------------------------------------------------+
//| Función para determinar sesión de mercado |
//+------------------------------------------------------------------+
string GetMarketSession()
{
MqlDateTime current_time;
TimeCurrent(current_time);
string current_hour_min = StringFormat("%02d:%02d", current_time.hour, current_time.min);
if(current_hour_min >= asia_open && current_hour_min < asia_close)
return "ASIA 🇯🇵";
else if(current_hour_min >= europe_open && current_hour_min < europe_close)
return "EUROPA 🇪🇺";
else if(current_hour_min >= us_open && current_hour_min < us_close)
return "NUEVA YORK 🇺🇸";
else
return "BAJA LIQUIDEZ";
}
//+------------------------------------------------------------------+
//| Función para dibujar niveles máximos y mínimos |
//+------------------------------------------------------------------+
void DibujarNivelesTimeframe(ENUM_TIMEFRAMES tf, color clr, int desplazamiento)
{
if(!mostrar_max_min) return;
string tf_name = TimeframeToString(tf);
string nombre = "MAX_" + tf_name;
int periodo = 100; // Últimas 100 velas
int indice_maximo = iHighest(_Symbol, tf, MODE_HIGH, periodo, 1);
int indice_minimo = iLowest(_Symbol, tf, MODE_LOW, periodo, 1);
double precio_maximo = iHigh(_Symbol, tf, indice_maximo);
double precio_minimo = iLow(_Symbol, tf, indice_minimo);
// Dibujar línea de máximo (solo si no existe)
if(ObjectFind(0, nombre + "_HIGH") < 0)
{
ObjectCreate(0, nombre + "_HIGH", OBJ_HLINE, 0, 0, precio_maximo);
ObjectSetInteger(0, nombre + "_HIGH", OBJPROP_COLOR, clr);
ObjectSetInteger(0, nombre + "_HIGH", OBJPROP_STYLE, STYLE_DASH);
ObjectSetInteger(0, nombre + "_HIGH", OBJPROP_WIDTH, 2);
ObjectSetInteger(0, nombre + "_HIGH", OBJPROP_BACK, true);
}
else
{
// Solo actualizar el precio si la línea ya existe
ObjectSetDouble(0, nombre + "_HIGH", OBJPROP_PRICE, precio_maximo);
}
// Dibujar línea de mínimo (solo si no existe)
if(ObjectFind(0, nombre + "_LOW") < 0)
{
ObjectCreate(0, nombre + "_LOW", OBJ_HLINE, 0, 0, precio_minimo);
ObjectSetInteger(0, nombre + "_LOW", OBJPROP_COLOR, clr);
ObjectSetInteger(0, nombre + "_LOW", OBJPROP_STYLE, STYLE_DASH);
ObjectSetInteger(0, nombre + "_LOW", OBJPROP_WIDTH, 2);
ObjectSetInteger(0, nombre + "_LOW", OBJPROP_BACK, true);
}
else
{
// Solo actualizar el precio si la línea ya existe
ObjectSetDouble(0, nombre + "_LOW", OBJPROP_PRICE, precio_minimo);
}
// Etiqueta para la leyenda (solo si no existe)
if(ObjectFind(0, nombre + "_LEYENDA") < 0)
{
ObjectCreate(0, nombre + "_LEYENDA", OBJ_LABEL, 0, 0, 0);
ObjectSetInteger(0, nombre + "_LEYENDA", OBJPROP_CORNER, CORNER_LEFT_LOWER);
ObjectSetInteger(0, nombre + "_LEYENDA", OBJPROP_XDISTANCE, 10);
ObjectSetInteger(0, nombre + "_LEYENDA", OBJPROP_YDISTANCE, 10 + desplazamiento * 20);
ObjectSetInteger(0, nombre + "_LEYENDA", OBJPROP_COLOR, clr);
ObjectSetInteger(0, nombre + "_LEYENDA", OBJPROP_FONTSIZE, 8);
ObjectSetInteger(0, nombre + "_LEYENDA", OBJPROP_BACK, false);
}
// Actualizar texto de la leyenda
ObjectSetString(0, nombre + "_LEYENDA", OBJPROP_TEXT, tf_name + " - M:" + DoubleToString(precio_maximo, _Digits) + " m:" + DoubleToString(precio_minimo, _Digits));
}
//+------------------------------------------------------------------+
//| Convertir timeframe a string |
//+------------------------------------------------------------------+
string TimeframeToString(ENUM_TIMEFRAMES tf)
{
switch(tf)
{
case PERIOD_M1: return "M1";
case PERIOD_M5: return "M5";
case PERIOD_M15: return "M15";
case PERIOD_M30: return "M30";
case PERIOD_H1: return "H1";
case PERIOD_H4: return "H4";
case PERIOD_D1: return "D1";
case PERIOD_W1: return "W1";
default: return "TF";
}
}
//+------------------------------------------------------------------+
//| Verificar estructura alcista perfecta |
//+------------------------------------------------------------------+
bool EstructuraAlcistaPerfecta()
{
double precio_actual = iClose(_Symbol, _Period, 0);
// Precio sobre EMA20 y EMAs alineadas correctamente
bool condicion1 = (precio_actual > ema20[0]);
bool condicion2 = (ema20[0] > ema40[0]);
bool condicion3 = (ema40[0] > ema80[0]);
bool condicion4 = (ema80[0] > ema200[0]);
return (condicion1 && condicion2 && condicion3 && condicion4);
}
//+------------------------------------------------------------------+
//| Verificar estructura bajista perfecta |
//+------------------------------------------------------------------+
bool EstructuraBajistaPerfecta()
{
double precio_actual = iClose(_Symbol, _Period, 0);
// Precio bajo EMA20 y EMAs alineadas correctamente
bool condicion1 = (precio_actual < ema20[0]);
bool condicion2 = (ema20[0] < ema40[0]);
bool condicion3 = (ema40[0] < ema80[0]);
bool condicion4 = (ema80[0] < ema200[0]);
return (condicion1 && condicion2 && condicion3 && condicion4);
}
//+------------------------------------------------------------------+
//| Expert tick function |
//+------------------------------------------------------------------+
void OnTick()
{
//================== COPIAR BUFFERS DE LAS EMAS ==================
CopyBuffer(ema20handler, 0, 0, 3, ema20);
CopyBuffer(ema40handler, 0, 0, 3, ema40);
CopyBuffer(ema80handler, 0, 0, 3, ema80);
CopyBuffer(ema200handler, 0, 0, 3, ema200);
//================ CALCULAR VOLUMEN ==============================
long currentVolume, maxVolume, minVolume;
string volumeSignal;
CalculateVolumeLevels(currentVolume, maxVolume, minVolume, volumeSignal);
//================ DETERMINAR SESIÓN ACTUAL =====================
string sesion_actual = GetMarketSession();
//================ DIBUJAR NIVELES EN TIMEFRAMES ================
if(mostrar_max_min)
{
DibujarNivelesTimeframe(PERIOD_M1, clrLightGray, 0);
DibujarNivelesTimeframe(PERIOD_M5, clrLightBlue, 1);
DibujarNivelesTimeframe(PERIOD_M15, clrYellow, 2);
DibujarNivelesTimeframe(PERIOD_M30, clrOrange, 3);
DibujarNivelesTimeframe(PERIOD_H1, clrGreen, 4);
DibujarNivelesTimeframe(PERIOD_H4, clrBlue, 5);
DibujarNivelesTimeframe(PERIOD_D1, clrPurple, 6);
DibujarNivelesTimeframe(PERIOD_W1, clrRed, 7);
}
//=================== VERIFICAR ESTRUCTURAS =====================
bool alcista_perfecta = EstructuraAlcistaPerfecta();
bool bajista_perfecta = EstructuraBajistaPerfecta();
string señal = "NO TRADE ⏸️";
color color_señal = clrGray;
if(alcista_perfecta)
{
señal = "COMPRA ✅🚀";
color_señal = clrLime;
}
else if(bajista_perfecta)
{
señal = "VENDER ❌";
color_señal = clrRed;
}
//=================== ACTUALIZAR OBJETOS (SIN FLICKERING) =======
// Actualizar sesión
ObjectSetString(0, "SESION_ACTUAL", OBJPROP_TEXT, "SESIÓN: " + sesion_actual);
// Actualizar señal
ObjectSetString(0, "SEÑAL_ACTUAL", OBJPROP_TEXT, "SEÑAL: " + señal);
ObjectSetInteger(0, "SEÑAL_ACTUAL", OBJPROP_COLOR, color_señal);
// Actualizar valores EMAs
ObjectSetString(0, "EMA20_VALOR", OBJPROP_TEXT, "EMA20: " + DoubleToString(ema20[0], _Digits));
ObjectSetString(0, "EMA40_VALOR", OBJPROP_TEXT, "EMA40: " + DoubleToString(ema40[0], _Digits));
ObjectSetString(0, "EMA80_VALOR", OBJPROP_TEXT, "EMA80: " + DoubleToString(ema80[0], _Digits));
ObjectSetString(0, "EMA200_VALOR", OBJPROP_TEXT, "EMA200: " + DoubleToString(ema200[0], _Digits));
// Actualizar información de volumen
ObjectSetString(0, "VOLUMEN_ACTUAL", OBJPROP_TEXT, "VOL ACT: " + IntegerToString(currentVolume) + " - " + volumeSignal);
ObjectSetString(0, "VOLUMEN_MAX", OBJPROP_TEXT, "VOL MAX: " + IntegerToString(maxVolume) + " (Últ " + IntegerToString(volumen_lookback) + " vela" + (volumen_lookback > 1 ? "s" : "") + ")");
ObjectSetString(0, "VOLUMEN_MIN", OBJPROP_TEXT, "VOL MIN: " + IntegerToString(minVolume));
//=================== MOSTRAR INFORMACIÓN EN COMENTARIOS ========
string comentario = "🎯 SISTEMA SIMPLIFICADO - COMUNIDAD LATINA\n" +
"========================================\n" +
"🌍 SESIÓN: " + sesion_actual + "\n" +
"📊 CONDICIÓN ACTUAL:\n" +
"Precio > EMA20: " + (iClose(_Symbol, _Period, 0) > ema20[0] ? "✅" : "❌") + "\n" +
"EMA20 > EMA40: " + (ema20[0] > ema40[0] ? "✅" : "❌") + "\n" +
"EMA40 > EMA80: " + (ema40[0] > ema80[0] ? "✅" : "❌") + "\n" +
"EMA80 > EMA200: " + (ema80[0] > ema200[0] ? "✅" : "❌") + "\n" +
"========================================\n" +
"📈 ANÁLISIS DE VOLUMEN:\n" +
"Volumen Actual: " + IntegerToString(currentVolume) + " - " + volumeSignal + "\n" +
"Máximo Volumen: " + IntegerToString(maxVolume) + "\n" +
"Mínimo Volumen: " + IntegerToString(minVolume) + "\n" +
"========================================\n" +
"🎯 SEÑAL: " + señal + "\n" +
"========================================\n" +
"💡 ESTRATEGIA:\n" +
"• COMPRA: Precio sobre EMA20 + EMAs alineadas + Volumen alto\n" +
"• VENDER: Precio bajo EMA20 + EMAs alineadas + Volumen alto\n" +
"• NO TRADE: Volumen bajo o condiciones mixtas";
Comment(comentario);
}
//+------------------------------------------------------------------+
//| Expert deinitialization function |
//+------------------------------------------------------------------+
void OnDeinit(const int reason)
{
// Limpiar objetos al quitar el indicador
ObjectsDeleteAll(0, -1, -1);
Comment(""); // Limpiar comentario
}
Julio Viera
This is the English Version of the Expert Advisor Bellow will give you signals when the market is really strong, do not perform trade if it says "NO TRADE!!" , if you do it you are on your own risk.
📈 EA MANUAL - TRADING SIGNALS SYSTEM
"Training Wheels" for Safe and Educational Trading
⚠️ CURRENT MARKET ANALYSIS
Status: LOW VOLATILITY - NO CLEAR DIRECTION
Condition: Typical low-volume session - Wait for better opportunities
Advice: PATIENCE - "NO TRADE" is a valid signal
🎯 SYSTEM OVERVIEW
WHAT IS THIS EA?
Educational system designed as "training wheels" for automated trading, providing clear signals while protecting capital.
SYSTEM PHILOSOPHY
✅ Safe Learning: Operates with proven technical criteria
✅ Capital Protection: Filtered signals to minimize risks
✅ Continuous Education: Every signal is a learning opportunity
KEY FEATURES
🎯 Trend Analysis
Identifies market direction using EMAs
📊 Market Structure
Analyzes highs/lows for overall context
🔍 Volume Analysis
Includes current vs historical volume for confirmation
⚡ Clear Signals
Indicates exactly WHAT TO DO at every moment
🔧 INSTALLATION & SETUP
SYSTEM REQUIREMENTS
📱 Platform: MetaTrader 5
💱 Trading Pair: Any pair (recommended: EURUSD, XAUUSD)
⏰ Timeframe: Any timeframe (optimal: H1, H4)
🏢 Broker: Any broker with MT5
INSTALLATION STEPS
Download EA: `.mq5` file
Copy to Platform:
Open MetaTrader 5
Go to: `File → Open Data Folder`
Navigate to: `MQL5/Experts/`
Paste EA file
Compile:
In MT5, go to `View → Navigator`
Find EA, right click → `Compile`
Activate on Chart:
Drag EA from Navigator to chart
Configure parameters (optional)
Click OK
PARAMETER CONFIGURATION
Parameter Default Value Description
emafastPeriod 14 Fast EMA period for immediate trend
ema200Period 200 Slow EMA period for main trend
periodo_busqueda 100 Bars to analyze for highs/lows
volumen_lookback 25 Bars for historical volume analysis
📊 TRADING SIGNALS
INFORMATION PANEL INTERPRETATION
1. MAXIMUM & MINIMUM PRICES
Example: Maximum Price: 1.08540 | Minimum Price: 1.07820
Interpretation: Trading range of last 100 bars
2. BULLISH EMA STRUCTURE
BULLISH MARKET STRUCTURE EMAS
→ EMA 14 > EMA 200 → Bullish market
3. BEARISH EMA STRUCTURE
BEARISH MARKET STRUCTURE EMAS
→ EMA 14 < EMA 200 → Bearish market
4. VOLUME ANALYSIS
VOLUME ANALYSIS (Last 25 bars):
Current Volume: 15240 | Max Volume: 28500 | Min Volume: 8200
Interpretation:
High volume → Greater conviction in direction
Low volume → Possible trend change
Compare current vs historical for context
5. BUY SIGNAL
BUY!!! - Enter long when all conditions align
6. SELL SIGNAL
SELL!! - Enter short when all conditions align
7. DO NOT TRADE
NO TRADE!!! - Wait, conditions not optimal
ENTRY RULES
✅ CONDITIONS FOR BUY:
Bullish Structure: EMA 14 > EMA 200
Bullish Cross: EMA 14 crosses above EMA 200
Price Supported: Price > EMA 14
Volume Confirmation: Current volume preferably high
✅ CONDITIONS FOR SELL:
Bearish Structure: EMA 14 < EMA 200
Bearish Cross: EMA 14 crosses below EMA 200
Price Resisted: Price < EMA 14
Volume Confirmation: Current volume preferably high
🚫 DO NOT TRADE WHEN:
Shows "NO TRADE!!!"
Sideways market (EMAs very close)
Very low volume (lack of conviction)
Contradictory signals between indicators
🛡️ RISK MANAGEMENT
FOR BEGINNER TRADERS
💰 1%-2% Rule
Never risk more than 1-2% of capital per trade
🎯 Risk/Reward 1:1.5
Aim to take more profit than risk assumed
⏰ Market Hours
Trade during main sessions (London/NY) for better volume
PROTECTION TIPS
Mandatory Stop Loss: Always use protection
Reasonable Take Profit: Based on support/resistance
Avoid News: Don't trade during major economic announcements
Daily Review: Analyze trades every day
TRADE EXAMPLE
📈 BUY TRADE EXAMPLE
Signal: "BUY!!!" on panel + bullish structure
Entry: Current price (eg: 1.08200)
Stop Loss: 50 pips (1.07700) - below EMA 200
Take Profit: 75 pips (1.08950) - toward recent high
Risk/Reward: 1:1.5 ✓
❓ FREQUENTLY ASKED QUESTIONS
Does the EA execute trades automatically?
No, this EA is signal-only. It shows what to do but the trader must execute trades manually.
Which timeframes work best?
H1 and H4 are most stable. Lower timeframes (M1-M15) may generate many false signals.
Do I need previous knowledge?
No, it's designed for beginners. However, I recommend learning basic trading concepts.
What to do when it says "NO TRADE!!!"?
WAIT. This is the most important signal. It means conditions are not optimal and it's better not to trade.
How to interpret volume analysis?
Compare current volume with historical:
Current near maximum → Greater conviction
Current near minimum → Lack of interest
Use as CONFIRMATION, not as main signal
🎓 FINAL WORDS
This EA is your learning companion, not a "get rich quick" system. Use it to:
📚 Learn
Identify trends and market structure
💪 Practice
Discipline and patience in trading
🔍 Understand
Importance of volume and confirmation
🎯 Develop
Patience (NO TRADE is a valid signal)
REMEMBER!
The best trader is not the one who wins the most, but the one who loses the least.
Manual created for the trading community
Sharing knowledge is growing together! 🚀
📈 EA MANUAL - TRADING SIGNALS SYSTEM
"Training Wheels" for Safe and Educational Trading
⚠️ CURRENT MARKET ANALYSIS
Status: LOW VOLATILITY - NO CLEAR DIRECTION
Condition: Typical low-volume session - Wait for better opportunities
Advice: PATIENCE - "NO TRADE" is a valid signal
🎯 SYSTEM OVERVIEW
WHAT IS THIS EA?
Educational system designed as "training wheels" for automated trading, providing clear signals while protecting capital.
SYSTEM PHILOSOPHY
✅ Safe Learning: Operates with proven technical criteria
✅ Capital Protection: Filtered signals to minimize risks
✅ Continuous Education: Every signal is a learning opportunity
KEY FEATURES
🎯 Trend Analysis
Identifies market direction using EMAs
📊 Market Structure
Analyzes highs/lows for overall context
🔍 Volume Analysis
Includes current vs historical volume for confirmation
⚡ Clear Signals
Indicates exactly WHAT TO DO at every moment
🔧 INSTALLATION & SETUP
SYSTEM REQUIREMENTS
📱 Platform: MetaTrader 5
💱 Trading Pair: Any pair (recommended: EURUSD, XAUUSD)
⏰ Timeframe: Any timeframe (optimal: H1, H4)
🏢 Broker: Any broker with MT5
INSTALLATION STEPS
Download EA: `.mq5` file
Copy to Platform:
Open MetaTrader 5
Go to: `File → Open Data Folder`
Navigate to: `MQL5/Experts/`
Paste EA file
Compile:
In MT5, go to `View → Navigator`
Find EA, right click → `Compile`
Activate on Chart:
Drag EA from Navigator to chart
Configure parameters (optional)
Click OK
PARAMETER CONFIGURATION
Parameter Default Value Description
emafastPeriod 14 Fast EMA period for immediate trend
ema200Period 200 Slow EMA period for main trend
periodo_busqueda 100 Bars to analyze for highs/lows
volumen_lookback 25 Bars for historical volume analysis
📊 TRADING SIGNALS
INFORMATION PANEL INTERPRETATION
1. MAXIMUM & MINIMUM PRICES
Example: Maximum Price: 1.08540 | Minimum Price: 1.07820
Interpretation: Trading range of last 100 bars
2. BULLISH EMA STRUCTURE
BULLISH MARKET STRUCTURE EMAS
→ EMA 14 > EMA 200 → Bullish market
3. BEARISH EMA STRUCTURE
BEARISH MARKET STRUCTURE EMAS
→ EMA 14 < EMA 200 → Bearish market
4. VOLUME ANALYSIS
VOLUME ANALYSIS (Last 25 bars):
Current Volume: 15240 | Max Volume: 28500 | Min Volume: 8200
Interpretation:
High volume → Greater conviction in direction
Low volume → Possible trend change
Compare current vs historical for context
5. BUY SIGNAL
BUY!!! - Enter long when all conditions align
6. SELL SIGNAL
SELL!! - Enter short when all conditions align
7. DO NOT TRADE
NO TRADE!!! - Wait, conditions not optimal
ENTRY RULES
✅ CONDITIONS FOR BUY:
Bullish Structure: EMA 14 > EMA 200
Bullish Cross: EMA 14 crosses above EMA 200
Price Supported: Price > EMA 14
Volume Confirmation: Current volume preferably high
✅ CONDITIONS FOR SELL:
Bearish Structure: EMA 14 < EMA 200
Bearish Cross: EMA 14 crosses below EMA 200
Price Resisted: Price < EMA 14
Volume Confirmation: Current volume preferably high
🚫 DO NOT TRADE WHEN:
Shows "NO TRADE!!!"
Sideways market (EMAs very close)
Very low volume (lack of conviction)
Contradictory signals between indicators
🛡️ RISK MANAGEMENT
FOR BEGINNER TRADERS
💰 1%-2% Rule
Never risk more than 1-2% of capital per trade
🎯 Risk/Reward 1:1.5
Aim to take more profit than risk assumed
⏰ Market Hours
Trade during main sessions (London/NY) for better volume
PROTECTION TIPS
Mandatory Stop Loss: Always use protection
Reasonable Take Profit: Based on support/resistance
Avoid News: Don't trade during major economic announcements
Daily Review: Analyze trades every day
TRADE EXAMPLE
📈 BUY TRADE EXAMPLE
Signal: "BUY!!!" on panel + bullish structure
Entry: Current price (eg: 1.08200)
Stop Loss: 50 pips (1.07700) - below EMA 200
Take Profit: 75 pips (1.08950) - toward recent high
Risk/Reward: 1:1.5 ✓
❓ FREQUENTLY ASKED QUESTIONS
Does the EA execute trades automatically?
No, this EA is signal-only. It shows what to do but the trader must execute trades manually.
Which timeframes work best?
H1 and H4 are most stable. Lower timeframes (M1-M15) may generate many false signals.
Do I need previous knowledge?
No, it's designed for beginners. However, I recommend learning basic trading concepts.
What to do when it says "NO TRADE!!!"?
WAIT. This is the most important signal. It means conditions are not optimal and it's better not to trade.
How to interpret volume analysis?
Compare current volume with historical:
Current near maximum → Greater conviction
Current near minimum → Lack of interest
Use as CONFIRMATION, not as main signal
🎓 FINAL WORDS
This EA is your learning companion, not a "get rich quick" system. Use it to:
📚 Learn
Identify trends and market structure
💪 Practice
Discipline and patience in trading
🔍 Understand
Importance of volume and confirmation
🎯 Develop
Patience (NO TRADE is a valid signal)
REMEMBER!
The best trader is not the one who wins the most, but the one who loses the least.
Manual created for the trading community
Sharing knowledge is growing together! 🚀
: