Trabajo finalizado
Tarea técnica
Indicator drawing 14 moving averages in SMA + EMA pairs for 7 periods.
Periods:
A-0: X
A-1: X * 0.618034
A-2: X * 0.618034 ^ 2
A-3: X * 0.618034 ^ 3
A+1: X * 1.618034
A+2: X * 1.618034 ^ 2
A+3: X * 1.618034 ^ 3
The period A-0 is predetermined, the remaining periods are calculated. Values of coefficients for calculating other periods are parameters. A pair of SMA and EMA is drawn for each period. One can specify its color, thickness and line type for each MA. Values of all calculated periods of averages are recorded in the MT4 log.
Period A-0 can be given in 2 modes - the indicator operation mode should be parameter:
manually as indicator’s parameter
through the candle selection mode described below.
Candle selection mode:
The DRAW button is placed on the chart. Pressing it allows you to select any 2 candles by clicking on them. After selecting 2 candles:
direction according to the position of candles relative to each other is defined, older candle lower, newer higher - BUY, the opposite - SELL
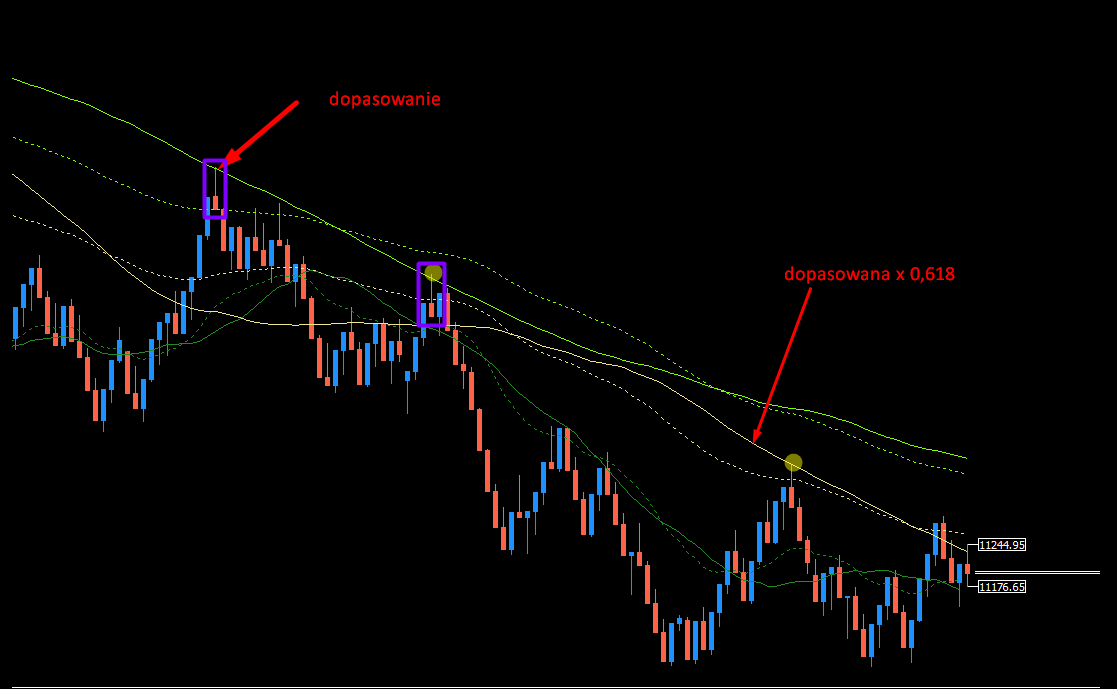
we look for SMA A-0, which period X should be in the range 50-600 (parameter), whose values are closest to the lows of both selected candles for the BUY direction or highs of both selected candles for the SELL direction.
Pressing button again erases all MAs and starts the process of selection again.
Example chart showing 2 candles in violet squares that after selection should generate green SMA is included.
Transfer of full copyrights to the source code is required for this order. In case of finalizing this project successfully it will be possible to permanently cooperate with more projects. I am a programmer myself and will require good programming skills from the contractor along with decent English. Do not apply if you are a novice amateur.
Regards,
Marcin