Need some help with modification to indicator and creating a labels/objects on the chart

MQL4 Indicadores Asesores Expertos

Trabajo finalizado

Plazo de ejecución 1 día
Comentario del Cliente
Excellent programmer! highly recommended
Comentario del Ejecutor
Good customer. Interesting task. Good luck.

Tarea técnica

I wrote two indicators and need some help with checking out the code and adding some more features. 


Fly price indicator calculates the distance between two spreads (EURGBP - EURUSD) and (EURUSD - GBPUSD) and plots this on a separate window as well as 10, 20 period moving average and 20 period bollinger band (adding and subtracting standard deviation from 20 period moving average). 

Normalised Fly price plots normalised distance ( (distance-average)/standard deviation) and moving average of it. 


I am a very beginner at coding and would like someone to check all the calculations and methods I wrote to make sure they both do as described above and rewrite codes in more efficient way where necessary. 

Then I would like to add the following:

  1. A horitzontal line to the current indicator values which change as the values fluctuate. You will be able to see that I already attempted this.
  2. Display current fly price on the chart window (flyprice[0]) 
  3. Create variables that store current normalised values[0] of specific timeframe (5min, 15min, 1hour and 4hour) and display these on the chart 
  4. Please have a look at the alert and notification function and change it so that it only alerts and notifies once when normalised value[1] of any timeframe(5min, 15min, 1hour and 4hr chart is greater or equal to 2 and less or equal to -2. Alert/notification must say which timeframe is alerting from
  5. Display x period standard deviation of each timeframe (5min, 15min, 1hour and 4hour) on the chart.  x is an extern variable. For example if x = 3, compute (stdev[1] + stdev[2] + stdev[3]) / x for 5min, 15min, 1hour and 4hour and display these 4 average stdev on the chart window.
  6. 3,5 must have 5 decimal point
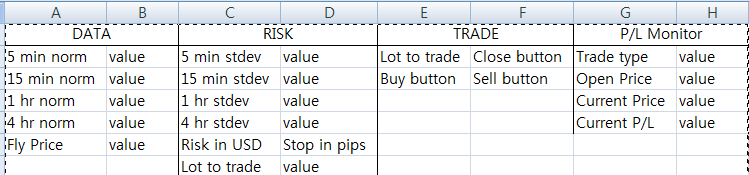
  7. Create two edit labels on the chart that takes in risk in USD and stop in pips and create a text label "lot to trade" that computes risk in USD/stop in pips
  8. Create an edit label that takes in lot to trade and a buy, sell, close button that executes ordersend(). For example, buy button buys (lot to trade) amount of EURGBP, (lot to trade) amount * 2 of EURUSD and (lot to trade) amount of GBPUSD at market price
  9. Create 4 text labels "Trade Type", "Open price", "Current price" and "Current P/L". Trade type prints Long if EURGBP was bought (i.e Long EURGBP, Short EURUSD, Long GBPUSD) and viceversa. Open price calculates at which price the spread is bought/sold (EURGBP - EURUSD) and (EURUSD - GBPUSD). Current price returns number 2, flyprice[0] and Current P/L computes Open price - Current price if trade type is Long or Current price - Open price if trade type is Short.


I want the labels on the chart to appear as the following:


Archivos adjuntos:

Han respondido

1
Desarrollador 1
Evaluación
(94)
Proyectos
162
40%
Arbitraje
20
15% / 75%
Caducado
73
45%
Libre
2
Desarrollador 2
Evaluación
(320)
Proyectos
466
42%
Arbitraje
78
12% / 63%
Caducado
75
16%
Trabaja
3
Desarrollador 3
Evaluación
(186)
Proyectos
261
69%
Arbitraje
12
33% / 67%
Caducado
16
6%
Libre
Solicitudes similares
Hello, I have an indicator that counts days and plots vertical lines after specific interval days from specific dates. I want to convert it for my trading view following all the inputs and settings
Hello please final budget 30$ Indicator name : Smart Money Concepts [LuxAlgo] I need to convert tradingview indicator to MetaTrader 5 indicator, And i need all functions and options appear in MT5 like in tradingview, And when i back to historical data in MT5 i need to be like tradingview exactly, And i need it today. Looking for least price and least time and clean code with zero error and zero warnning
Seeking someone who can create a robot or algorithm capable of sending 5-10 daily forex signals, each with 3 types of take profit, and achieving a high success rate similar to the one shown in the attached picture
Metatrader 30+ USD
I would like to calculate the deviations between the companies listed below with Meta Trader. Would you be interested? BETWEEN 01.00 AT NIGHT AND 00.00 OF THE NEXT DAY (FOR HOURS WHEN THE GOLD MARKET IS OPEN) *Instant comparison of prices of the same parities of different companies *Determination of deviation rates in downward or upward movements (average prices, prices below and above the average) *Detection of
The strategy is based on identifying overbought and oversold conditions across multiple timeframes. The primary indicator used is the stochastic indicator. Stochastic Settings: • %K period: 100 • %D period: 5 • Slowing: 4 •Price field : close/close For buying: • stochastic Signal line/Both Most be in the oversold zone (20 level of stochastic) on the H4, H1, 30m, 15m, 5m, and 1m timeframes. Final confirmation For a
Hello, I have an indicator on Trend View. I would like to convert it to a robot. The indicator is not very large, very simple, and works on a small time frame. Must be available Stop loss Setting goals Lot size time frame
Greenprint strategy 30 - 100 USD
Hello i need someone who can create an indicator to show the resistance support and pivot areas like in the shown images the indicators are bollinger bands moving averages also we have rsi and ma . Pictures below. You should be able to do work properly requesting a trial check when work is complete the indicator should also work with synthetic indices
I want someone who can create a Automatic mobile trading bot/EA with my kind of strategy...Example: : When The market is buying and rejects an has created an M formation the First leg is higher than the second leg(first leg Higher high,second leg lower high then a line must touch the peak of the Higher high then connect with the peak of the lower High as a Footprint line,then there must be Another line that touches
This isn’t your traditional project. I already have a completed program and script. This is just a add-on. I can share with you some of the current coding script and algorithm, but essentially I’m just looking for you to expand on the current one I have. From my experience, I can’t see an experience programmer taking more than an hour or two of their billable time to complete this

Información sobre el proyecto

Presupuesto
20 - 40 USD
Para el ejecutor
18 - 36 USD
Plazo límite de ejecución
de 1 a 5 día(s)