Mira cómo encargar de forma rápida un robot comercial
Lea las reglas antes de empezar el trabajo
Cómo encargar un robot comercial en MQL5 y MQL4
Mire el ejemplo de Tarea Técnica para encargar un robot
Nuevas solicitudes en la categoría:
Trabajo finalizado
Plazo de ejecución 4 días
Comentario del Ejecutor
Great customer. Fast reply and clear indications. It is a pleasure to work with him.
Comentario del Cliente
Excellent developer who delivered exactly what I was after in a very short timeframe! Would definitely use him again and recommend him to anyone who is looking for a fast and highly capable coder.
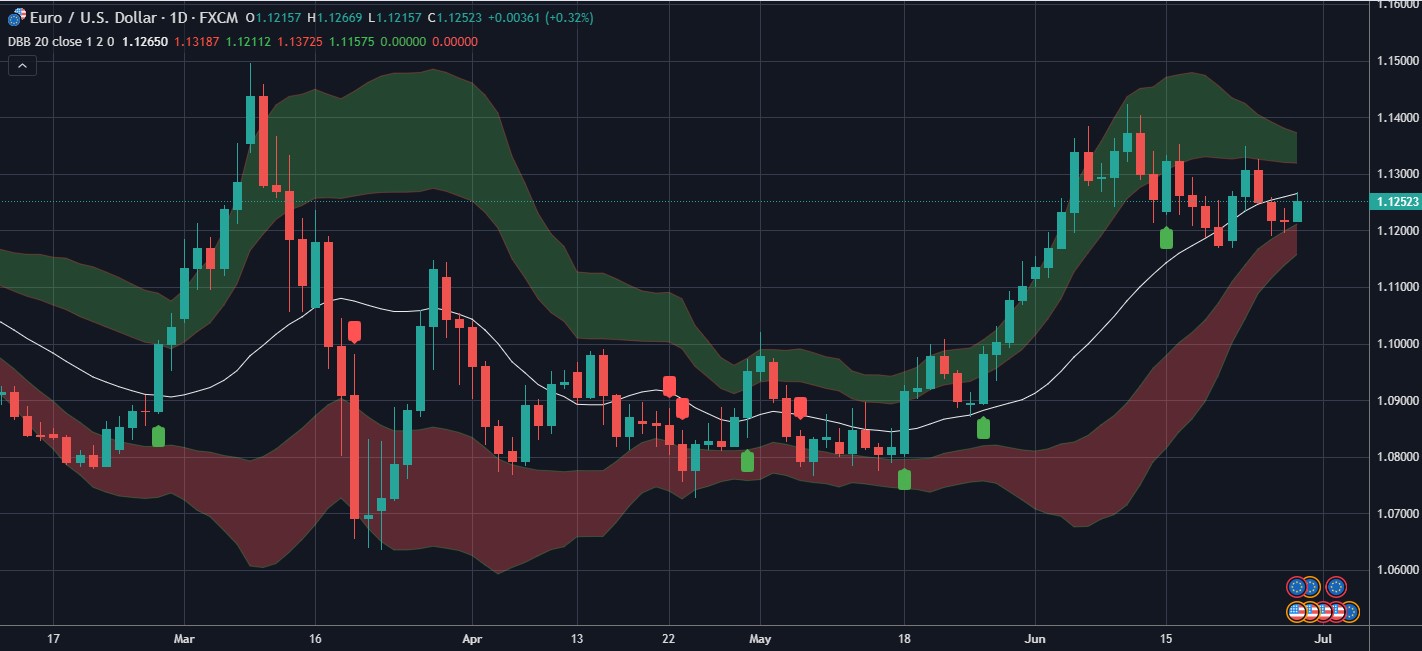
Tarea técnica
Task: Convert Tradingview script to MT4 indicator with all the adjustable input parameters from the Tradingview script transferred and functional in MT4 indicator with final MT4 indicator MQL4 source code provided on completion of task.
TradingView code below:
/ This source code is subject to the terms of the Mozilla Public License 2.0 at https://mozilla.org/MPL/2.0/
// © simtrader19a
//@version=4
study(title="Double Bollinger Bands", shorttitle="DBB", overlay=true)
//------------------------------ Inputs ------------------------------
length = input(20, title="length")
///src = input(close, type=source, title="source")
src = input(close, title="source")
std_dev_1 = input(1, title="BB1 stdDev")
std_dev_2 = input(2, title="BB2 stdDev")
offset = input(0, title="offset")
//------------------------------ Colors ------------------------------
color_gray = #eeeeee
color_green = #3fbe53
color_red = #ff4e3e
//------------------------------- Logic ------------------------------
median = sma(src, length)
standard_deviation = stdev(src, length)
standard_deviation_1 = standard_deviation * std_dev_1
upper_1 = median + standard_deviation_1
lower_1 = median - standard_deviation_1
standard_deviation_2 = standard_deviation * std_dev_2
upper_2 = median + standard_deviation_2
lower_2 = median - standard_deviation_2
//------------------------- Plotting & styling ------------------------
transp_bb_1 = 70
transp_bb_2 = 70
basis = plot(median, color=color_gray, transp=0, title="basis", offset=offset)
upper_band_1 = plot(upper_1, color=color_red, transp=transp_bb_1, title="BB1 upper", offset=offset)
lower_band_1 = plot(lower_1, color=color_green, transp=transp_bb_1, title="BB1 lower", offset=offset)
//fill(basis, upper_band_1, color=color_red, transp=transp_bb_1, title="background BB1 upper")
///fill(basis, lower_band_1, color=color_green, transp=transp_bb_1, title="background BB1 lower")
upper_band_2 = plot(upper_2, color=color_red, transp=transp_bb_2, title="BB2 upper", offset=offset)
lower_band_2 = plot(lower_2, color=color_green, transp=transp_bb_2, title="BB2 lower", offset=offset)
fill(upper_band_1, upper_band_2, color=#4CAF50, transp=transp_bb_2, title="background BB2 upper")
fill(lower_band_1, lower_band_2, color=#FF5252, transp=transp_bb_2, title="background BB2 lower")
////ENTRY /////
LONG=(close>open and close>close[1]and close>upper_1 and close[1]<upper_1)
SHORT=(close<open and close<close[1] and close<lower_1 and close[1]>lower_1)
plotshape(LONG,title="Long",location=location.belowbar, style=shape.labelup, color=#4CAF50, text="B")
plotshape(SHORT,title="Sell",location=location.abovebar, style=shape.labeldown, color=#FF5252, text="S")
Han respondido
1
Evaluación
Proyectos
11
18%
Arbitraje
8
38%
/
38%
Caducado
1
9%
Libre
2
Evaluación
Proyectos
24
8%
Arbitraje
0
Caducado
0
Libre
3
Evaluación
Proyectos
0
0%
Arbitraje
0
Caducado
0
Libre
4
Evaluación
Proyectos
28
29%
Arbitraje
2
0%
/
50%
Caducado
1
4%
Libre
5
Evaluación
Proyectos
837
61%
Arbitraje
33
27%
/
45%
Caducado
24
3%
Libre
Ha publicado: 1 ejemplo
6
Evaluación
Proyectos
317
24%
Arbitraje
23
35%
/
13%
Caducado
23
7%
Libre
Ha publicado: 3 ejemplos
7
Evaluación
Proyectos
499
67%
Arbitraje
5
40%
/
0%
Caducado
4
1%
Libre
Ha publicado: 8 ejemplos
8
Evaluación
Proyectos
57
23%
Arbitraje
12
67%
/
8%
Caducado
2
4%
Libre
9
Evaluación
Proyectos
945
47%
Arbitraje
309
58%
/
27%
Caducado
125
13%
Libre
10
Evaluación
Proyectos
0
0%
Arbitraje
0
Caducado
0
Libre
Ha publicado: 9 ejemplos
Solicitudes similares
I need a developer that can make my trading strategies into a working perfect EA Robot working on Mt5. Candlestick pattern confirmation through PDH, PDL, PWH, PWL, Liquidities, HTF OB
Platform MetaTrader 5 (MT5) MQL5 Source Code Required Compatible with Exness MT5 both standard and cent accounts/ICMarket accounts Works on EUR/USD only (initial version) ⸻ Objective Develop a fully automated AI Expert Advisor based on ICT Smart Money Concepts (SMC). The EA must only execute high-probability trades that satisfy all required conditions before opening a position. The EA must avoid overtrading and
MT4/MT5 HFT EA us30
30 - 3000 USD
Hello everybody, I'm looking for an experienced MQL4/MQL5 developer to optimize a High-Frequency Trading (HFT) Expert Advisor for both MT4 and MT5. The EA performs consistently and profitably on demo accounts, but when it is run on Raw and Standard live accounts under what appear to be the same trading conditions, it begins generating losses. I do not have the original source code (.mq4/.mq5); I only have the
MT4/MT5 HFT EA Live Trading
40 - 10000 USD
I have a High-Frequency Trading (HFT) Expert Advisor for both MT4 and MT5 designed primarily for US30 (Dow Jones Index) . The EA performs consistently and profitably on demo accounts, but when I run it on an IC Markets Raw or Standard live account, it starts generating losses under what appear to be the same trading conditions. At this time, I cannot provide the source code (.mq4/.mq5). I can only provide the
HFT / Latency Arbitrage pepperstone
30 - 5000 USD
I am looking for an experienced MQL5 developer to build a high-frequency (HFT) latency arbitrage Expert Advisor for Pepperstone MT5 , using LMAX as the leading price feed. The initial focus will be on US30 (Dow Jones) , and if the strategy proves successful, I want the EA to be easily expandable to additional symbols such as NAS100, GER40, XAUUSD, major forex pairs, and other supported instruments. The EA should
EA Crafter
500+ USD
Act as a professional Quantitative Developer and Risk Manager. I want to build a systematic trading strategy rulebook that prioritizes capital preservation and statistical edge over raw performance. Please generate a structured trading strategy using the following framework: 1. ASSET CLASS & TIMEFRAME: - Asset: [e.g., Apple (AAPL), Bitcoin (BTC), or EUR/USD] - Timeframe: [e.g., 5-minute, 1-hour, Daily] 2. CORE
مطلوب مبرمج اكسبيرت
30+ USD
أحتاج إلى مستشار خبير لمنصة MetaTrader 5 (MT5) مصمم كآلة حالة محدودة (FSM). يجب أن ينفذ أوامر السوق فقط بناءً على مستويات أسعار يحددها المستخدم. يجب ألا يستخدم أي مؤشرات أو تحليل فني أو أوامر معلقة أو ذكاء اصطناعي أو قرارات تداول تلقائية. يجب أن ينفذ المستشار الخبير ببساطة تسلسلًا محددًا مسبقًا لمستويات الأسعار كما يحددها المستخدم تمامًا، مع إدارة دقيقة للحالة، ودورة نشطة واحدة في كل مرة، ومعالجة الفجوات السعرية،
Driven Multiple Choice
30+ USD
Part 1: Project setup Input settings (risk, stop loss, take profit, EMA periods) Indicator initialization Trade management framework Part 2: Trading logic EMA crossover detection Buy/Sell entry rules One-trade-per-symbol check Part 3: Risk management Automatic lot size calculation Stop-loss and take-profit placement Trade execution and error handling Part 4: Final touches On-screen information Optimization
I have an expert advisor's investor login. I want you to study it and make me the exact same EA. There should be absolutely no differences or mistakes. You should have great observation skills for this aswell
Developer to build a simple EA
30+ USD
I am looking for an experienced MQL5 developer to code a custom Expert Advisor for MetaTrader 5 based on my own private trading strategy.I have all the specific entry rules, exit conditions, and risk management parameters fully prepared. I will share these exact details with the selected developer via direct message once the job is initiated.The final delivery must include the clean, fully commented source code (.mq5
Información sobre el proyecto
Presupuesto
30+ USD
Plazo límite de ejecución
de 1 a 3 día(s)