 Todos los encargos
 Reglas
Tarea técnica
I need a professional and immediately available Programmer to help me work on ann expert advisor that can work on a simple Daily Strategy with the following input.
1. I will set the minimum distance
2. I will set the maximum distance
3. The robot will start at a price
4. I will set the time of the activation of the bids eg 7am, 6am etc. Expert will start reporting afterwards
5. The average distance of the bids example this will be the average between the maximum and minimum distance set at the beginning.
6. The highest and lowest prices at the time of daily activation. At start when Expert is activated it identifies the current highest and lowest price for the day so far. This will be used to identify the current distance so far. if price starts when Robot is activated it uses the lowest and highest prices to take bids based on the direction of the market. The START Price will be like the middleman for the day and will determine when the robot will change direction.
The Robot will compare current daily distance to minimum distance at the activation time of the robot. if current daily distance so far for the day is higher than minimum distance then start pricing from the START time and reduce the minimum distance by 30% or a set variable in values or %. if current daily gap (CDG) distance is lower than the minimum distance then continue to use the highest and lowest price at the time of activating the Expert. The robot will indicate the active market as BUY or SELL. BUY if market price is going up above the start price and SELL if market price is going downwards or below the start price there will be an active lot size and the lot size for the non-active market there will also be a position for consolidation based on average of both Maximum and Minimum distance. So once the actual price crosses the daily average towards a direction from the start price/ extreme, it begins to consolidate and reduce the direction lot size until it reaches the target.
Bids will activate at every minimum distance until it gets to the maximum distance for the day when it moves TOWARDS the direction
Bids will activate at every double or higher size of minimum distance until it gets to the maximum distance for the day when it moves AGAINST the direction.
All bids will close when they reach the maximum distance for the day.
Experts/ Robot should consolidate the profit or loss level of all bids at every point in time.
If bids crosses the average daily target and is in profit then it should protect the profit not to go to Loss by closing the profit if it reverts below 25% or if it wants to go to negative i.e. at 0.
Robot should compare current start price to previous 5 days average Start prices and identify if it's HIGH or LOW and indicate it on the SCREEN. Example, if start price is 20 for example and previous 5 days start average is 19 then the daily position comparison (DPC) is HIGH. If today starts price is 15 then the DPC will be LOW.
Below is an EXAMPLE of a TEMPLATE But based on Monthly (rather than daily data) that i can send to give a better understanding of what i want. You have the variables below as
1 Product Name
2 Start Price- 80.5
3 Start High is 81.5
4 Start Low at 80.1
5. Dates which will be compared to Time in this project
6 Month Highest= Day Highest
7 Month Lowest = Day Lowest
8 PRM= Daily Target
9. Decision- Action of BUY or SELL
10 MTH GAP= Current Distance between Highest and Lowest
11 TARGET= % reached i e when you compare the current distance to the Target
12 MID Price= Average of HIGHEST and Lowest. But here will be Maximum and Minimum distance.
13. Maximum and Minimum distance are not set in the picture, but can be assumed as follows
Maximum is 6 and minimum is 1. So Average will then be 3.5 ie 6+1=7/2=3.5.
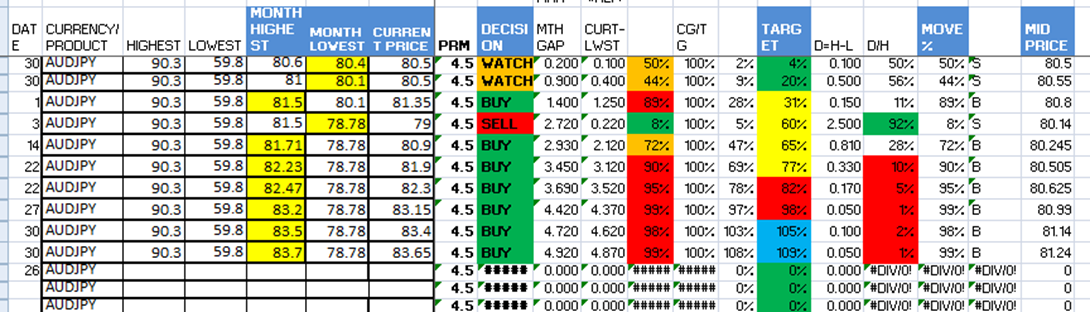
As shown above, you can see Price started at 80.5, then moved to 81.5 when Low is 80.1. Bid suppose to activate at 90.1 based on the Low for a BUY, but it didn’t reach it. Then price fell down to 78.78. Using Highest of 81.5 it will activate SELL at 81.5-1= 80.5 for First SELL. And price fell down to 78.78.
As Price reverses back to START price of 80.5, Then it will Start to BUY upwards at Higher lot size from the SELL of 80.5 as Direction is now HIGH.
Target at 78.78 Low will be 78.8+4.5= 83.28. So at 83.28 all bids closes.
In moving Upwards, EXPERT will BUY at 80.5 (START PRICE after crossing with a SELL), then at every gap of 1 ie 79.78, 80.78, 81.78, 82.78
And SELL (assuming DOUBLE minimum distance) at 80.5 (being first bid), then 80.78NOTE
Only Serious Programmers should apply
I will test for a period of 2 weeks minimum with daily updates on review with programmer
Cost will be part of the determinant for this current project and if successful, can make another version in MQL5