 Todos los encargos
 Reglas
Mira cómo encargar de forma rápida un robot comercial
Lea las reglas antes de empezar el trabajo
Cómo encargar un robot comercial en MQL5 y MQL4
Mire el ejemplo de Tarea Técnica para encargar un robot
Nuevas solicitudes en la categoría:
280 - 2000 USD
30+ USD
30 - 199 USD
30 - 35 USD
30+ USD
Trabajo finalizado
Plazo de ejecución 11 días

Comentario del Cliente
Great coder, good understanding of the requirements and a natural ability to maintain the original design of the indicator modified. Would hire again.
Comentario del Ejecutor
The best customer. All rules are described with full details. No changes on rules during job development. Recommended customer.
Tarea técnica
I have an indicator that displays multiple envelope levels in one, all with different settings.
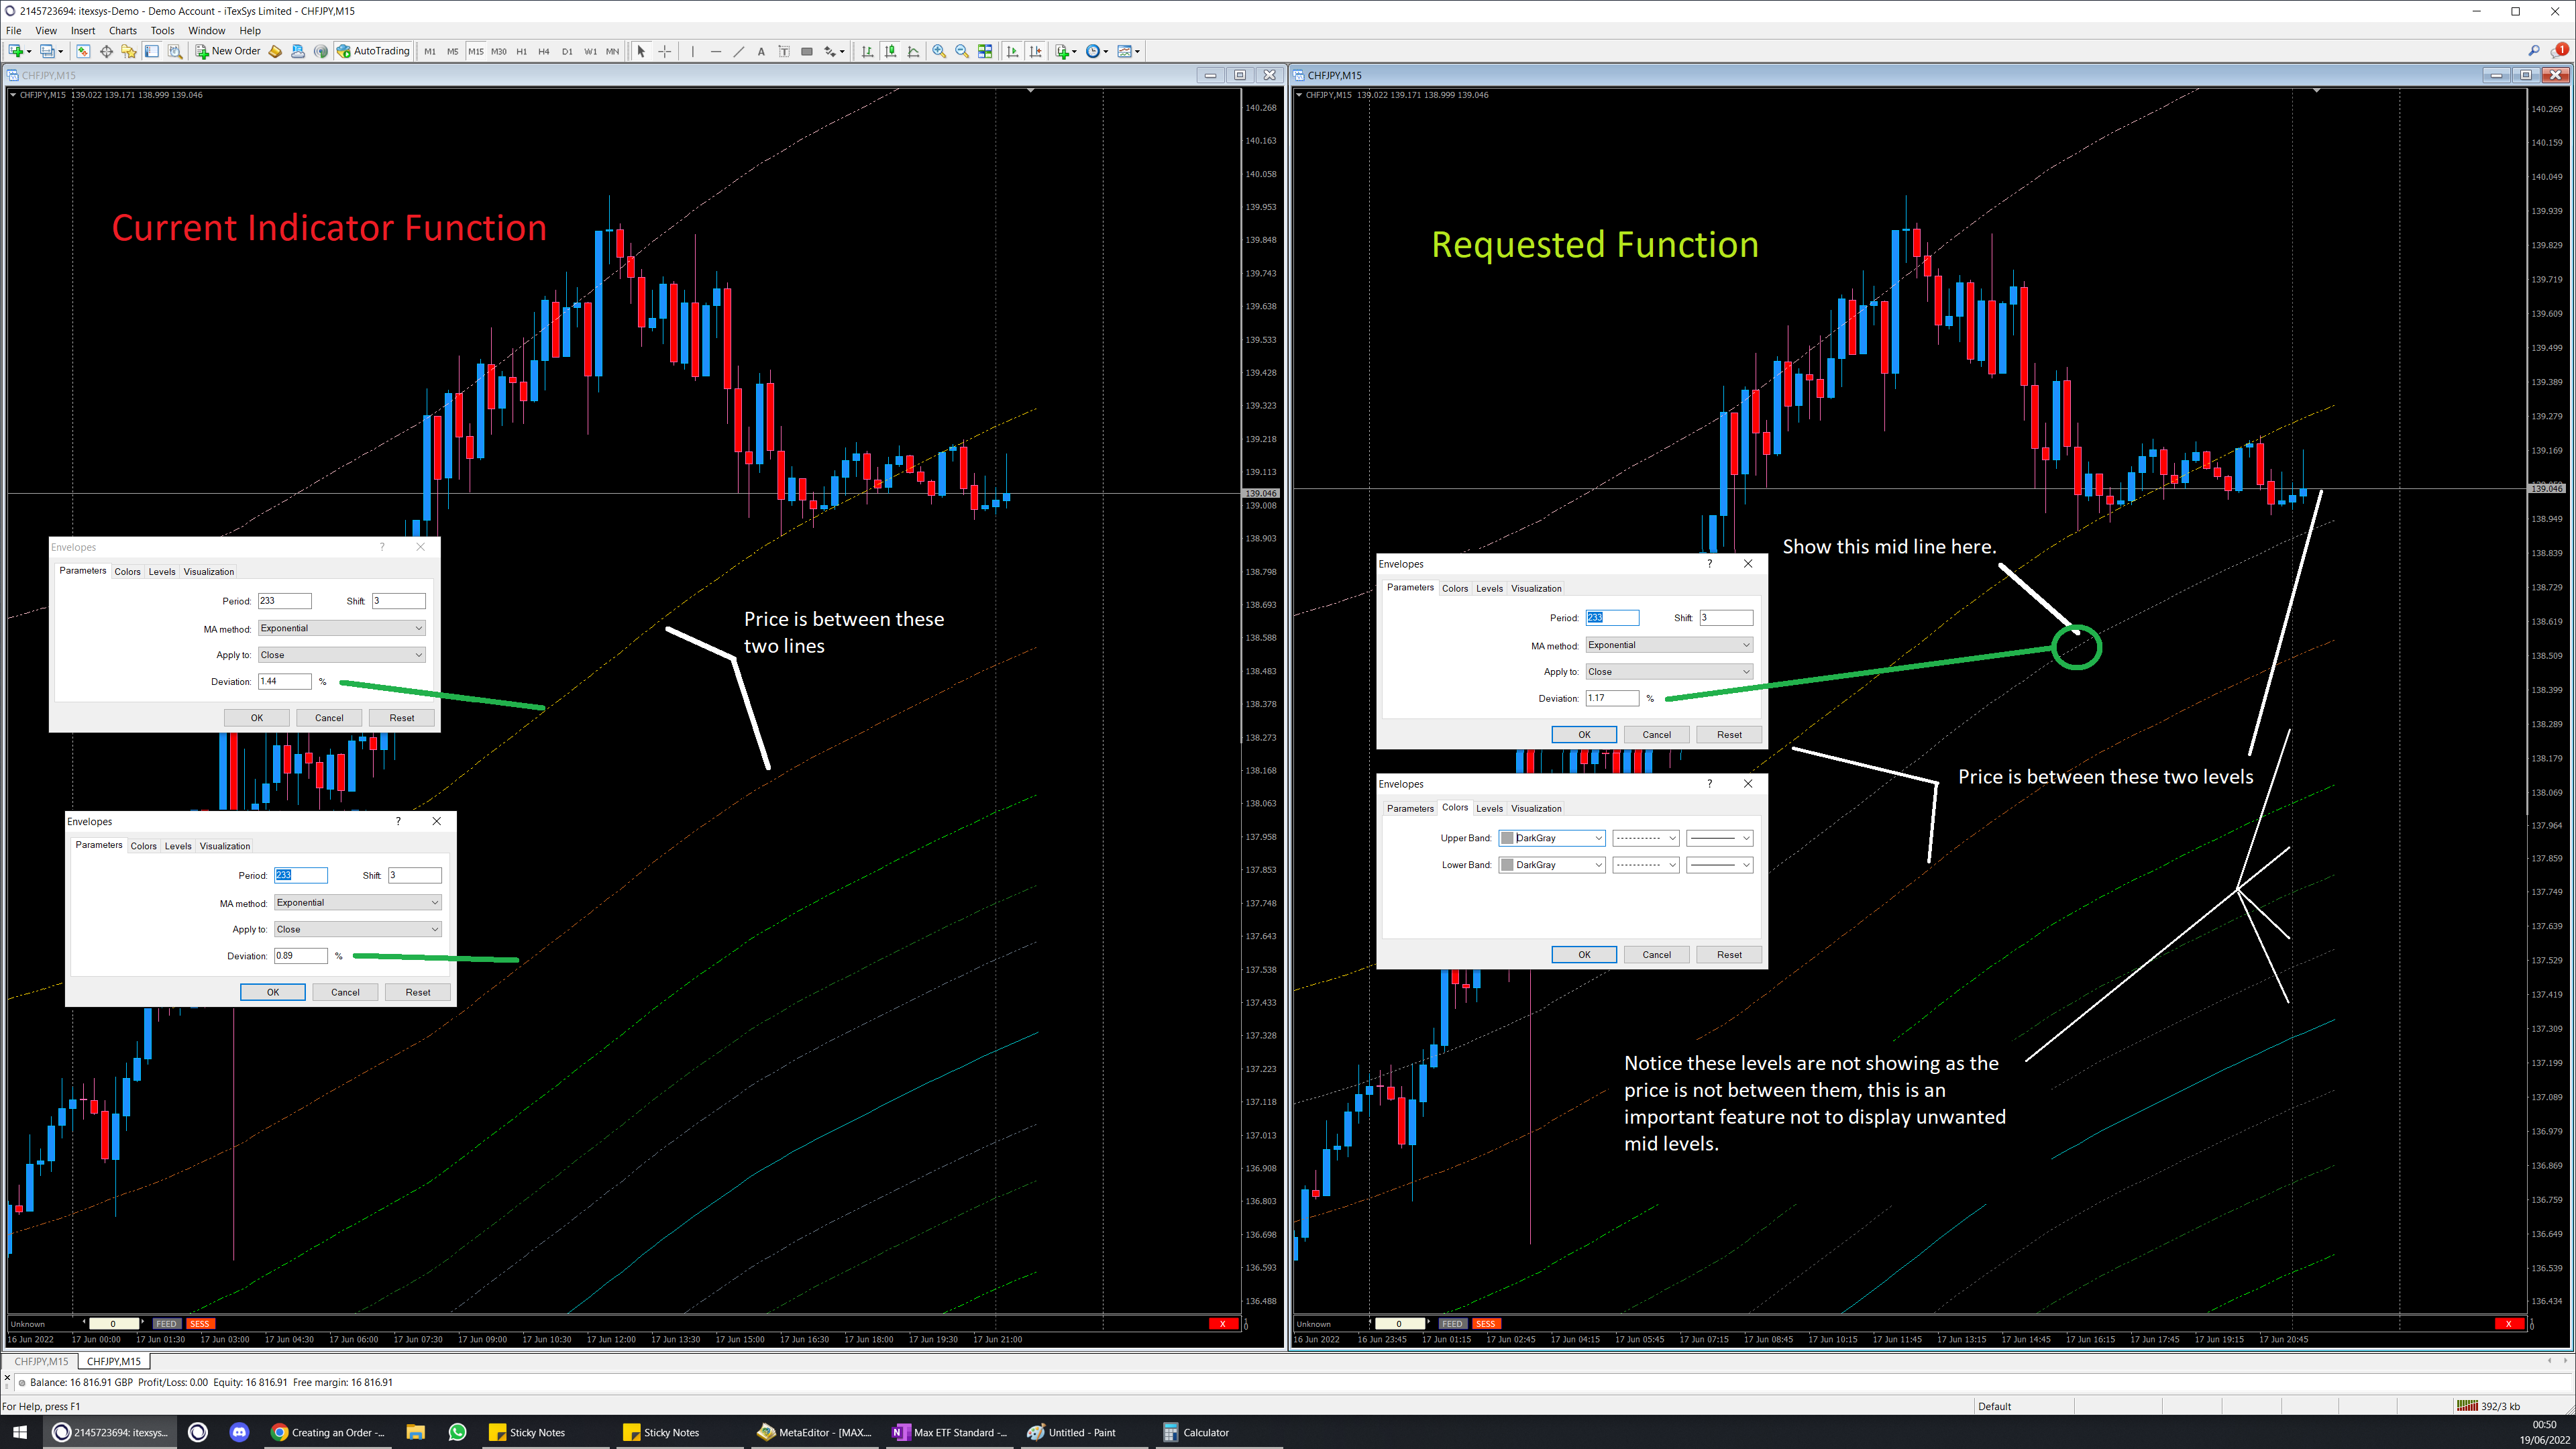
Currently the indicator only shows the Main levels as per the chart below, we run an upper and a lower envelope at each level always visible on the chart. I want to add a feature that will add mid levels when the price is between two main levels and then remove that if it moves out of that zone. Please see screenshot for a visual example of what I am looking for.
- IF price is between two of the levels shown below, show a mid envelope line.
- This will be used on live charts and also offfline charts so must be compatible with both.
- Only needs to be calulated on bar close, as thats when showing the mid line matters.
- So if price is between 0.13 and 0.21 envelope level show the 0.17 envelope on the chart.
- Only show the mid level on the chart when the price is between the main levels, once price moves out into another main level pair remove the mid level from the chart and display the new mid level. E.G.
- Price is between 0.13 and 0.21 so mid level 0.17 is displayed on the chart.
- Price moves down between 0.21 and 0.34 envelopes.
- 0.17 mid level is removed from the chart.
- 0.27 mid level is show on the chart.
Envelope Levels used within indicator. Between each level is a mid level.
| Main Levels | Mid Levels |
|---|---|
| 0.13 | 0.17 |
| 0.21 | 0.27 |
| 0.34 | 0.44 |
| 0.55 | 0.72 |
| 0.89 | 1.16 |
| 1.44 | 1.88 |
| 2.33 | 3.05 |
| 3.77 | 4.93 |
| 6.10 | 7.98 |
| 9.87 | 12.92 |
| 15.97 | 20.90 |
| 25.84 | 33.82 |
| 41.81 | 54.73 |
| 67.65 |
Han respondido
1
Evaluación
Proyectos
159
49%
Arbitraje
15
53%
/
27%
Caducado
4
3%
Libre
2
Evaluación
Proyectos
17
29%
Arbitraje
6
17%
/
67%
Caducado
4
24%
Libre
3
Evaluación
Proyectos
18
6%
Arbitraje
31
3%
/
65%
Caducado
5
28%
Libre
4
Evaluación
Proyectos
102
23%
Arbitraje
12
25%
/
17%
Caducado
13
13%
Libre
5
Evaluación
Proyectos
1
0%
Arbitraje
1
0%
/
100%
Caducado
0
Libre
6
Evaluación
Proyectos
488
70%
Arbitraje
6
67%
/
0%
Caducado
2
0%
Trabaja
Solicitudes similares
I DO NOT need any programming or strategy development. I already have a working NinjaTrader 8 automated strategy based on a 3/5 EMA crossover. I need you to run my existing strategy through NinjaTrader Strategy Analyzer/Optimizer, test the existing adjustable parameters, and find robust settings with the best profit factor and lowest reasonable drawdown. I will provide the existing NinjaScript ZIP. I do not want the
Mr quetta
100+ USD
Yes, that is exactly what I need. The bot should not be restricted to a fixed list of currency pairs. It should technically scan all available Quotex pairs in real time and automatically select the pair where the market conditions are strongest. The bot should analyze each pair using multiple confirmations, such as short-term price momentum, trend direction, market structure, support/resistance, candle formation
Scalping Reaction Zones + Valid Order Blocks
30 - 150 USD
Platform: TradingView Programming Language: Pine Script v6 Type: Custom Indicator Project Name: Scalping Reaction Zones + Valid Order Blocks MAIN GOAL I need a custom TradingView indicator for scalping. The indicator must detect: 1. Reaction / Explosion Zones 2. Valid Order Blocks 3. Combined Reaction Zone + Order Block zones The indicator should NOT generate: Buy signals Sell signals TP SL Entry signals Trading
Project Description I am looking for an experienced MQL5/MT5 Expert Advisor developer to develop an automated trading EA for XAUUSD on the M3 timeframe , running on an Exness account . The EA will automate a manual strategy based on SNR/GAP zones , using two setup types: Price Rejection Price Correction The EA should identify valid BUY/SELL setups around predefined SNR/GAP areas, apply configurable RSI, SMA, EMA and
Maximas e Minimas + Super Trend
35+ USD
Indicador Maximas e Minimas + Super Trend O Indicador MAX/MIN é um indicador de análise técnica para o MetaTrader 5 , desenvolvido para ajudar você a identificar regiões importantes de preço e possíveis oportunidades de compra e venda. O que ele faz MAX/MIN: identifica máximas e mínimas relevantes do mercado e mostra os preços no gráfico. HH / HL / LH / LL: ajuda a visualizar a estrutura do mercado, mostrando quando
Hello Traders, Have a trading strategy or idea you want to automate? I specialize exclusively in MQL5 development, helping traders turn their concepts into professional trading solutions. Custom Expert Advisors — automate your strategy and reduce manual execution Custom Indicators — transform your market ideas into powerful trading tools Fix & Debug — identify errors and get your existing code working properly
I DO NOT need any programming or strategy development. I already have a working NinjaTrader 8 automated strategy based on a 3/5 EMA crossover. I need you to run my existing strategy through NinjaTrader Strategy Analyzer/Optimizer, test the existing adjustable parameters, and find robust settings with the best profit factor and lowest reasonable drawdown. I will provide the existing NinjaScript ZIP. I do not want the
I'm looking for an experienced developer to create an automated gold trading bot. The bot should be compatible with MetaTrader 4/5 and TradingView. Key Requirements: - Automated trading bot - Compatible with MetaTrader 4/5 and TradingView - Implement scalping and swing trading strategies Ideal Skills and Experience: - Proficiency in trading algorithms - Experience with gold trading - Familiarity with MetaTrader and
I need a robust optimization of my MT5 EA, mainly for XAUUSD (Gold). Please optimize the existing adjustable parameters such as entry/exit settings, SL/TP, trailing/break-even settings, and any other strategy parameters that are appropriate. I want the optimization focused on stable profitability, low/moderate drawdown, and robustness rather than simply the highest possible profit. Please use out-of-sample testing
NinjaTrader 8 / NinjaScript Phase 1 build: convert an existing Auction Market Theory (AMT) strategy into objective, alert-only decision-support logic. Not a bot, no auto-execution — trades stay manual. Covers NQ/MNQ, ES, CL, MGC using 30-min TPO/Volume Profile context with 5-min confirmation: one 5-min close outside VAH/VAL = acceptance, close back inside = rejection. Dashboard shows bias, auction state, location
Información sobre el proyecto
Presupuesto
30+ USD
Plazo límite de ejecución
a 6 día(s)