Mira cómo encargar de forma rápida un robot comercial
Lea las reglas antes de empezar el trabajo
Cómo encargar un robot comercial en MQL5 y MQL4
Mire el ejemplo de Tarea Técnica para encargar un robot
Nuevas solicitudes en la categoría:
30+ USD
30 - 100 USD
Tarea técnica
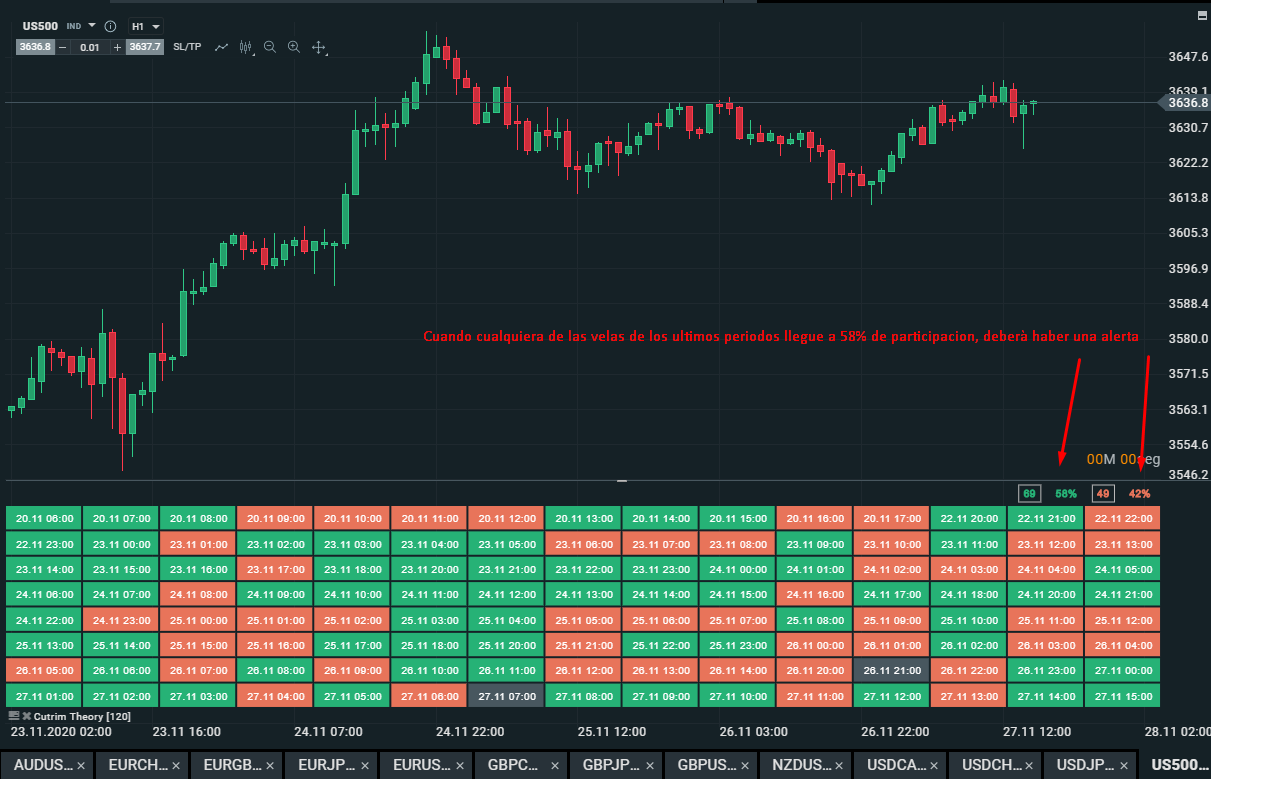
The cutrim theory is based on the imbalance of the market in a period of 120 candles. It analyzes the last 120 candles to create a percentage of red and green candles and when the percentage is lower for one of the two there is an entry possibility. So I need a robot that makes entries when the imbalance is more than 20% the entry would have to be on the candle with the lowest percentage this would be the parameter for entry. it would be nice to also add a grid, stop loss and take profit. I also want parameters for candle values entry and exit, such as when a candle closes against the entry and some more standard parameters.
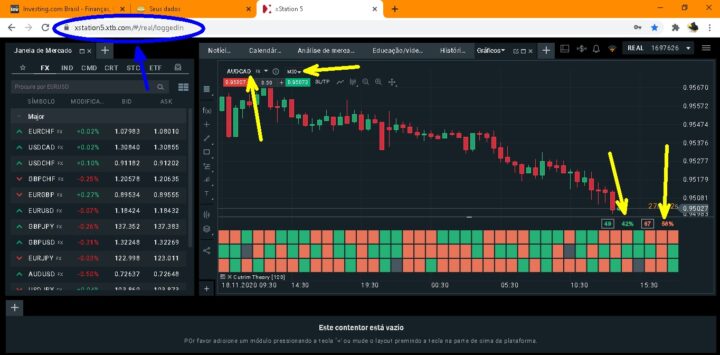
This indicator has the Broker XTB you can form it there, I want to bring a robot.
Han respondido
1
Evaluación
Proyectos
55
5%
Arbitraje
35
0%
/
94%
Caducado
24
44%
Trabaja
2
Evaluación
Proyectos
319
70%
Arbitraje
2
100%
/
0%
Caducado
0
Libre
Ha publicado: 1 ejemplo
3
Evaluación
Proyectos
17
59%
Arbitraje
2
0%
/
100%
Caducado
2
12%
Libre
4
Evaluación
Proyectos
477
40%
Arbitraje
105
40%
/
24%
Caducado
81
17%
Trabajando
Ha publicado: 2 ejemplos
Información sobre el proyecto
Presupuesto
30 - 100 USD
Plazo límite de ejecución
de 1 a 15 día(s)