Trabajo finalizado
Tarea técnica
Correction of the "HLMM" indicator and the "HLMM_ProMT5" oscillator!
The indicators repeatedly cause problems so that the chart stops.I use RunwiseFX's EA. The EA takes over the color index buffers 0 and 1 of the indicators. Works great with other indicators.
The programmer of both files has built in some kind of links between the two that interfere with the EA or the Metatrader, so that the chart stops.
I have been able to fix some problems in the meantime.
The EA no longer searches for the color index buffers 0 or 1, but only for the text BUY / Sell from the "HLMM" indicator and OcBUY and OcSELL from the oscillator "HLMM_ProMT5".
The EA does not use any further data from the indicators. So we were able to solve some problems and there are almost no more conflicts between the indicator, oscillator and the EA,
But the following problems still have to be solved!
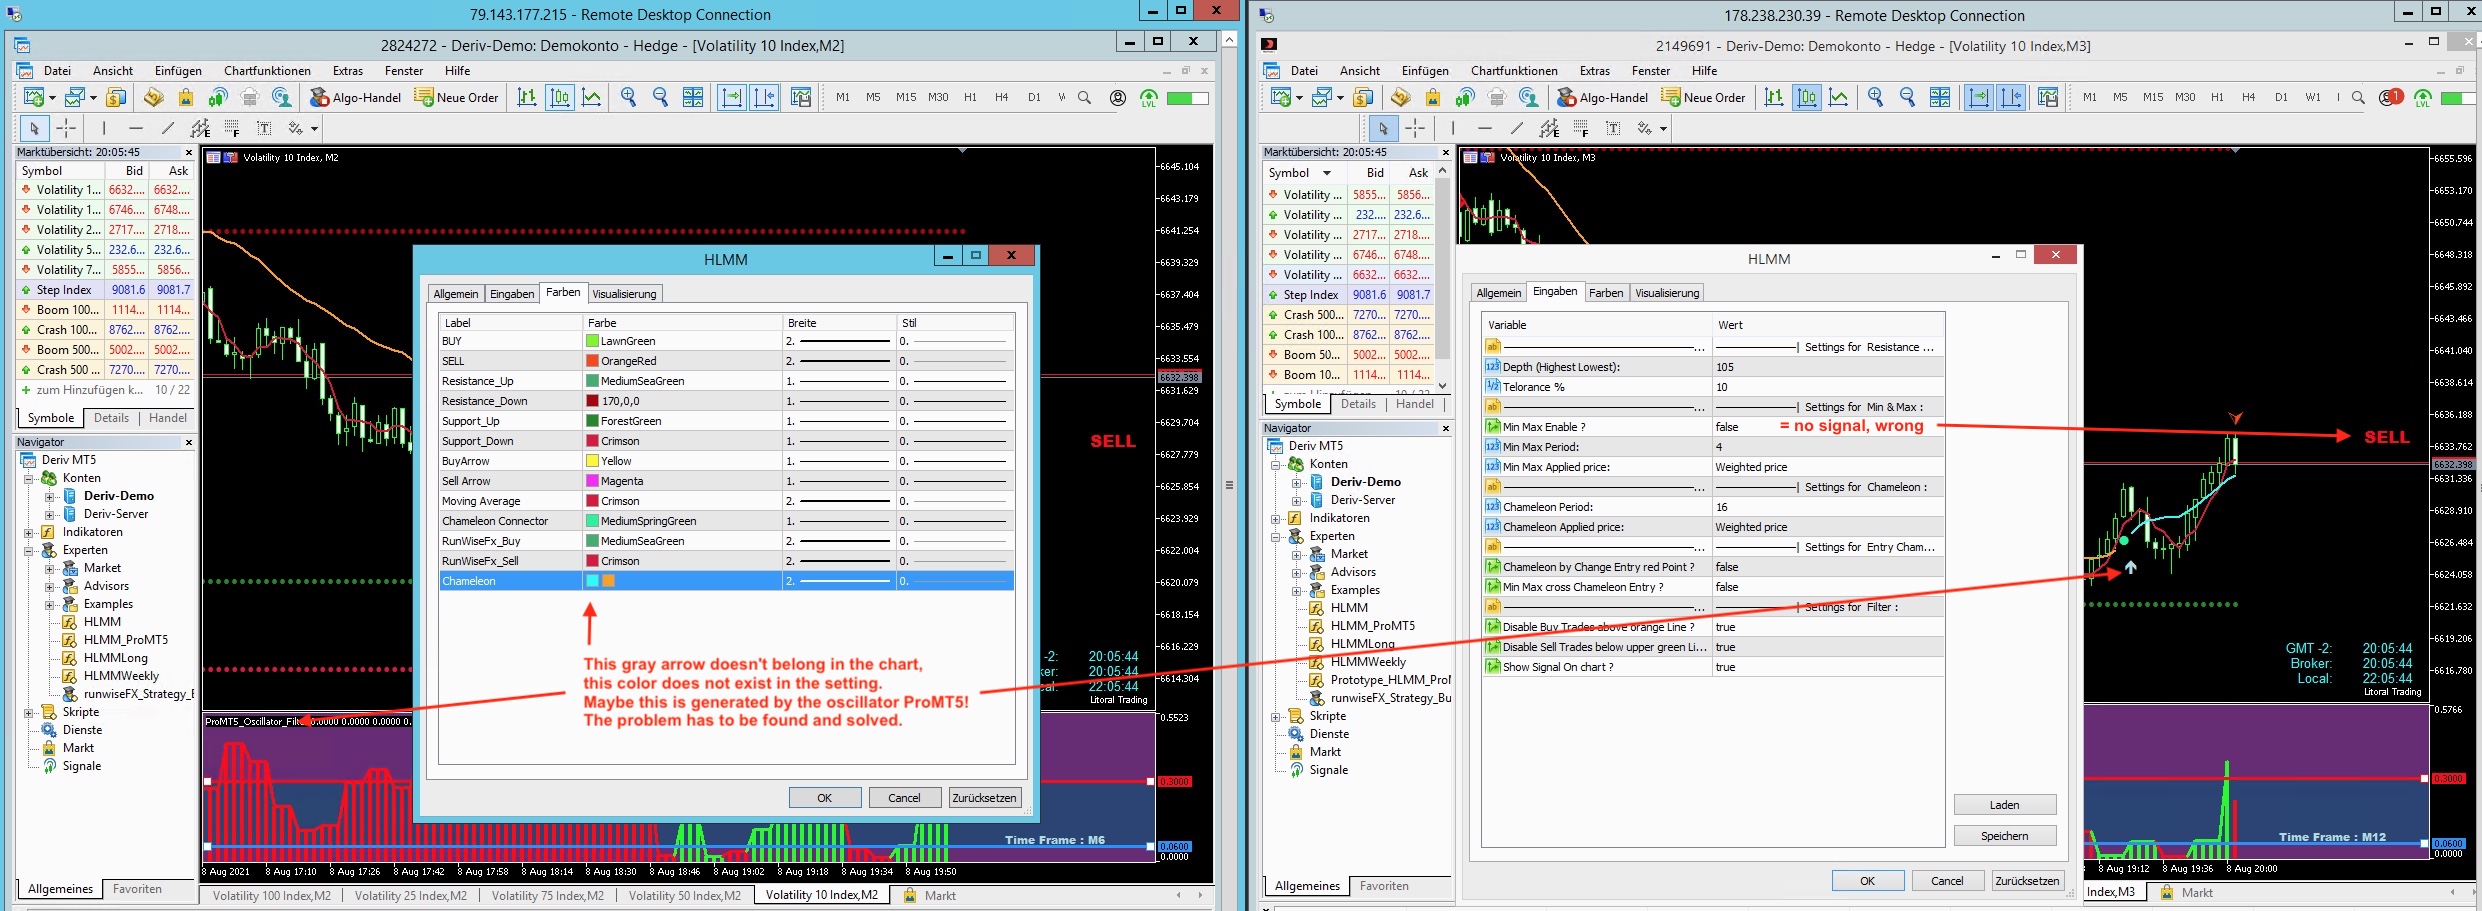
1: HLMM problem
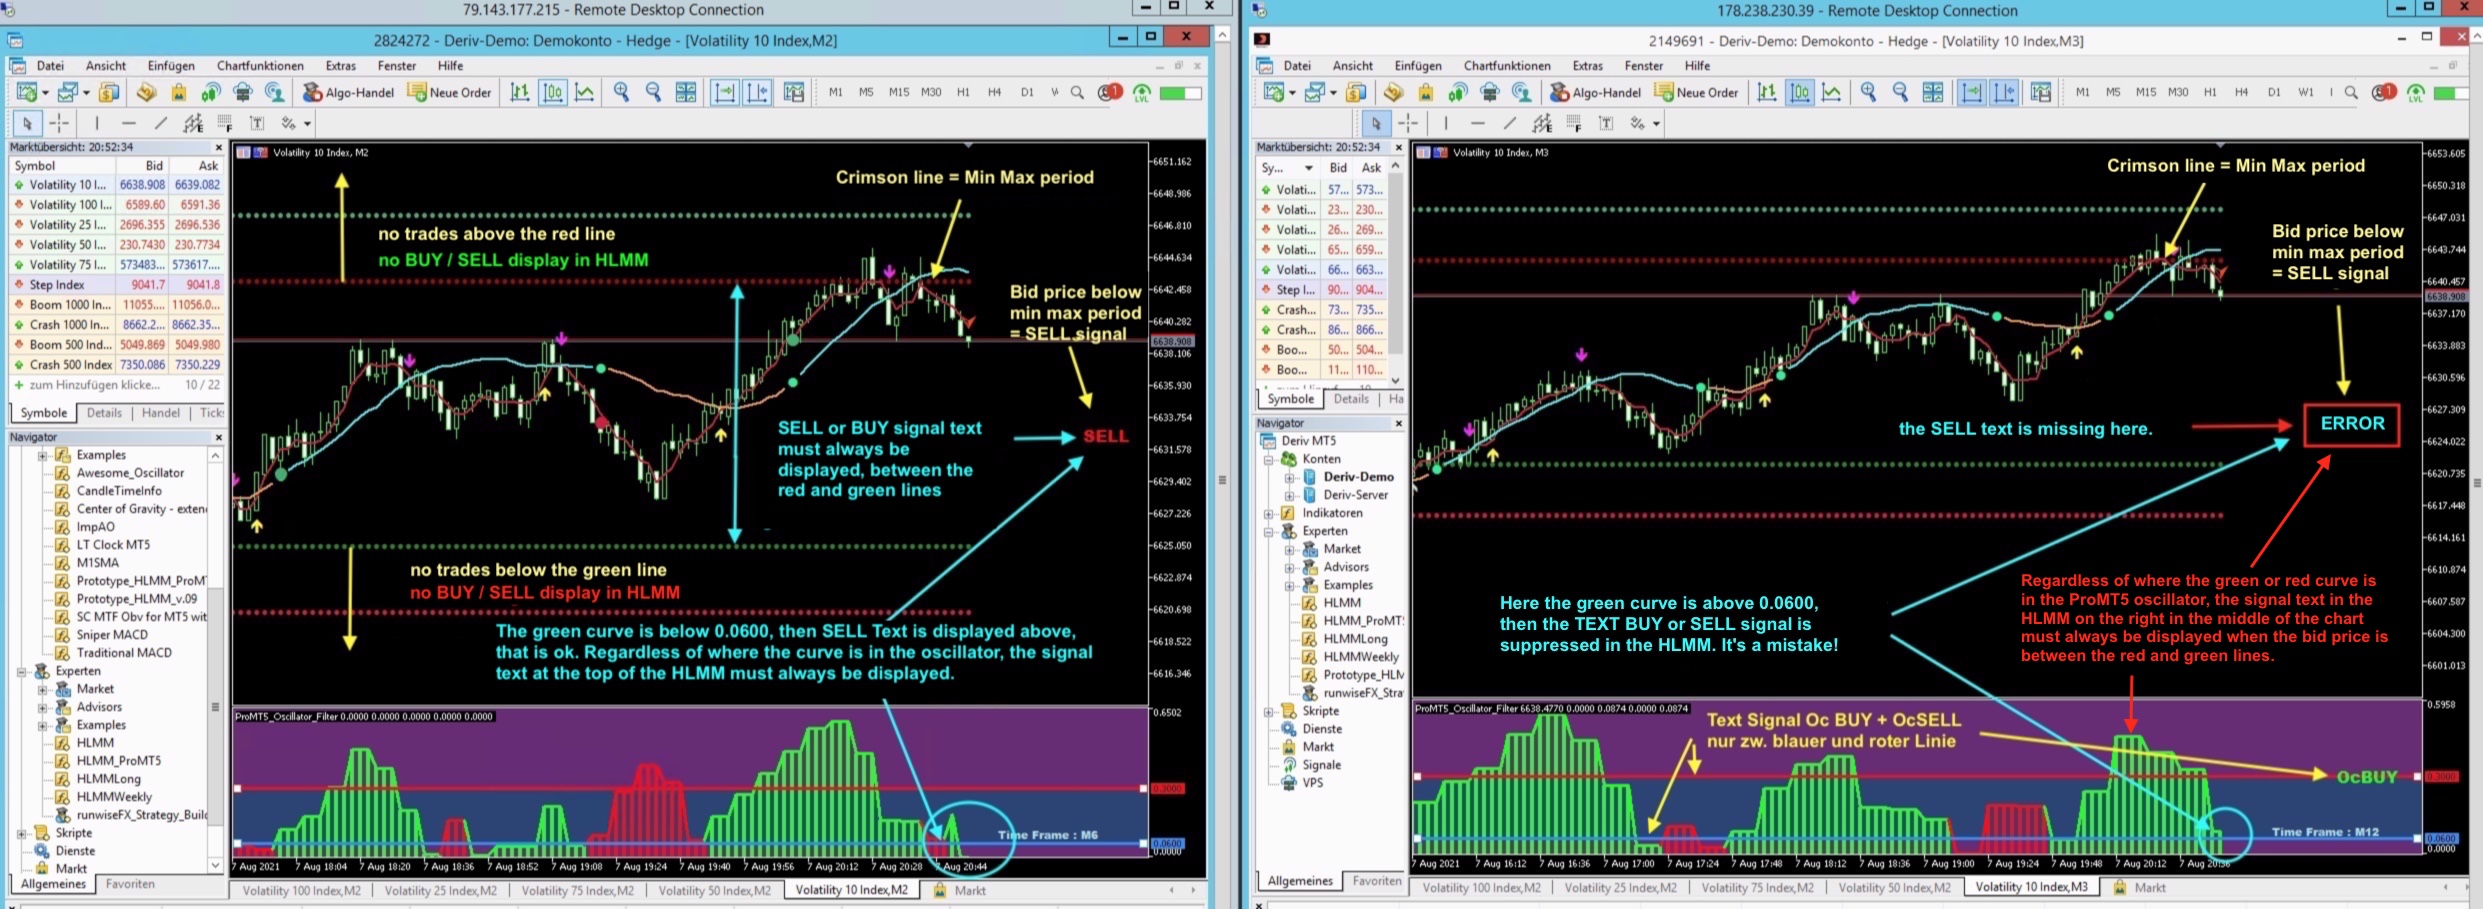
Missing signal text BUY: See figure Missing Text
If the red or green hatched line is above the red horizontal line (0.600) in the oscillator, the buy / sell text is suppressed in the main chart.
There must still be a reference to the main chart or the "HLMM" indicator in "HLMM_ProMT5" or "HLMM". This problem has yet to be found and eliminated.
2. HLMM problem
Not all arrows are hidden: See illustration HLMM arrows
In the HLMM indicator, not all arrows are hidden if "Show Signal On Chart" is set to False in the setting. The arrows from "Min Max cross Chameleon Entry?" are not hidden.
For this, the text signals BUY / SELL are also hidden. This is wrong.
3. HLMM and HLMM_ProMT5
Important:
If "Show Signal on Chart" is set to false in the settings,
the text BUY / SELL or OcBUY / OcSELL must always be displayed in both indicators, only the arrows should be hidden.
4. HLMM_ProMT5
The oscillator should update itself every minute, otherwise text signals will be lost or the chart will not be displayed correctly at all.
In the chart (see picture HLMM_ProMT5) you can see, if a higher candle time (10 minutes) is set than in the main chart (2 minutes), that the chart curve is only updated again after 8 minutes.