Am looking for a bot to trade .so that I can be able to trade and become very successful and make some profit so that I cannot sleep on a empty stomach
Hello Traders and Investors, I am a professional algorithmic trading developer specialized in building high-quality Expert Advisors (EAs), Indicators, Scripts, and Trade Management Tools for MetaTrader 4 and MetaTrader 5. With extensive experience in financial markets and trading automation, I can transform your trading ideas into reliable and efficient solutions with clean, optimized, and well-structured code. My
Привіт. Шукаю когось, хто б застосував мій код як бота . Я торгую індексом Aus_200 SFE (не XJO). Бот базується на MACD входу/виходу, RSI, стохастиці та vwap. Як тільки роботу приймуть, мені потрібно внести кілька коректив; однак, нічого суттєвого. Дякую
Hello everybody, I'm looking for an experienced MQL4/MQL5 developer to optimize a High-Frequency Trading (HFT) Expert Advisor for both MT4 and MT5. The EA performs consistently and profitably on demo accounts, but when it is run on Raw and Standard live accounts under what appear to be the same trading conditions, it begins generating losses. I do not have the original source code (.mq4/.mq5); I only have the
I have a High-Frequency Trading (HFT) Expert Advisor for both MT4 and MT5 designed primarily for US30 (Dow Jones Index) . The EA performs consistently and profitably on demo accounts, but when I run it on an IC Markets Raw or Standard live account, it starts generating losses under what appear to be the same trading conditions. At this time, I cannot provide the source code (.mq4/.mq5). I can only provide the
I am looking for an experienced MQL5 developer to build a high-frequency (HFT) latency arbitrage Expert Advisor for Pepperstone MT5 , using LMAX as the leading price feed. The initial focus will be on US30 (Dow Jones) , and if the strategy proves successful, I want the EA to be easily expandable to additional symbols such as NAS100, GER40, XAUUSD, major forex pairs, and other supported instruments. The EA should
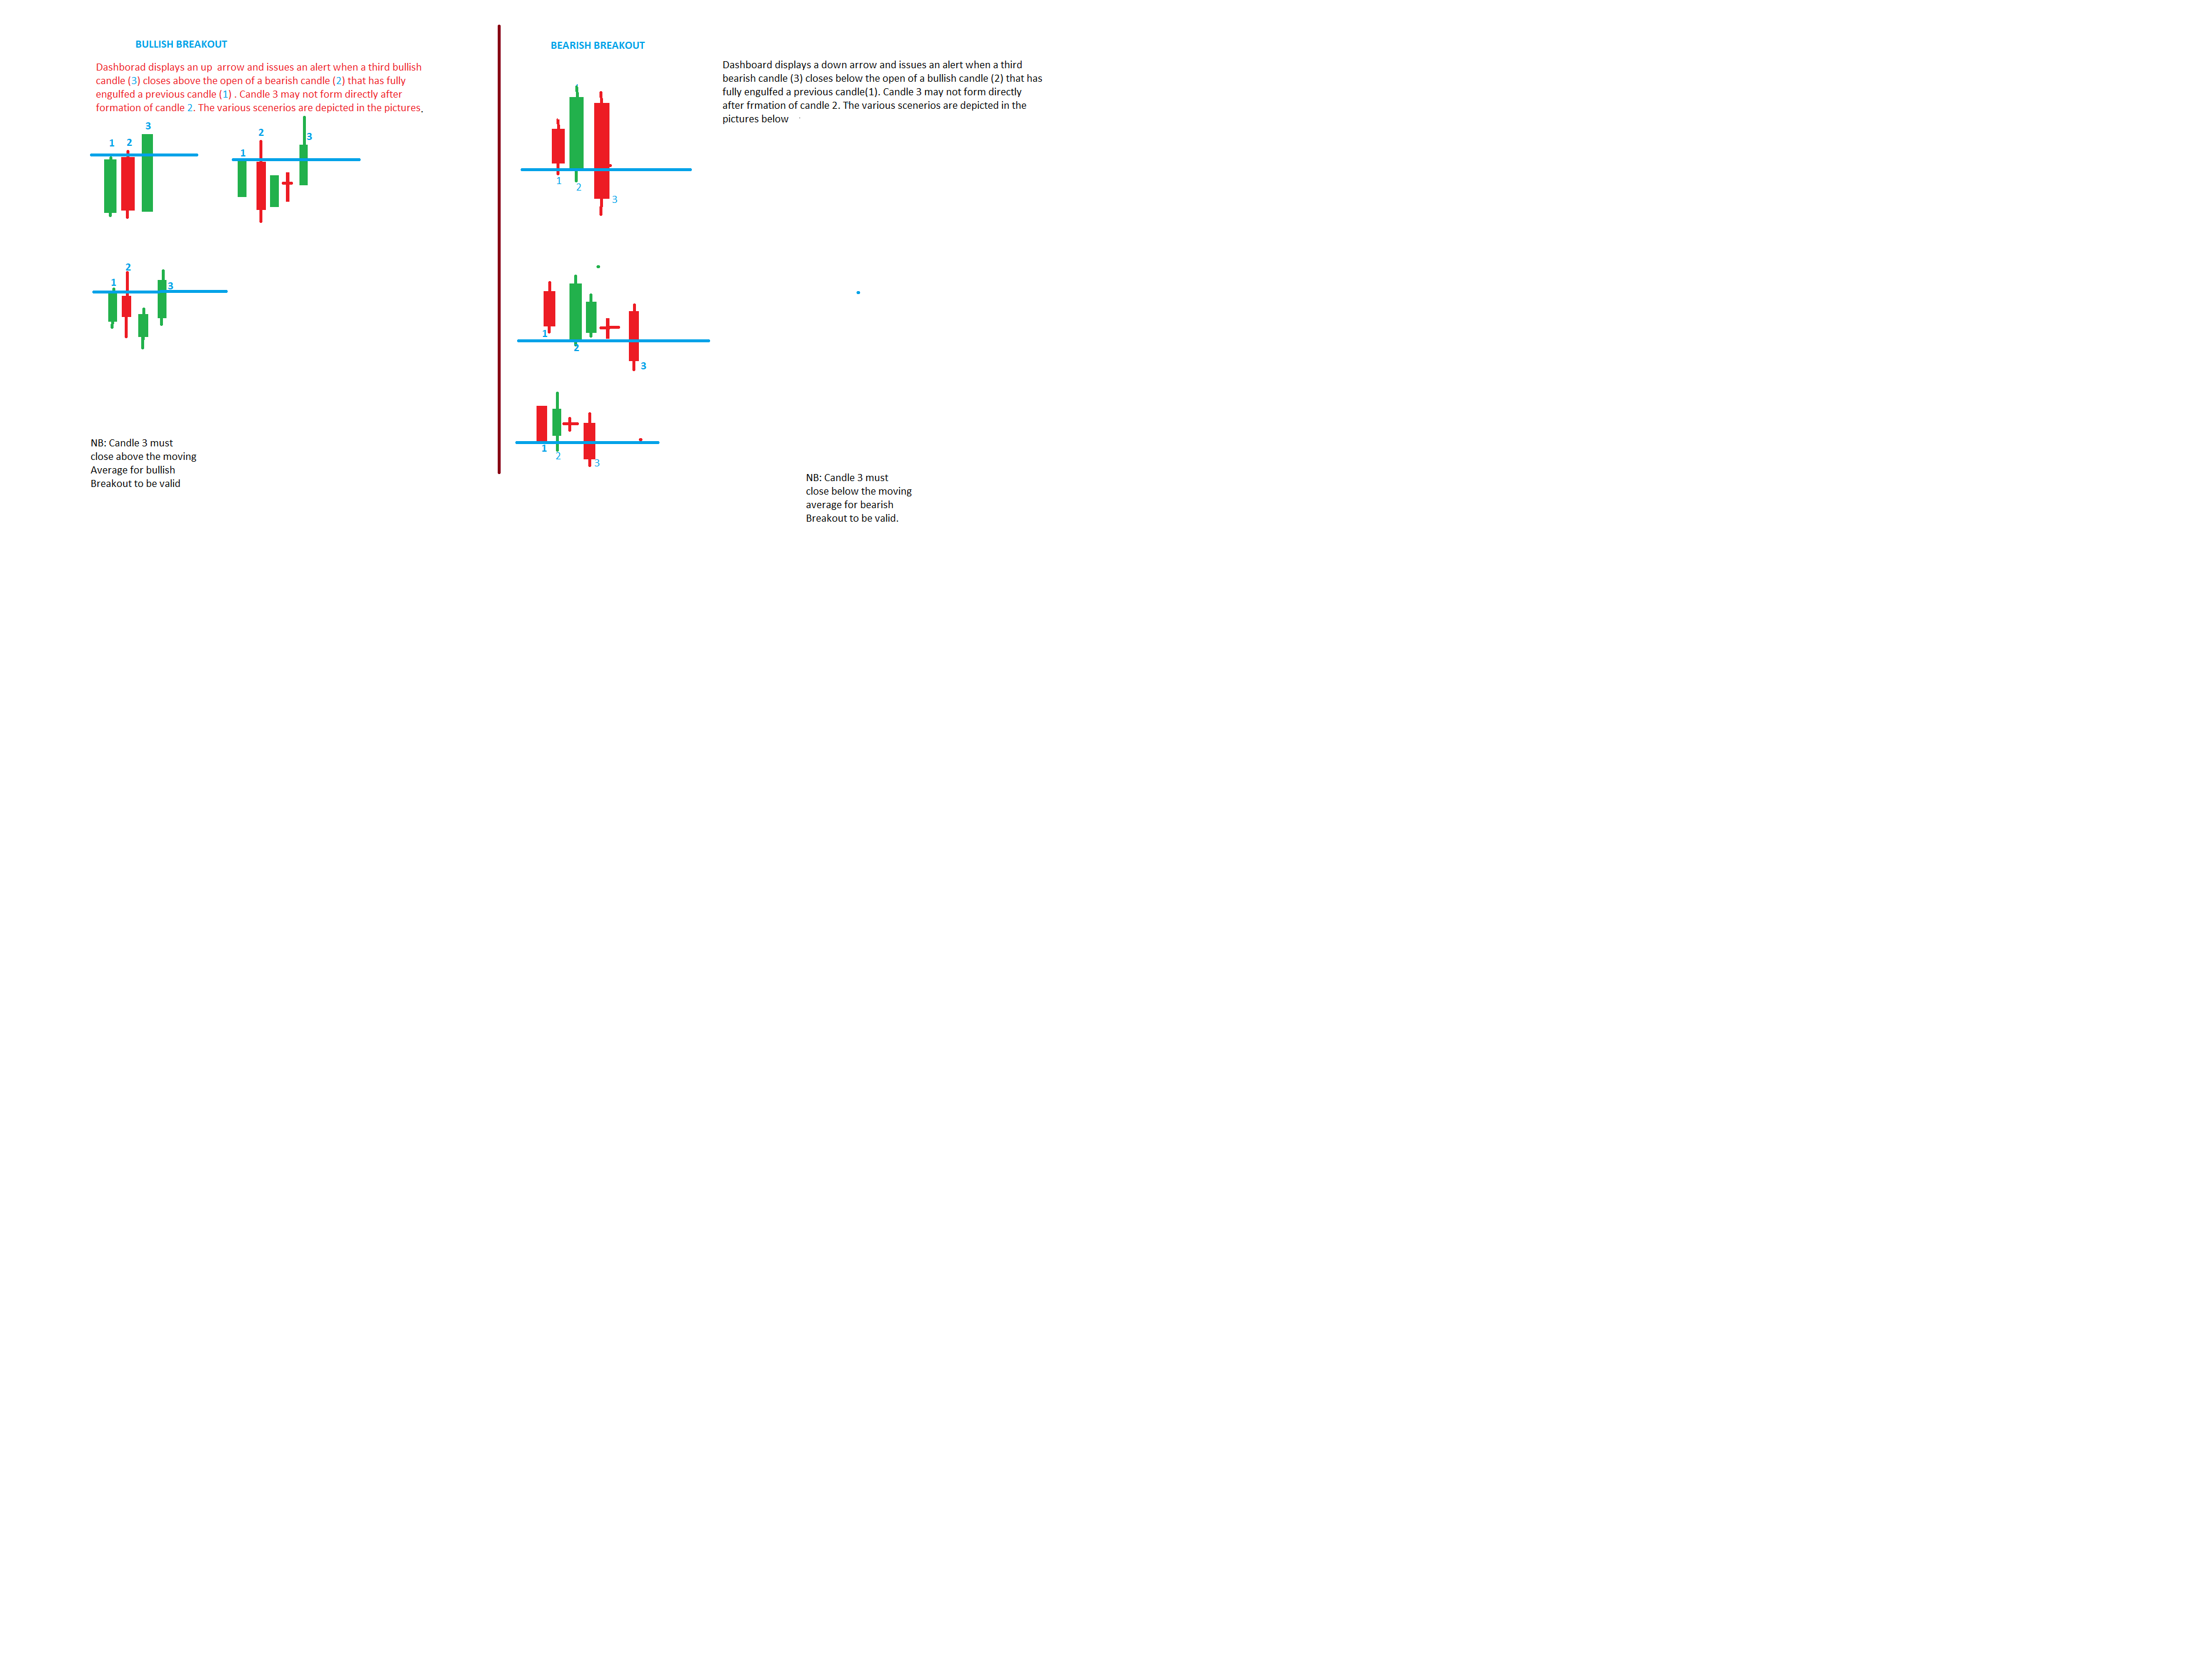
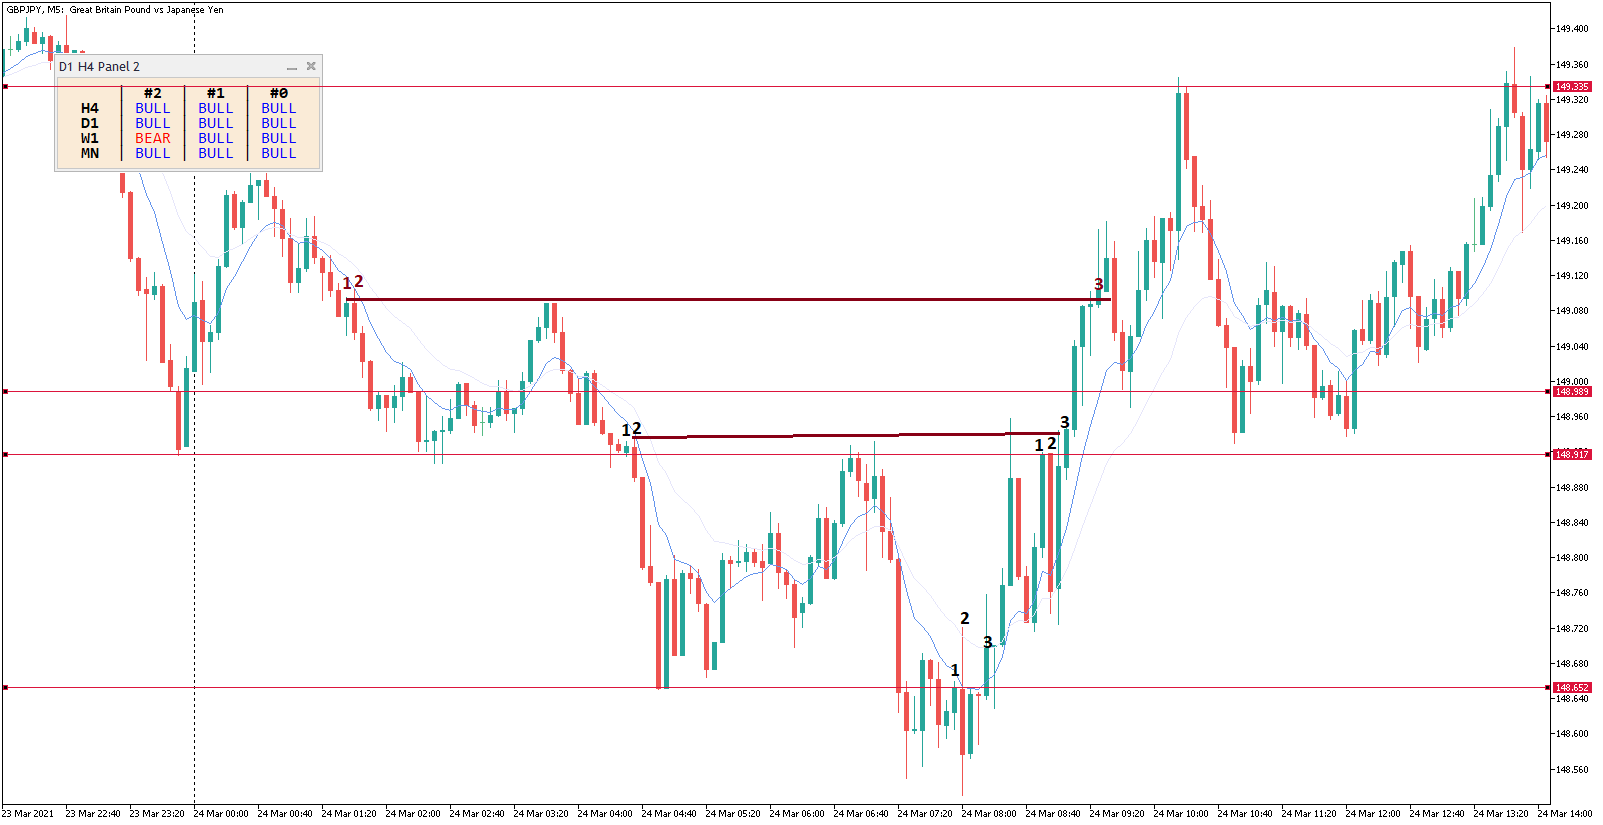
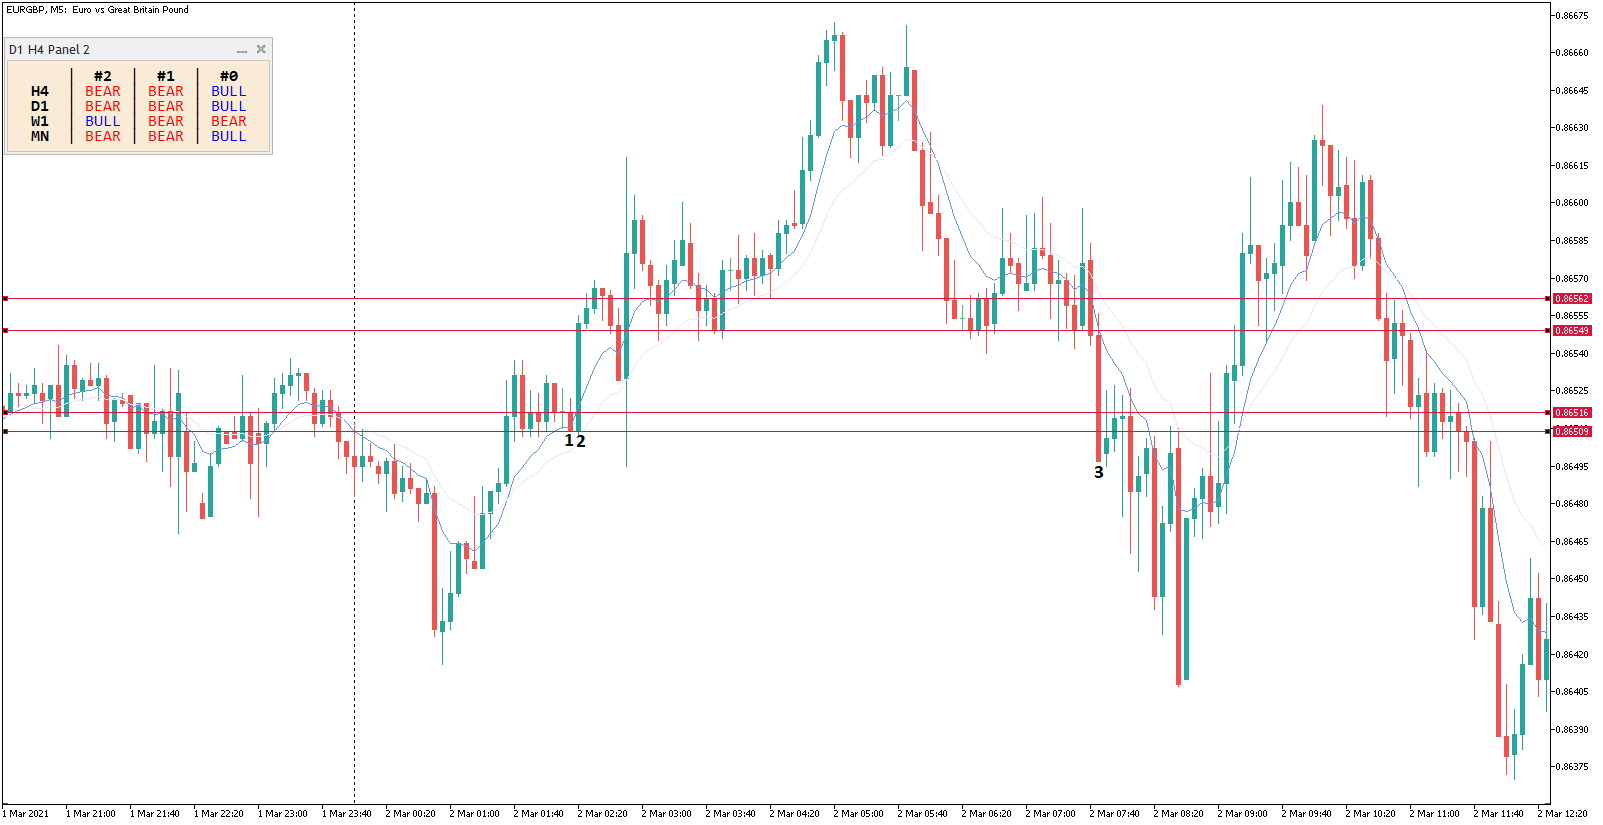
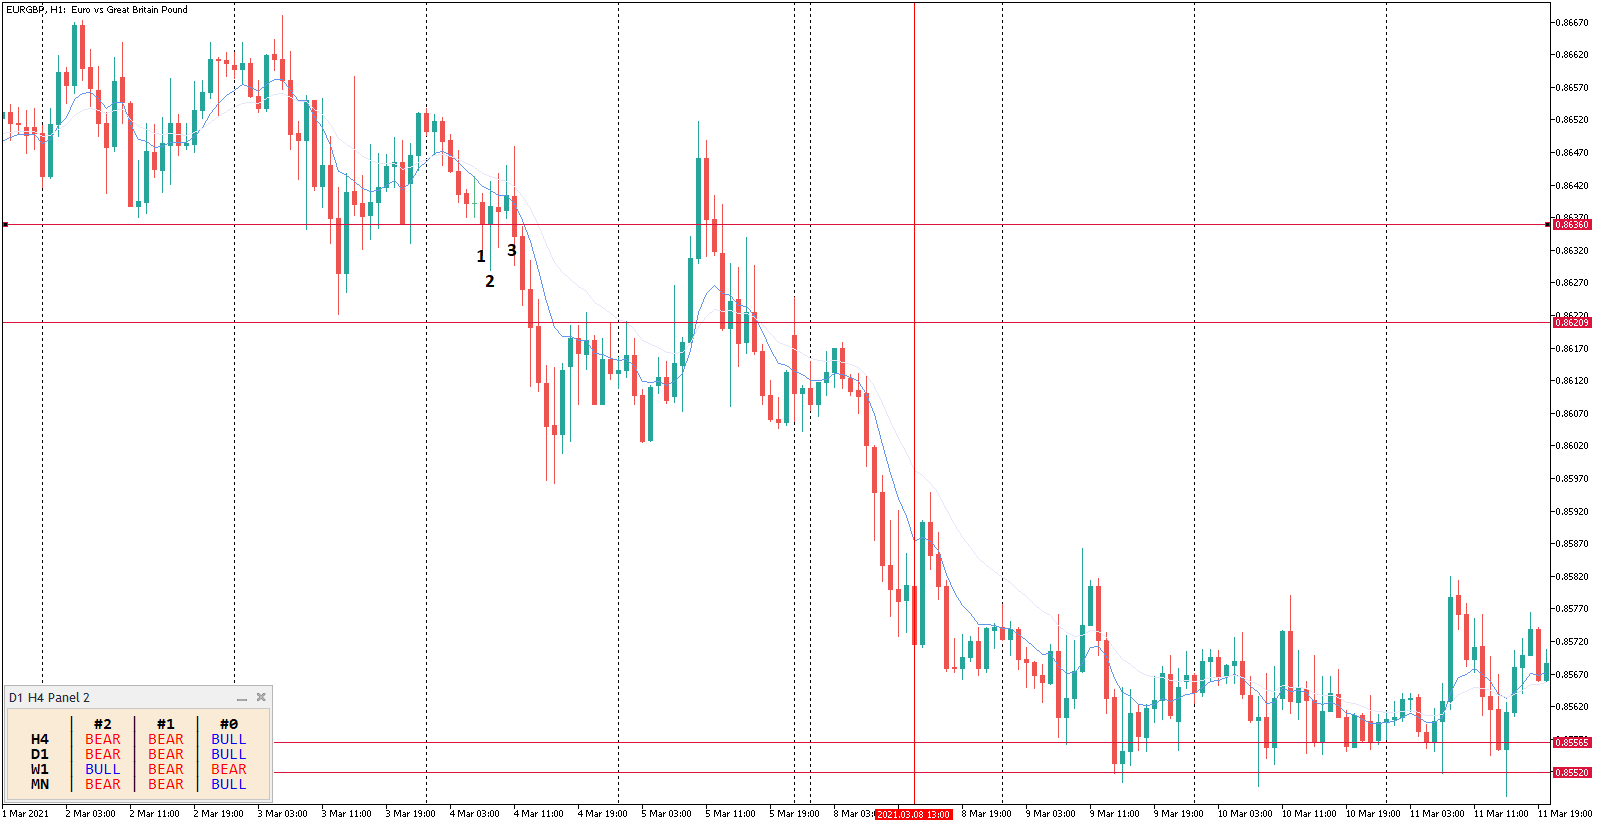
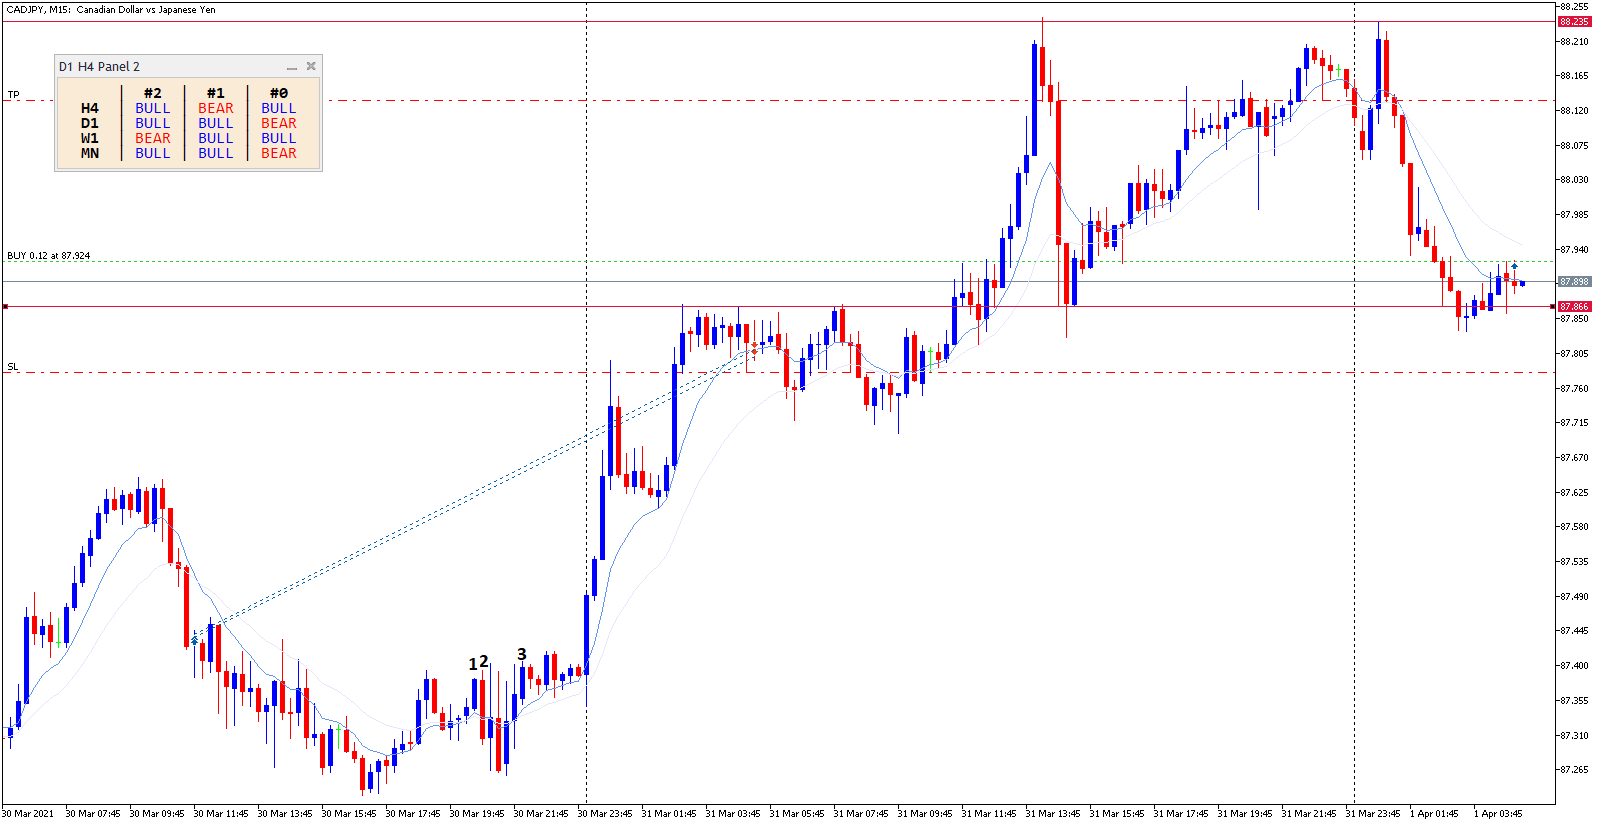
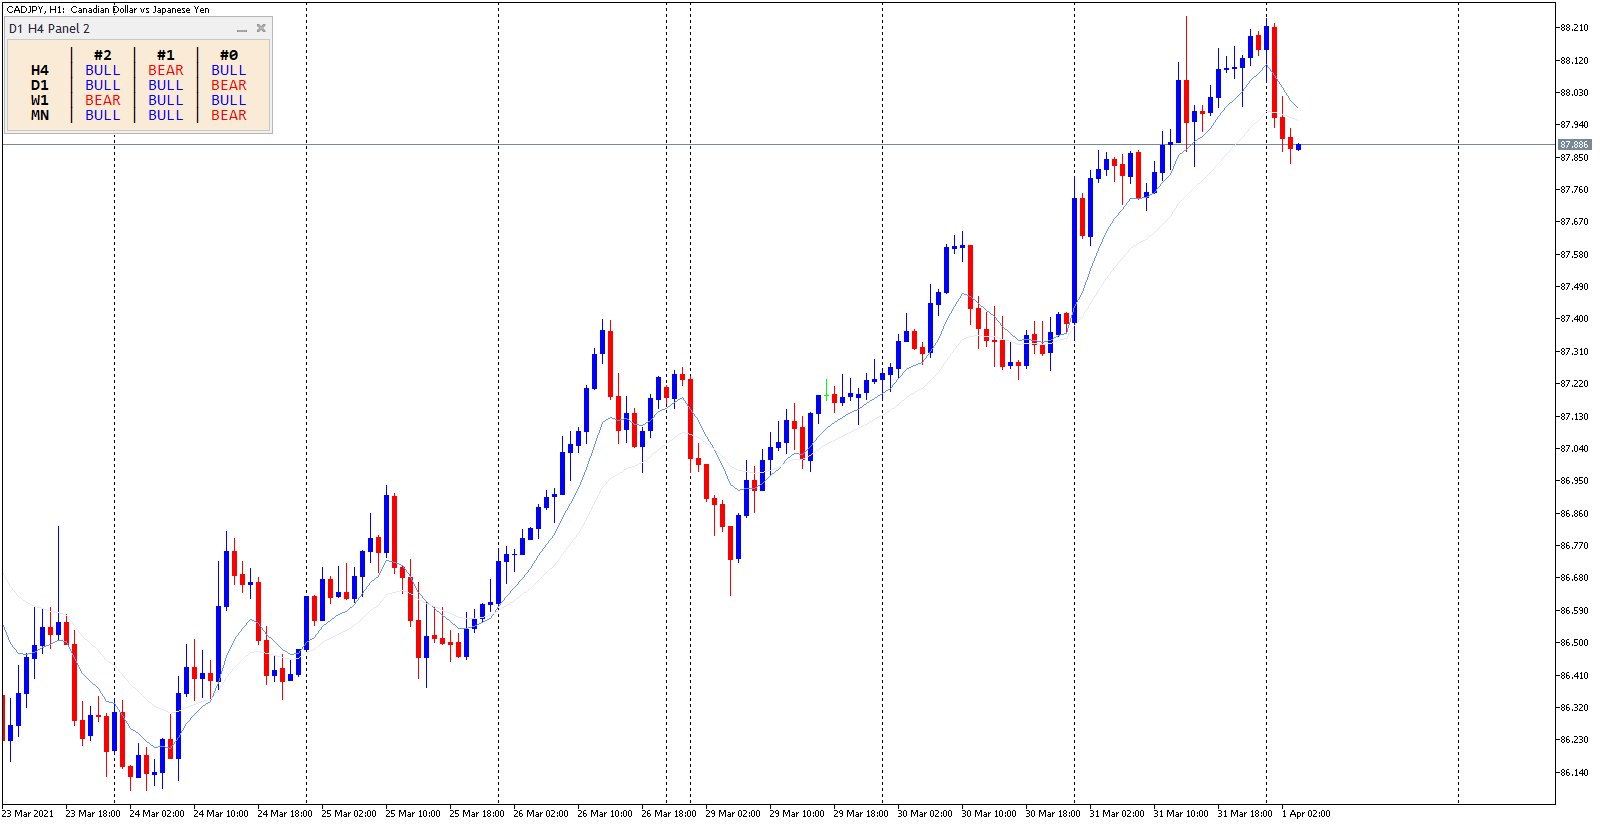
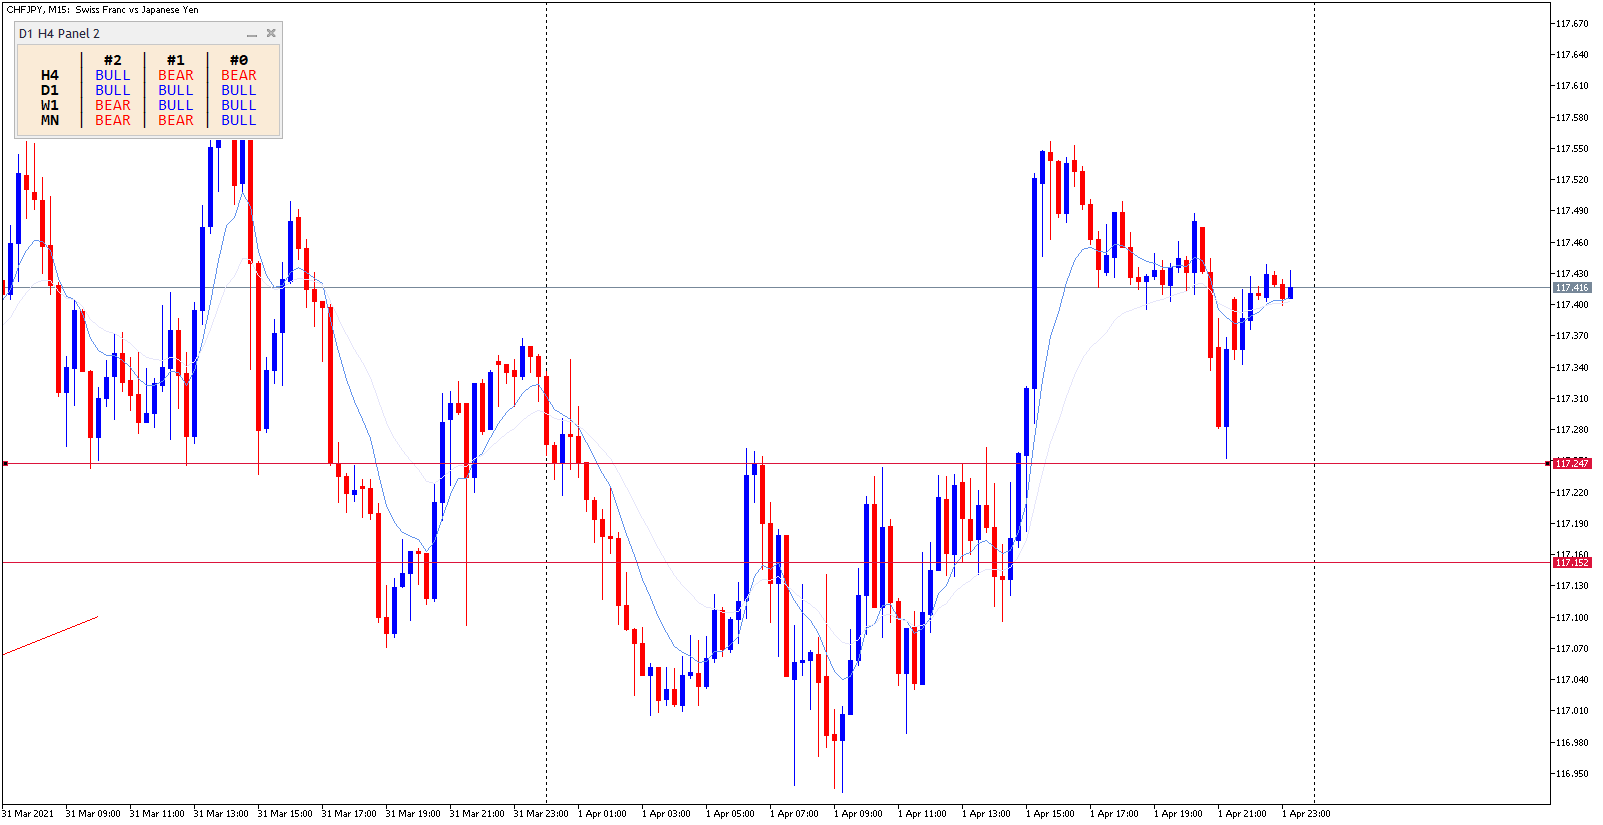
QUIERO CONSEGUIR EL CODIGO FUENTE DE ESTE INDICADOR QUE ME GUSTA MUCHO TAMBIEN TIENE EL NOMBRE DE ET BANDS O ENTRY EXIT TIMING . no se los componentes pero estas son las imagenes. que mejor lo describen
Hello Developers, I want to build a custom Expert Advisor (EA) for MetaTrader 5 (MT5) to trade Gold (XAUUSD) and Bitcoin (BTCUSD). This will be based on my own custom strategy. Here are the project requirements: 1. Platform: MetaTrader 5 (MQL5) 2. Trading Assets: Gold (XAUUSD) and Bitcoin (BTCUSD) 3. Timeframe: Suitable for multi-timeframe execution (I will specify the exact timeframes in private chat) 4. Core
Standby Description . Prop Firm Environment . ( Monitor Execution and Handling Environment Changes as Required ) . Technical Issues . Delete extra lines of code (Clean Code , Folder) . Asset related translation , no need for Logic Alteration
Act as a professional Quantitative Developer and Risk Manager. I want to build a systematic trading strategy rulebook that prioritizes capital preservation and statistical edge over raw performance. Please generate a structured trading strategy using the following framework: 1. ASSET CLASS & TIMEFRAME: - Asset: [e.g., Apple (AAPL), Bitcoin (BTC), or EUR/USD] - Timeframe: [e.g., 5-minute, 1-hour, Daily] 2. CORE