Suleiman Alhawamdah / Profile
- Information
|
8+ years
experience
|
11
products
|
115
demo versions
|
|
0
jobs
|
0
signals
|
0
subscribers
|
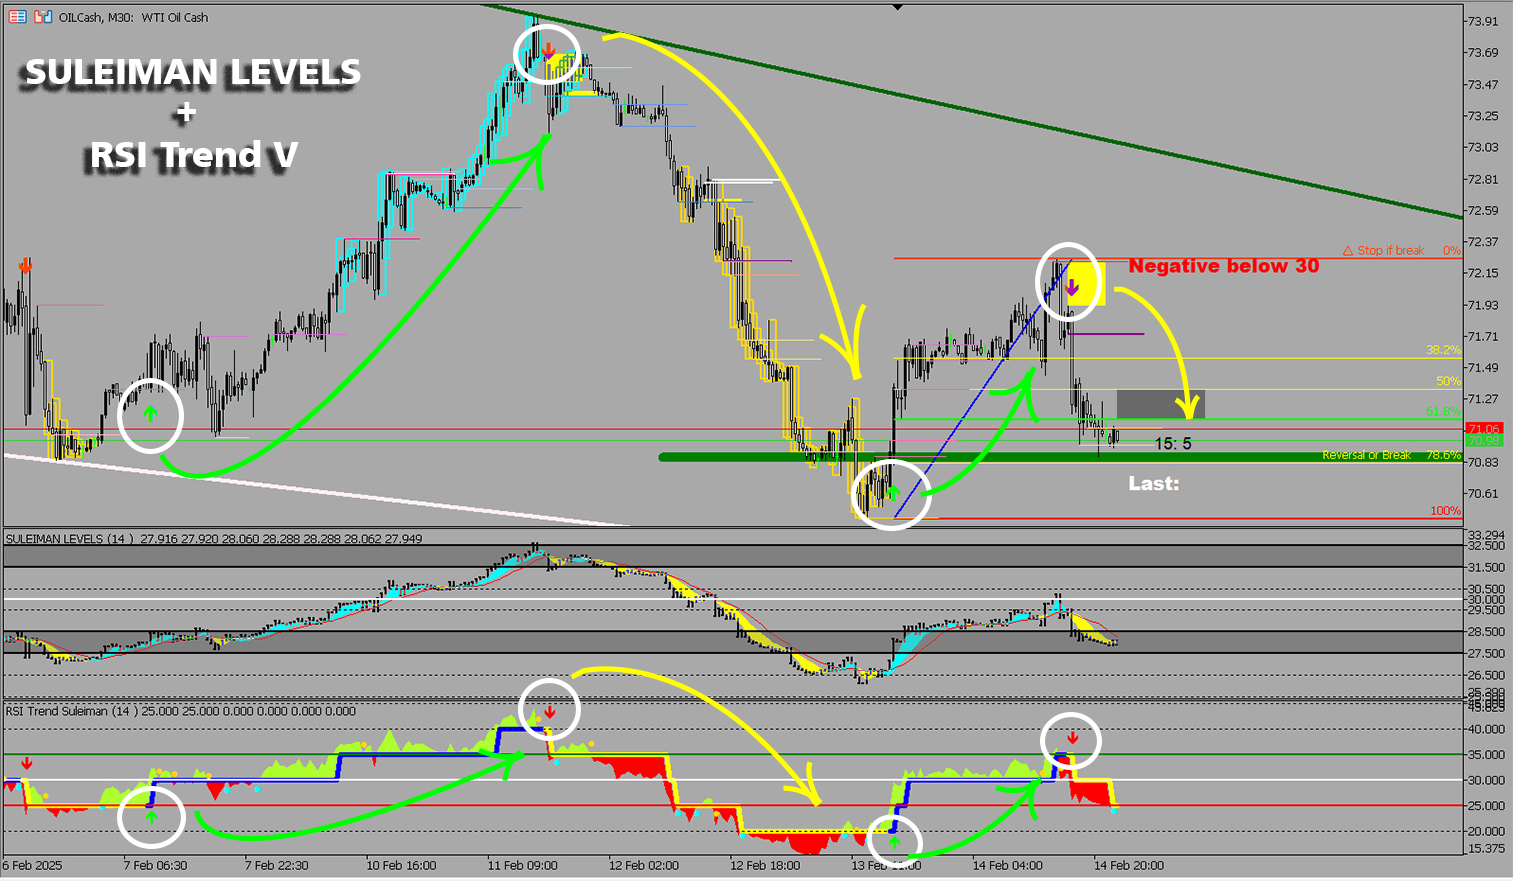
Special price for a limited number of days. "RSI Trend V" Indicator is designed for trend identification and is integrated with Fibonacci to determine target zones and potential reversals. It includes bullish and bearish arrows that appear in potential price movement reversal areas. However, the key elements to focus on are: -Thick blue line - Uptrend -Thick yellow line - Downtrend -Green cloud above the thick green line -Red cloud below the thick yellow line -Bullish and bearish arrows
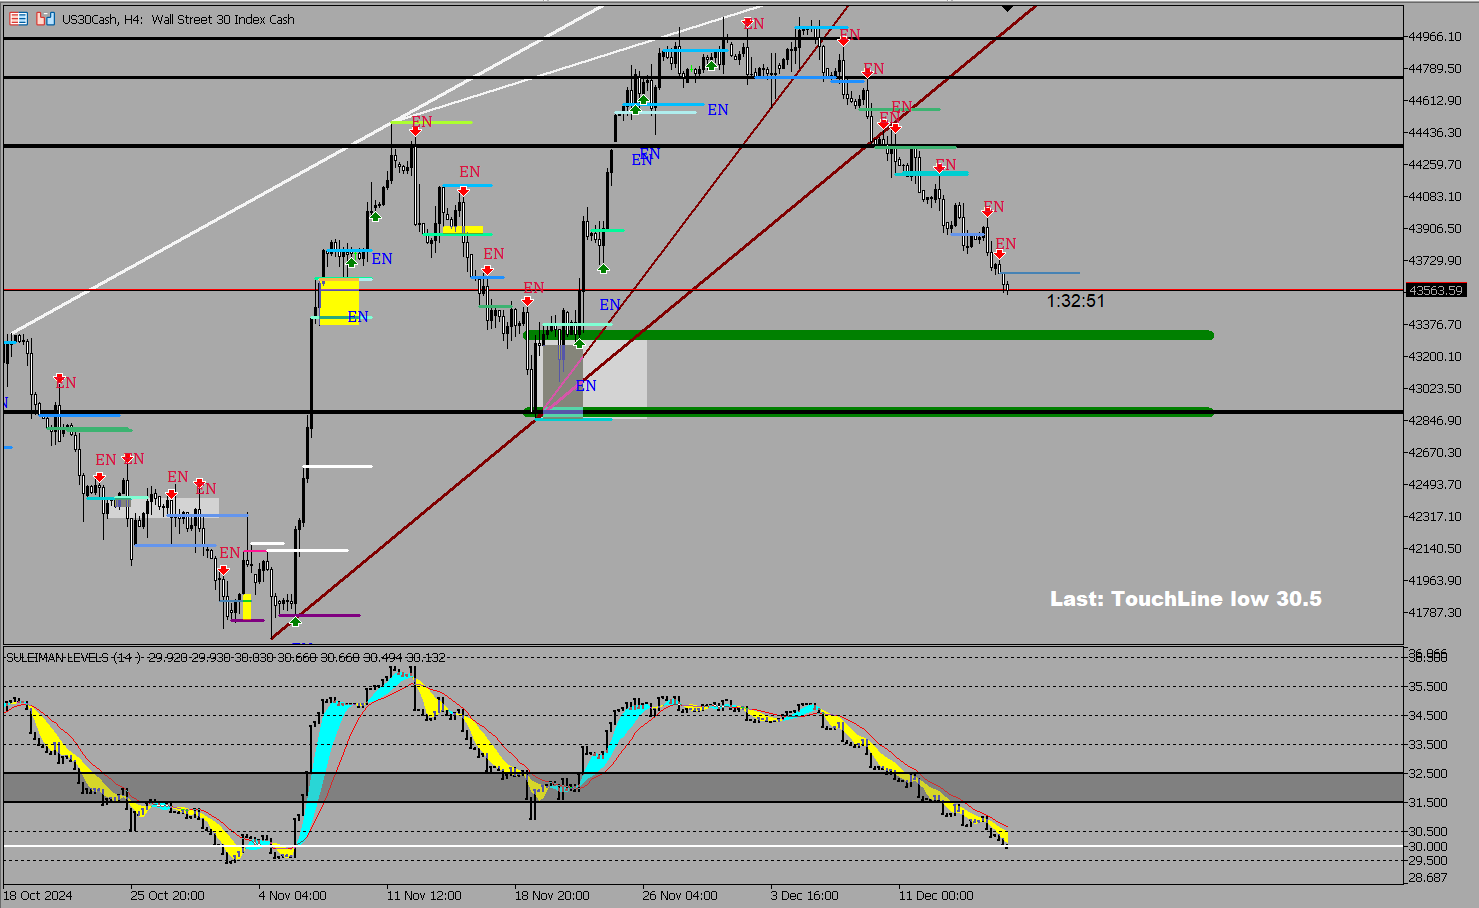
What’s even more impressive about the engulfing signals is the presence of the exclusive color-coded level lines and the advanced support and resistance lines unique to this indicator. These act as valuable warnings, helping you identify engulfing candles that may appear at the end of an upward or downward trend momentum.
before explaining Time Candle Suleiman: recommended tested this important and very useful indicator: https://www.mql5.com/en/market/product/183859 Note: The image shown in Screenshots is of my 2 indicators, first one with Shock Pullback V 3.3 indicator , and other for Suleiman Levels and RSI Trend V indicator, including of course attached "Time Candle", which is originally part of the comprehensive indicator for advanced analysis and exclusive levels - Discovered
Note before explaining the indicator: try and test Shock Pullback v 4.0 : https://www.mql5.com/en/market/product/145042 and recommended tested this important and very useful indicator: https://www.mql5.com/en/market/product/183859 ///////////////////////////////////////////// Important Note: The image shown in the screenshots includes two indicators: the “Suleiman Levels” indicator and the “RSI Trend V” indicator. NEW UPDATE v 7.9: A remarkable and special update for