SASA MIJIN / Profile
- Information
|
6+ years
experience
|
8
products
|
406
demo versions
|
|
0
jobs
|
0
signals
|
0
subscribers
|
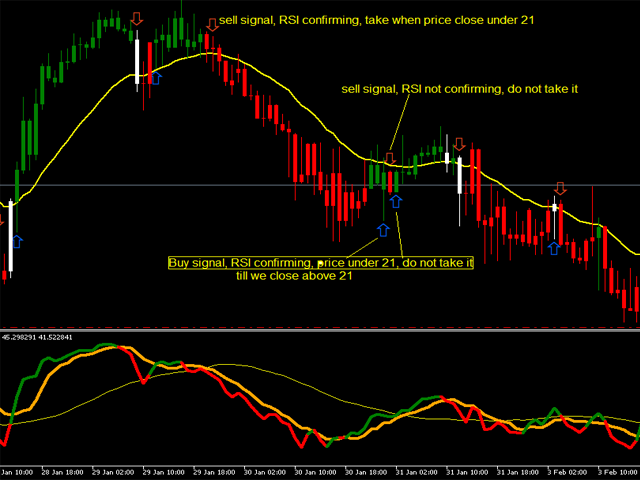
As you can see, we started:
A Buy signal on the left, stop loss was on a previous local low. We got 3 Profit Targets from it.
Sell signal that we got, was one that stooped us after 3 Profit Targets, took second position, stopped in loss.
Then we got buy signal took it, and we got one Profit Target out of it, stop was in break-even, so one profit target from that position
Then sell signal came, we took it on first close candle under 21 EMA, we got all 4 profit targets out of it.
Then you can see buy signal that was not played under 21 EMA
Then sell signal that was not played because of RSI
Then buy signal came , took it after first close above 21 EMA, one Profit Target, Stop Loss on Break Even
Then buy signal came, stopped out in loss
Then sell signal came with 3 Profit targets
Hope this make some clarity how to use it, and whats the best strategy I found for it, if you make it work on another way, do it, in your own, why not. If there is more questions, feel free to ask, I will help any way I can.

Expert Market Edge is scalping, trending, reversal indicator, with alerts . You can use it all and fit with your strategy whatever it fits you. My recommendation is to combine with my Colored RSI , and when 2 signals are matched, and pointing same direction (for example buy on this indicator, and green on RSI, you can take a long position, stop loss should be last local low, if you want to be more conservative, add ATR. ) you can take position. If you using moving averages, that's even
Expert Market Edge is scalping, trending, reversal indicator, with alerts . You can use it all and fit with your strategy whatever it fits you. My recommendation is to combine with my Colored RSI , and when 2 signals are matched, and pointing same direction (for example buy on this indicator, and green on RSI, you can take a long position, stop loss should be last local low, if you want to be more conservative, add ATR. ) you can take position. If you using moving averages, that's even
https://www.mql5.com/en/market/product/46049
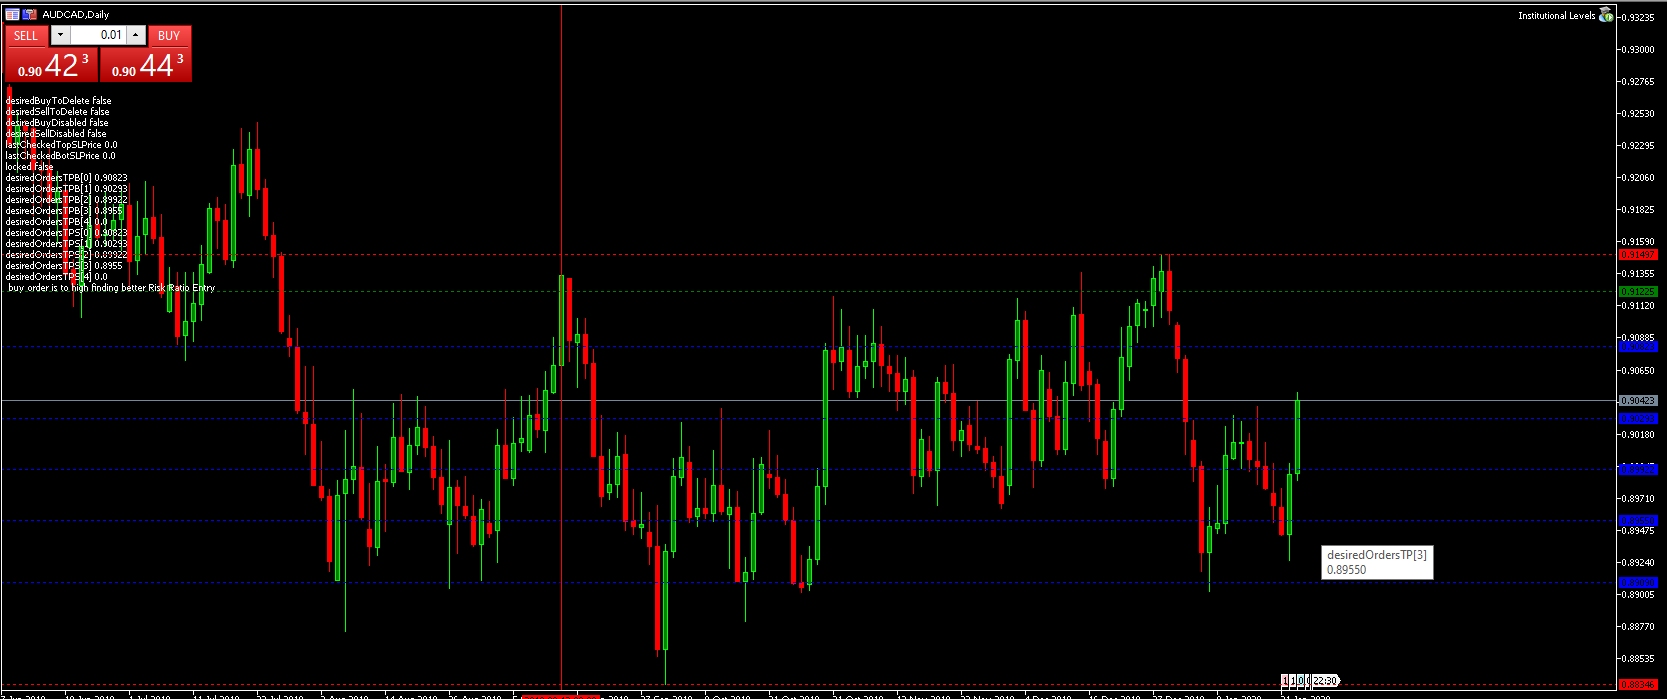
Institutional Levels is an intelligent, fully automated Expert Advisor. This algo is arranged in such a way that the EA uses levels of importance combined with price action, without reliance on indicators. The strategy behind it is based on the teachings of a professional traders, and ex traders. It will find untested levels at which institutions are known to be interested in, in the number of candles you’ve set and will make trades based on these levels, re-test and trend. It will
This is Heiken Ashi smoothed version, where you can choose on what type smoothness you want to make your strategy base. You can choose between EMA or MA, on the period you want. And you can choose colors. Definition: The Heikin-Ashi technique averages price data to create a Japanese candlestick chart that filters out market noise. Heikin-Ashi charts, developed by Munehisa Homma in the 1700s, share some characteristics with standard candlestick charts but differ based on the values used to
This is Colored RSI Scalper Free MT5 -is a professional indicator based on the popular Relative Strength Index (RSI) indicator with Moving Average and you can use it in Forex, Crypto, Traditional, Indices, Commodities. Colors are made to make trend, and changing trend more easily. Back test it, and find what works best for you. This product is an oscillator with dynamic overbought and oversold levels, while in the standard RSI, these levels are static and do not change. This
This is Colored RSI Scalper Free MT5 -is a professional indicator based on the popular Relative Strength Index (RSI) indicator with Moving Average and you can use it in Forex, Crypto, Traditional, Indices, Commodities. Colors are made to make trend, and changing trend more easily. Back test it, and find what works best for you. This product is an oscillator with dynamic overbought and oversold levels, while in the standard RSI, these levels are static and do not change. This
It will be able to teach ppl, in the end, to trade :slight_smile:

This is Heiken Ashi smoothed version, where you can choose on what type smoothness you want to make your strategy base. You can choose between EMA or MA, on the period you want. And you can choose colors. Definition: The Heikin-Ashi technique averages price data to create a Japanese candlestick chart that filters out market noise. Heikin-Ashi charts, developed by Munehisa Homma in the 1700s, share some characteristics with standard candlestick charts but differ based on the values used to
t will take some long, will see. For now, this is all it offers.

Institutional Levels is an intelligent, fully automated Expert Advisor. This algo is arranged in such a way that the EA uses levels of importance combined with price action, without reliance on indicators. The strategy behind it is based on the teachings of a professional traders, and ex traders. It will find untested levels at which institutions are known to be interested in, in the number of candles you’ve set and will make trades based on these levels, re-test and trend. It will


