Jeremy Mitting / Seller
Published products

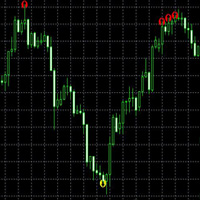
The Breaking Highs and Lows Indicator finds areas of support and resistance based on past trending activity. It uses an algorithm to compare jumps in the periods of highest highs and lowest lows. It compares the current period with the prior period to see if there is a significant jump in periods that it has been the highest high or the lowest low for. For instance, if the current period has been the highest high for 100 days, where the prior period was the highest high for 5 days, this would be

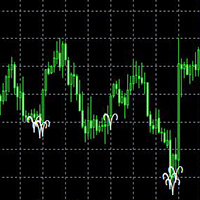
This indicator averages the last 5 bars (determined by the input parameter 'Average_Bars' defaulted at 5 which can be adjusted). Muliplies this average volume by the input parameter 'Multiply_Volume' (default 1.5), then compares this to the current volume bar. If there is a significant increase in the current volume, the indicator is flagged. This is to determine when the 'big players' buy/sell into the market, or if there's significant activity behind a price increase/decrease.

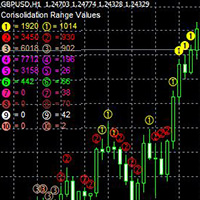
20 Consolidation ranges are derived using the current bid price, then adding/subtracting the input parameter from the bid price to get each consolidation range. For instance, the input parameter default is .01. If the current bid price is 1.09616 (EURUSD), then the upper limit for the first consolidation band is 1.10616 and the lower limit is 1.08616. 10 consolidation bands are above the bid price and 10 are below. Closed prices for each period are counted within each range and the totals are s