Mihail Matkovskij / Profile
- Information
|
10+ years
experience
|
14
products
|
569
demo versions
|
|
3
jobs
|
0
signals
|
0
subscribers
|
This indicator implements the well-known trend trading strategy for Stochastic, with two levels for purchases (40 and 80) and two levels for sales (60 and 20). When an upward movement begins, the oversold level rises, from 20 to 40. When there is a downward movement, the overbought level goes down, from 80 to 60. Thus, the strategy has 4 levels. Obviously, tracking signals using the usual 4-level Stochastic is not very convenient, therefore, this indicator illuminates the inputs and outputs with
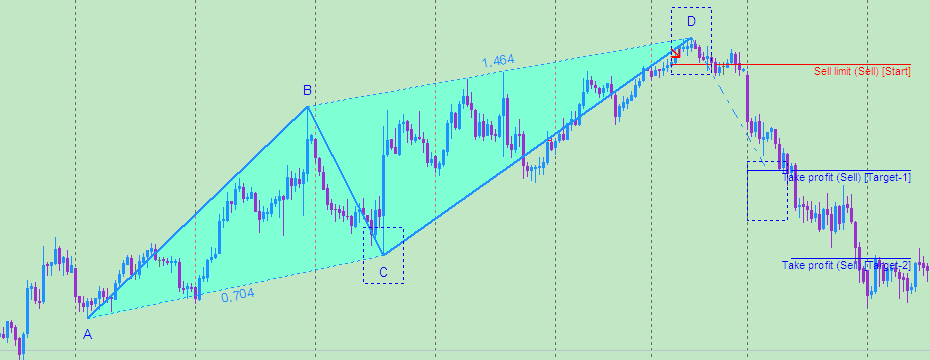
An example of trading on rollbacks according to the indicator Harmonic ABCD Universal: https://www.mql5.com/ru/blogs/post/658460. Video: https://youtu.be/YlsrNHaLCow

The indicator displays harmonic ABCD patterns, as well as the market entry points, which allows the trader to make trading decisions quickly. Harmonic ABCD Universal is one of the few indicators that predict price movement by determining pivot points with a rather high probability long before the pivot itself. It supports sending push and email notifications, as well as alerts. The indicator scans all possible combinations on the chart for the current moment, and also in history, with the help
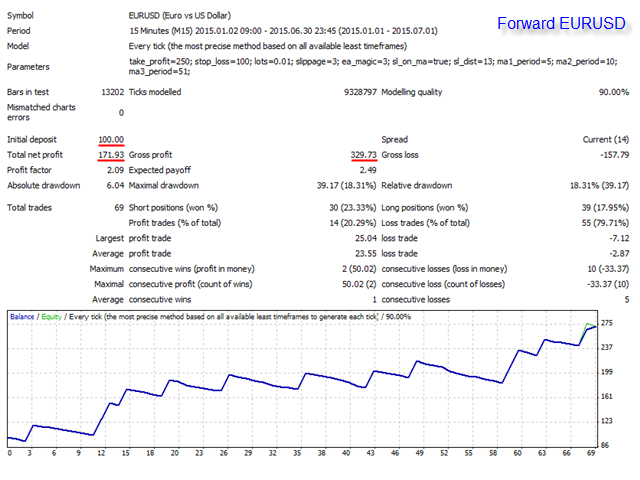
Optimization period: 2014 01 01 - 2015 01 01. Test: 2014 01 01 - 2015 01 01. Forward test: 2015 01 01 - 2015 07 01.
Forward test showed profits of over 170% for the half year, with a minimum deposit of $ 100!

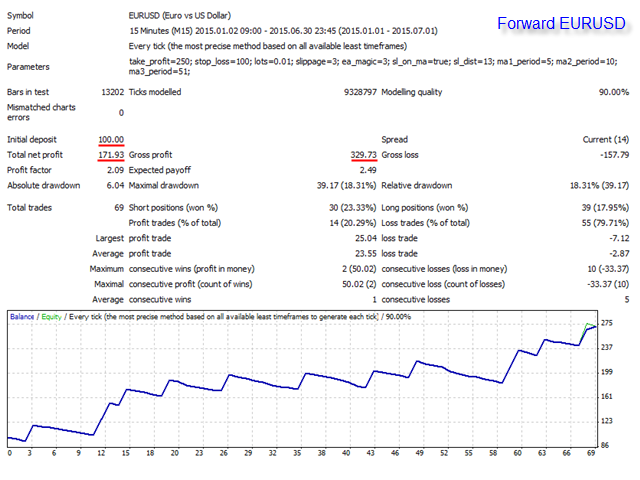
Период оптимизации: 2014 01 01 - 2015 01 01. Тест: 2014 01 01 - 2015 01 01. Форвард тест: 2015 01 01 - 2015 07 01.
Форвард тест показал прибыль, более 170%, за пол года, при минимальном депозите в 100$!

The EA allows a trader to place stop loss invisible for brokers and thereby prevent false breakthroughs and unwanted stop loss triggering. When you use standard stop loss, the price may break through stop loss before moving to the direction of an open order and therefore the orders is closed. Interactive Stop Loss removes standard stop loss of the open order and adds a horizontal line instead. After this it maintains the order until the line is crossed by the price. And then it finally closes
This is a forward-looking indicator for trading on all instruments. An advanced version of Bollinger Bands indicator created by outstanding analyst John Bollinger. One of the main differences of Super Bollinger Bands indicator from its predecessor consists in displaying upper and lower bands behavior on the middle line with some specific colors. Thus, the indicator gives a trader some visual information about trend development at the moment, and not in the past, as majority of other indicators
for which timeframe these Bollinger Bands are programmed and what timeframe do you recommend?
Thanks.
Best Regards,
Juergen


