Full Fractals MT5
- Indicators
- Sergey Ermolov
- Version: 1.2
- Updated: 2 May 2023
The Fractals Indicator is one of the elements of the author's trading strategy of Bill Williams. It is used to search for price reversal points on the price chart and, consequently, support and resistance levels.
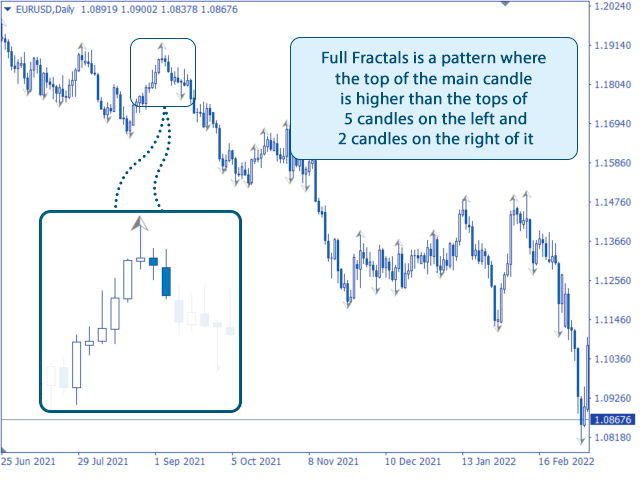
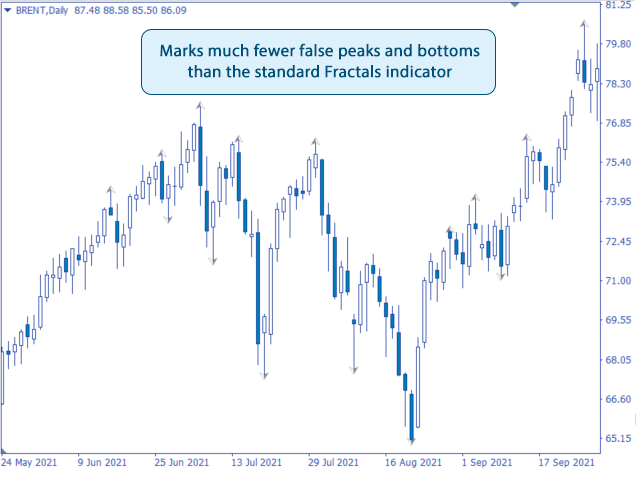
The Full Fractals Indicator is an improved Fractals which is available in the toolkit of almost all trading terminals. Its only difference is that to build a fractal we use 5 candles to the left and 2 to the right of the main candle (see Figure 1). In addition to the basic constructions, Full Fractals looks for levels where the price has stopped for some time.
The new Expert Advisor Prop Master - test it in your trading terminal
What the Full Fractals indicator shows.
- Fractals are displayed on the price chart as up and down arrows on a key candle. Based on these points you can freely build support and resistance levels.
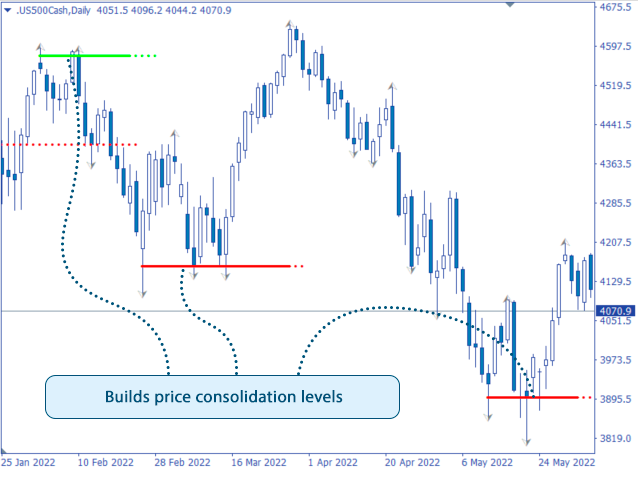
- The indicator draws levels on the chart in the place where there were several fractals approximately at the same level. These levels are strong levels that can be freely traded for a bounce or a breakout and retest of the same level (see Figure 3).
As in Bill Williams' strategy, the Full Fractals Indicator cannot be a full-fledged trading system but as a basis or in addition to other indicators you can develop a full-fledged trading strategy.
I recommend to use the indicator as part of the trading system Owl Smart Levels. The trading system includes the basic principles of trading on a global trend and 3 simple indicators that have been tested for a century.
- Have a look at the weekly trade reviews by clicking on the link >>
The indicator is equally well applicable both in the Forex market and in the stock market. Moreover, it works perfectly on commodity markets and indices. Even in a fairly young cryptocurrency market the indicator honors itself perfectly and gives a clear understanding of the market phase.
Full Fractals Indicator settings.- Candles on the left - determines the number of bars on the left to build a fractal
- Candles on the right - determines the number of bars on the right to build a fractal
- Support and resistance levels - enable the display of support and resistance lines on the chart
- Continuation of lines (bars) – the number of candles by how much to extend the lines to the right of the extreme fractal
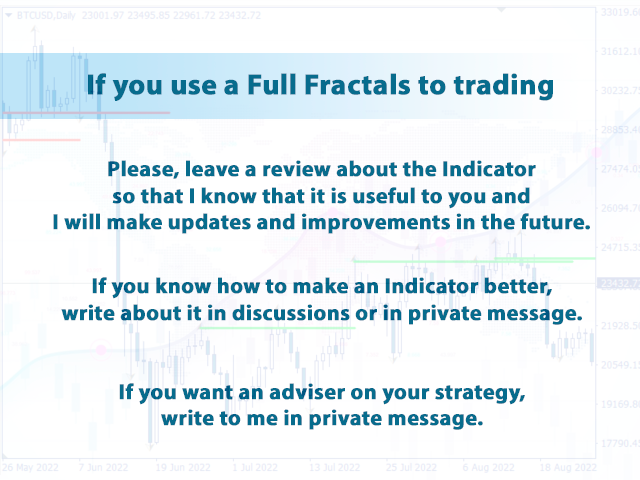
Download and use the Full Fractals Indicator for free! I hope it will bring you a good profit in the market and you, in gratitude for this, leave a positive review and share your results in the comments.
I'm Sergei Ermolov, follow me for updates!


cool