Algorex Combo Lab MT4

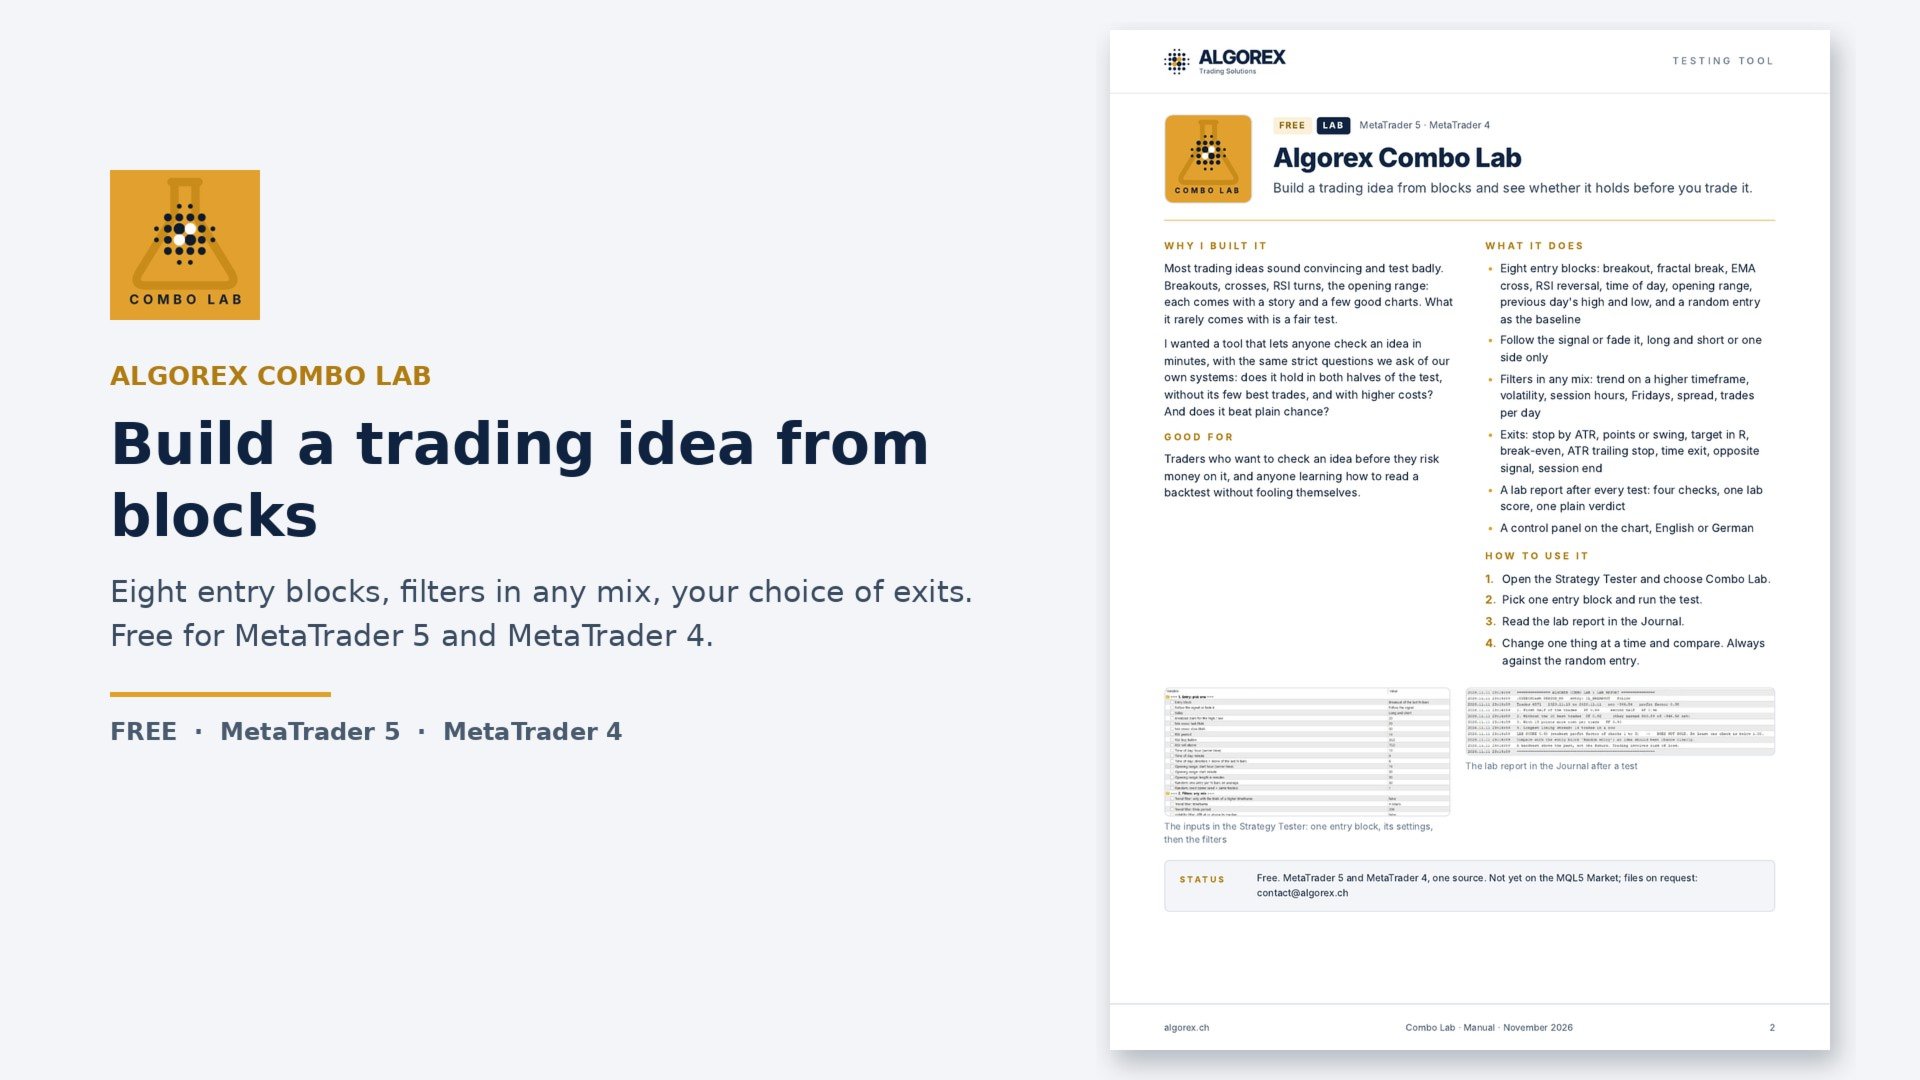
Every trading idea sounds convincing. The question is whether it holds. Algorex Combo Lab lets you try an idea in minutes and keep refining it, with the same strict questions we ask of our own systems: does it hold in both halves of the test, without its few best trades, and with higher costs? And does it beat plain chance?

Combo Lab is a free laboratory for the Strategy Tester. Pick one entry block, switch on any mix of filters, choose your exits, run the test and read the lab report.

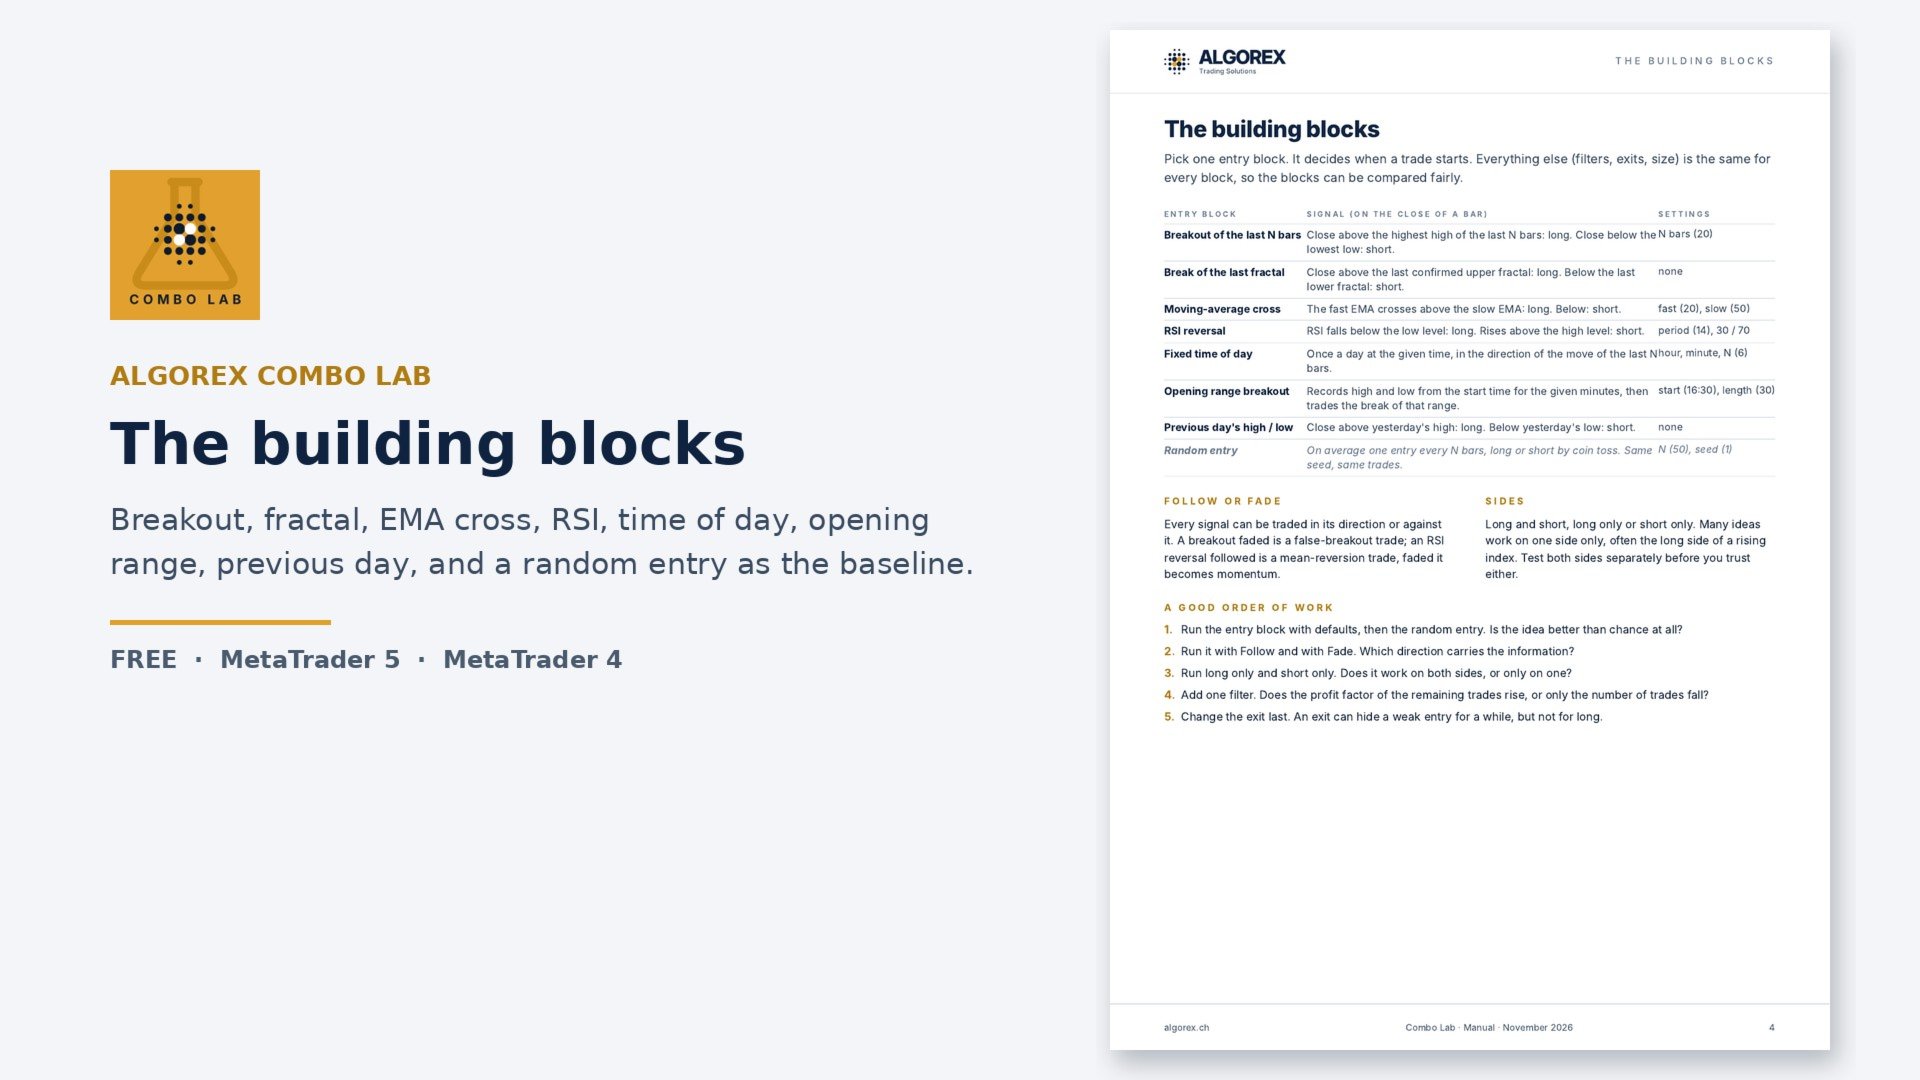
Entry blocks (pick one)

  • Breakout of the last N bars
  • Break of the last fractal
  • Moving-average cross (EMA)
  • RSI reversal
  • Fixed time of day
  • Opening range breakout
  • Break of the previous day's high or low
  • Random entry: the baseline every idea has to beat

Every block can be followed or faded, traded long and short or on one side only.

Filters (any mix)

  • Trend: only with the EMA of a higher timeframe
  • Volatility: only when the ATR is at or above its median
  • Session hours (server time), no new trades on Friday, maximum spread, maximum trades per day

Exits and size

  • Stop by ATR, fixed points or behind the last swing; the stop distance is 1 R
  • Target in R, break-even, ATR trailing stop, time exit, opposite signal, session end
  • Fixed lots or risk in percent of the balance

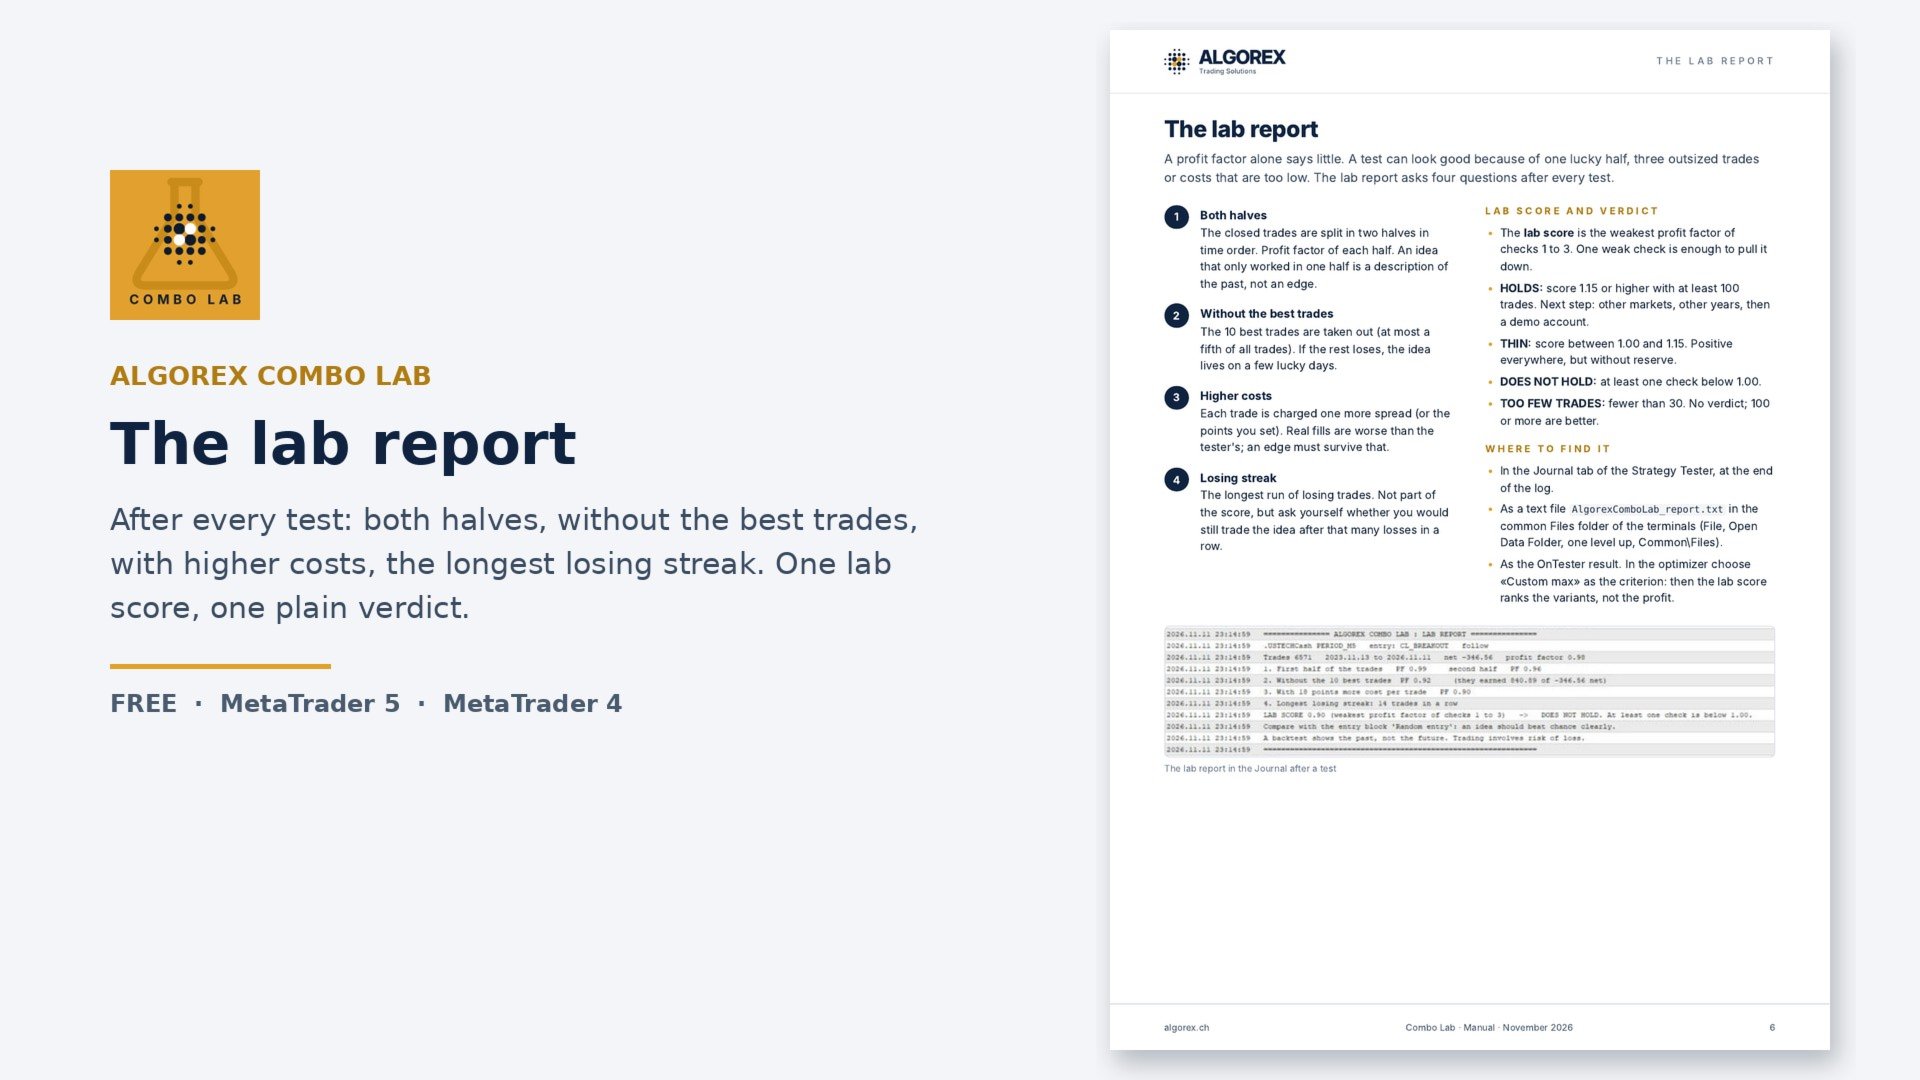
The lab report

After every test the Journal shows four checks: the profit factor of both halves of the test, the result without the 10 best trades, the result with one more spread of cost per trade, and the longest losing streak. The weakest profit factor of the first three is the lab score, with a plain verdict: HOLDS, THIN, DOES NOT HOLD YET or TOO FEW TRADES. The report is also written to a text file and returned as the custom optimisation criterion, so the optimizer ranks variants by robustness, not by profit.

The scoreboard

All eight entry blocks run side by side in every test, with the same filters, exits and costs, and are ranked by lab score in the panel (button Scoreboard) and at the end of the lab report. Switch on a filter or change an exit and one run shows which idea it helps. Where to start: one question per block, for example whether a breakout carries further with the higher-timeframe trend, or whether the opening range works better long or short. The manual has eight such starting points.

How to use it

  1. Open the Strategy Tester and choose Algorex Combo Lab.
  2. Pick one entry block and run the test (MT5: 1 minute OHLC; MT4: every tick).
  3. Read the lab report at the end of the Journal.
  4. Change one thing at a time and compare, always against the random entry.

One position at a time. Signals on the close of a bar, entry at the open of the next bar, no look-ahead. Control panel with status, filters, position and statistics; English or German.

A laboratory for testing ideas, not a finished system. No setting is a recommendation, and the default settings are a starting point. A backtest shows the past, not the future. Trading involves risk of loss.
More from author
Algorex FVG Marker draws Fair Value Gaps (three-candle imbalances) as calm, readable zones. Bullish and bearish gaps in separate colours A gap that is partly filled shrinks to the part that is still open and becomes lighter A gap that is completely filled is removed from the chart Optional 50% line inside each zone Minimum gap size in ATR, so small noise gaps are ignored Colours blend with any chart background and adapt when you change the chart theme Optional alert when price touches an open zo
FREE
Algorex FVG Marker draws Fair Value Gaps (three-candle imbalances) as calm, readable zones. Bullish and bearish gaps in separate colours A gap that is partly filled shrinks to the part that is still open and becomes lighter A gap that is completely filled is removed from the chart Optional 50% line inside each zone Minimum gap size in ATR, so small noise gaps are ignored Colours blend with any chart background and adapt when you change the chart theme Optional alert when price touches an open zo
FREE
Algorex Market Board shows the markets that set the tone of the trading day, on one compact board in your chart: Dow Jones, Nasdaq 100, S&P 500, Gold, WTI Oil, Dollar Index and VIX. For each market - Current price - Change today - Change since the New York open (09:30 New York time) - Today's range as a share of the average daily range (ADR) - Trend arrow (H1 close against the H1 EMA 20) The risk light The board compares stocks, the US dollar and the VIX. - RISK-ON: stocks up, dollar and fear
FREE
VWAP bands tell you where price is. Algorex VWAP Odds tells you what that has meant in the past. For the current bar the indicator reads three things: the New York time of day, the distance from the session VWAP in sigmas, and the freshness, meaning the minutes since price last touched the VWAP. For exactly this situation the panel shows: Return to the VWAP within 2 hours (%) Return before the session ends (%) Average time to return Heat: how far price typically runs further away first (average
FREE
Algorex Candle Timer shows the information you look at before every entry in one compact panel on your chart. Countdown to the close of the current candle in gold, turning red shortly before the close (M1: last 10 s, M5: last 30 s, M15 and above: last minute) Countdown label next to the live candle Spread in points and pips Today's range and how much of the average daily range (ADR) is already used ATR of the chart timeframe New York, local and server time, with daylight saving handled automatic
FREE
Algorex Theme Switcher puts six carefully balanced colour themes and six slots for your own themes on a compact panel in the corner of your chart. One click recolours this chart or all open charts at once. Unlike loading a template, the switcher only changes colours: Expert Advisors, indicators and drawings stay exactly where they are. Built-in themes Zurich Snow: clean light theme with slate candles Amber Terminal: black screen with amber candles Midnight: deep navy with blue candles Forest: da
FREE
Algorex Market Board shows the markets that set the tone of the trading day, on one compact board in your chart: Dow Jones, Nasdaq 100, S&P 500, Gold, WTI Oil, Dollar Index and VIX. For each market - Current price - Change today - Change since the New York open (09:30 New York time) - Today's range as a share of the average daily range (ADR) - Trend arrow (H1 close against the H1 EMA 20) The risk light The board compares stocks, the US dollar and the VIX. - RISK-ON: stocks up, dollar and fear
FREE
The Magnificent Seven carry the Nasdaq. Algorex Seven Pulse shows you which of them is pulling right now. Apple, Microsoft, Nvidia, Amazon, Alphabet, Meta and Tesla run as lines next to Nasdaq 100, S&P 500 and Dow, all in percent from the New York open at 09:30. You see at once who carries the index, who drags it down, and where index and stocks part ways. Opens its own clean navy chart; the lines are drawn from tick data The New York session 09:30 to 16:00 across the full chart width, with its
FREE
VWAP bands tell you where price is. Algorex VWAP Odds tells you what that has meant in the past. For the current bar the indicator reads three things: the New York time of day, the distance from the session VWAP in sigmas, and the freshness, meaning the minutes since price last touched the VWAP. For exactly this situation the panel shows: Return to the VWAP within 2 hours (%) Return before the session ends (%) Average time to return Heat: how far price typically runs further away first (average
FREE
The US indices do not move alone. Algorex Risk Pulse shows what moves them from the outside, and whether money is flowing into risk or out of it. Nasdaq 100, S&P 500 and Dow run as lines next to gold, oil, the Dollar Index, USDJPY, DAX, bitcoin and the VIX, all in percent from the New York open at 09:30. You see at once which market leads and which one disagrees. The New York session 09:30 to 16:00 across the full chart width, with its own percent and time axis At 09:30 the new day starts on the
FREE
I built Algorex Trade Pilot for myself. Spontaneous trades and revenge trading have burned me many times: a quick entry without a plan, a loss, then the next trade only to win it back, bigger and worse than the first. Trade Pilot puts a short, honest check between the impulse and the click, and it takes the order buttons away from me when I am in no state to trade. It never opens a trade by itself: every order needs your click. Risk, size and lines Enter your risk per trade in percent of the bal
FREE
Algorex Candle Timer shows the information you look at before every entry in one compact panel on your chart. Countdown to the close of the current candle in gold, turning red shortly before the close (M1: last 10 s, M5: last 30 s, M15 and above: last minute) Countdown label next to the live candle Spread in points and pips Today's range and how much of the average daily range (ADR) is already used ATR of the chart timeframe New York, local and server time, with daylight saving handled automatic
FREE
Algorex Theme Switcher puts six carefully balanced colour themes and six slots for your own themes on a compact panel in the corner of your chart. One click recolours this chart or all open charts at once. Unlike loading a template, the switcher only changes colours: Expert Advisors, indicators and drawings stay exactly where they are. Built-in themes Zurich Snow: clean light theme with slate candles Amber Terminal: black screen with amber candles Midnight: deep navy with blue candles Forest: da
FREE
I built Algorex Trade Pilot for myself. Spontaneous trades and revenge trading have burned me many times: a quick entry without a plan, a loss, then the next trade only to win it back, bigger and worse than the first. Trade Pilot puts a short, honest check between the impulse and the click, and it takes the order buttons away from me when I am in no state to trade. It never opens a trade by itself: every order needs your click. Risk, size and lines Enter your risk per trade in percent of the bal
FREE
Algorex Liquidity Radar shows where the liquidity sits in the trading day and which of it has already been taken. Sessions as quiet zones Asia, London, New York AM, New York Lunch and New York PM as soft pastel zones with the session name as a watermark Thin vertical lines where each session starts and ends All times are New York time, summer time is handled automatically Liquidity levels High and low of every session and of the previous day An open level runs to the right edge of the chart as a
Algorex Combo Lab
Daniel Schwoerer
Every trading idea sounds convincing. The question is whether it holds. Algorex Combo Lab lets you try an idea in minutes and keep refining it, with the same strict questions we ask of our own systems: does it hold in both halves of the test, without its few best trades, and with higher costs? And does it beat plain chance? Combo Lab is a free laboratory for the Strategy Tester. Pick one entry block, switch on any mix of filters, choose your exits, run the test and read the lab report. Entry blo
FREE
Filter:
No reviews
Reply to review