Candle Timer Pulse
- Indicators
-
Anna Makwana
 MetaTrader tools and indicators that measure the odds on your own chart: how often levels were reached, how far days and sessions usually run, and what followed past signals. Every figure comes from the symbol’s own price history and uses closed bars only, so nothing repaints. Questions are welcome
- Version: 1.0
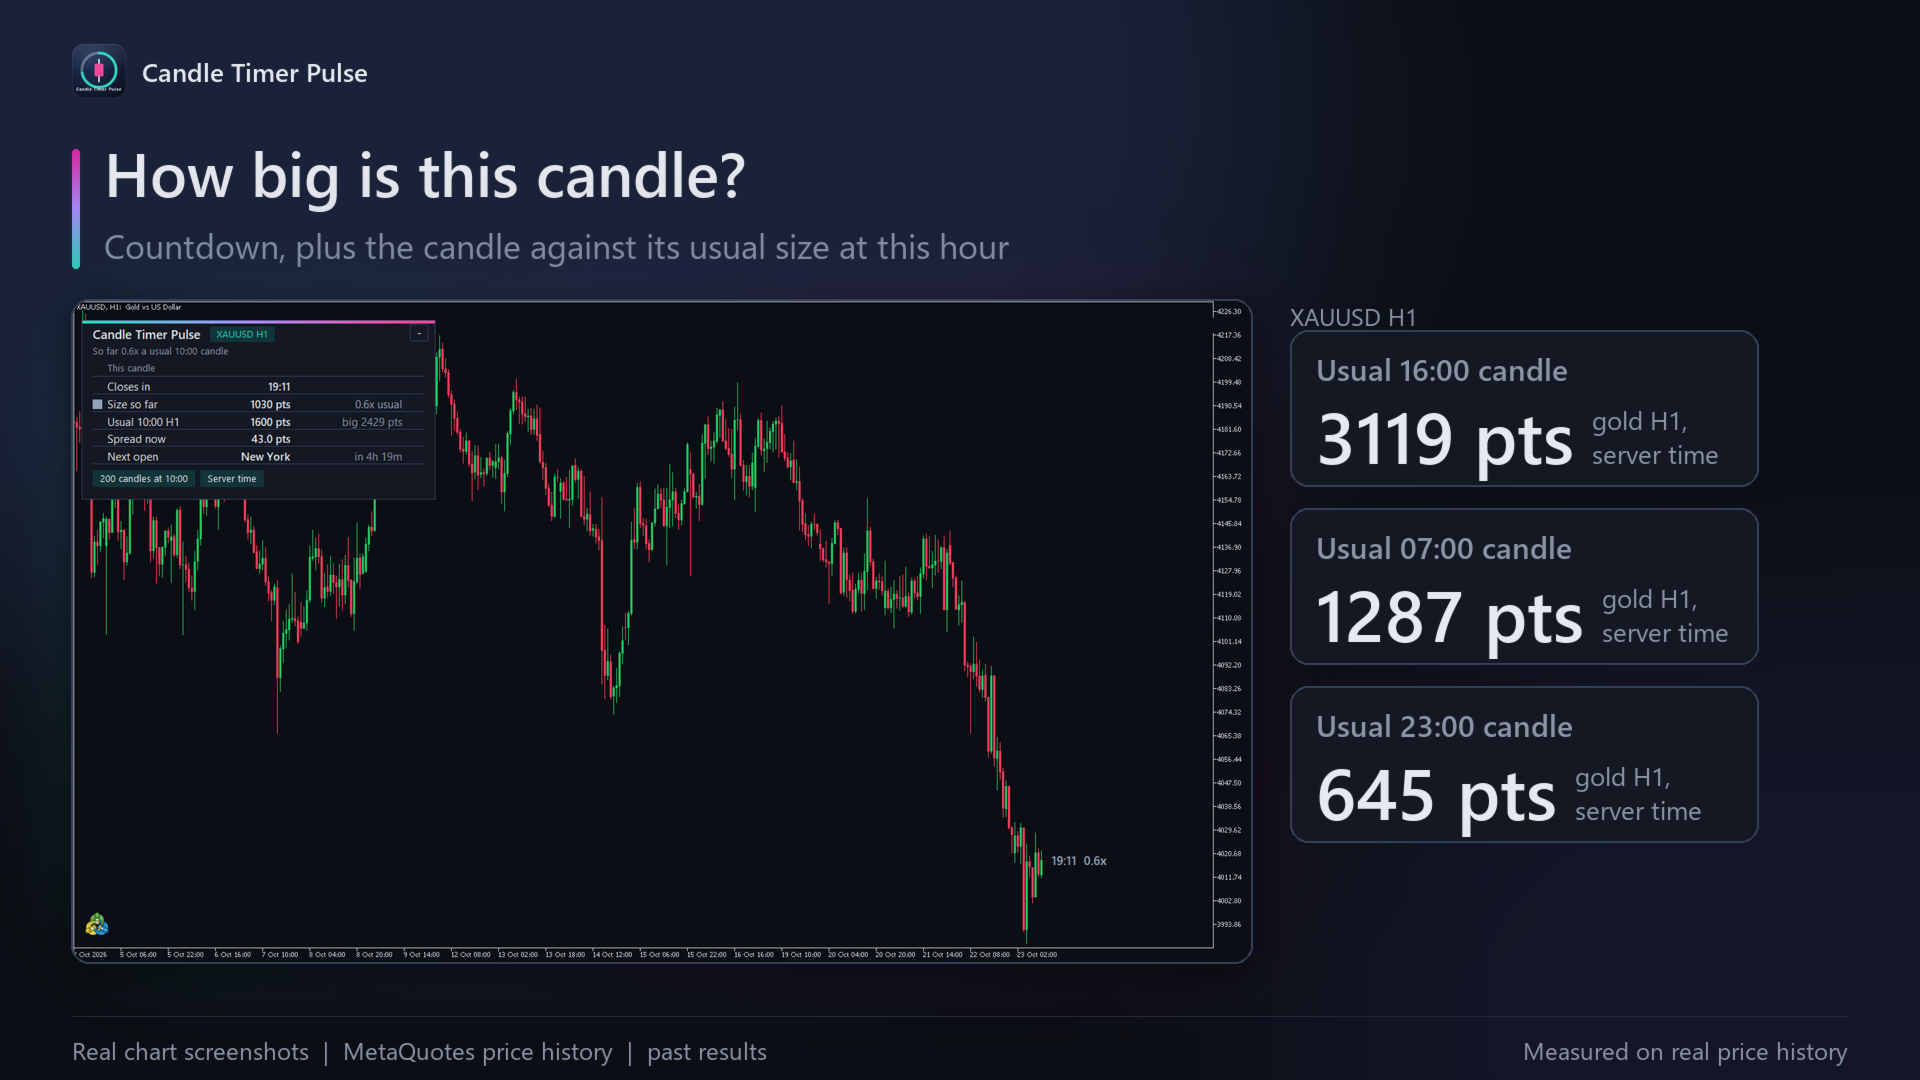
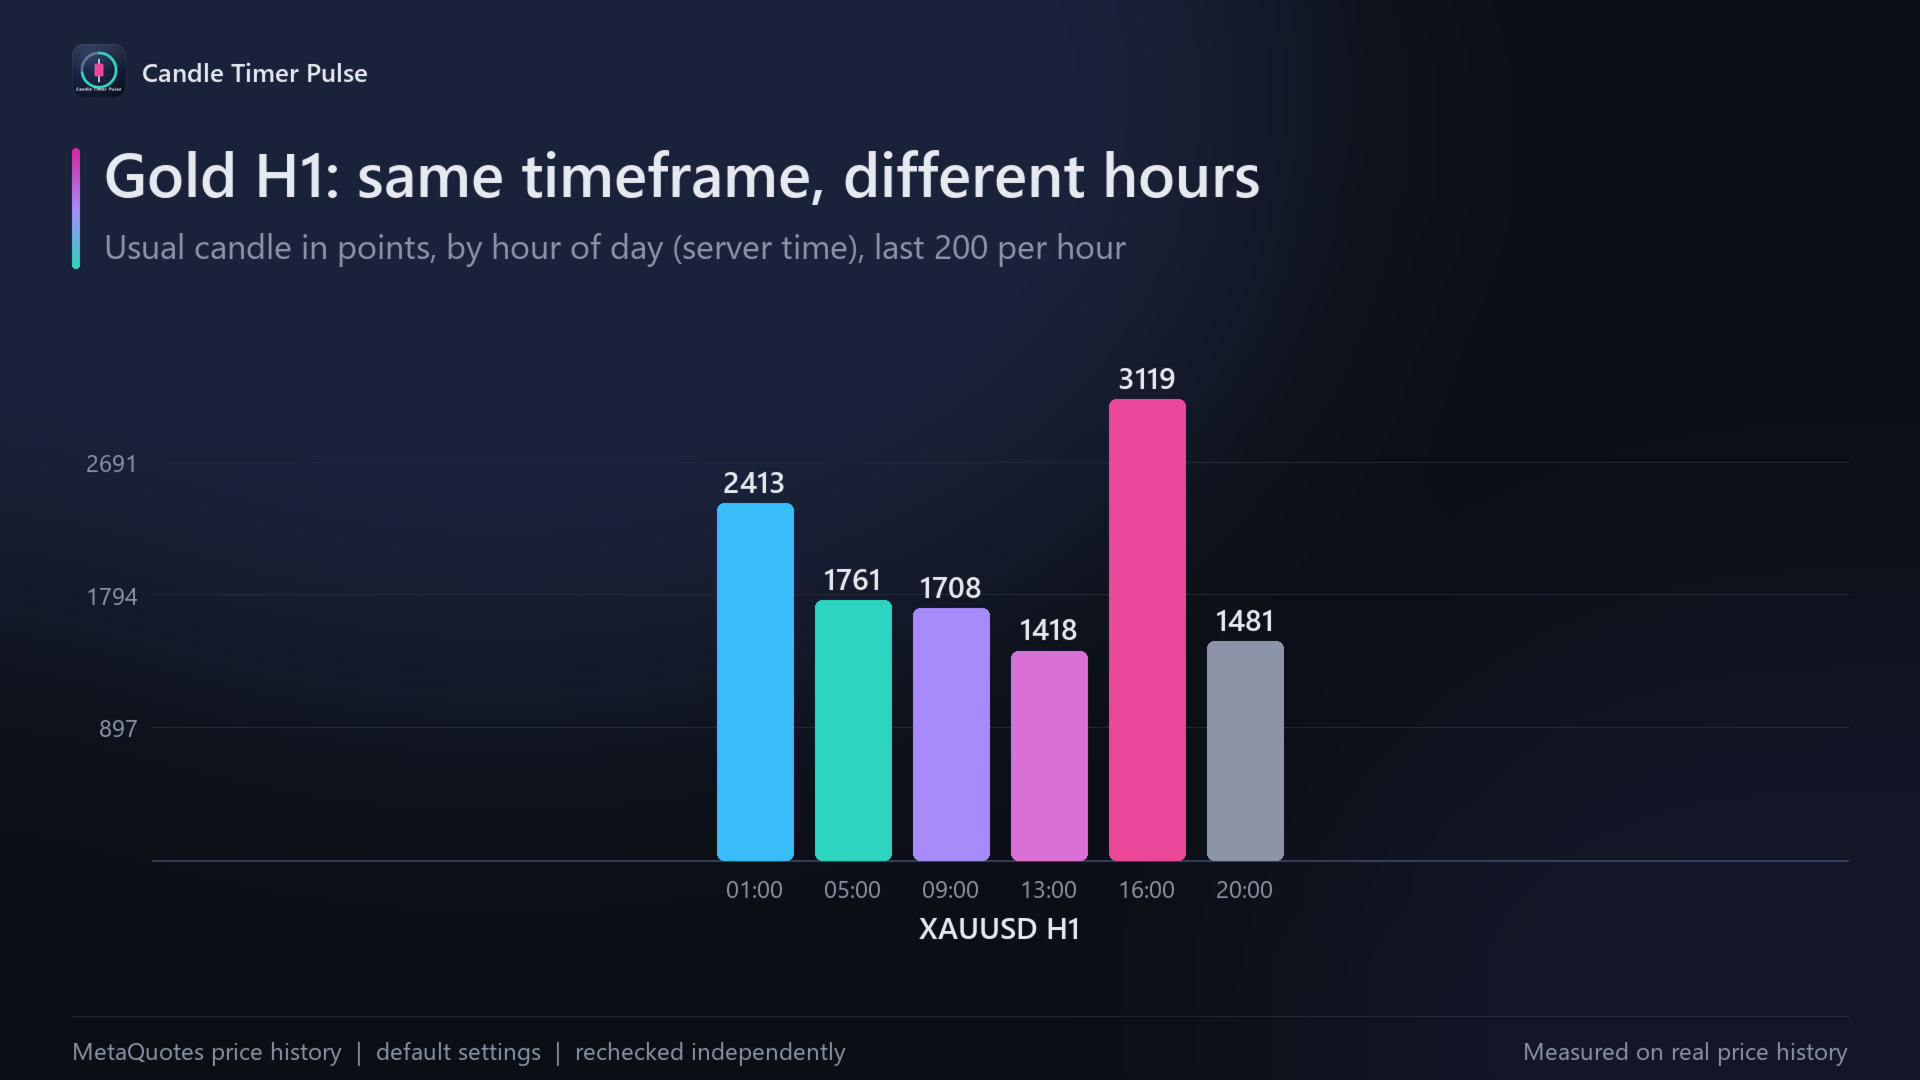
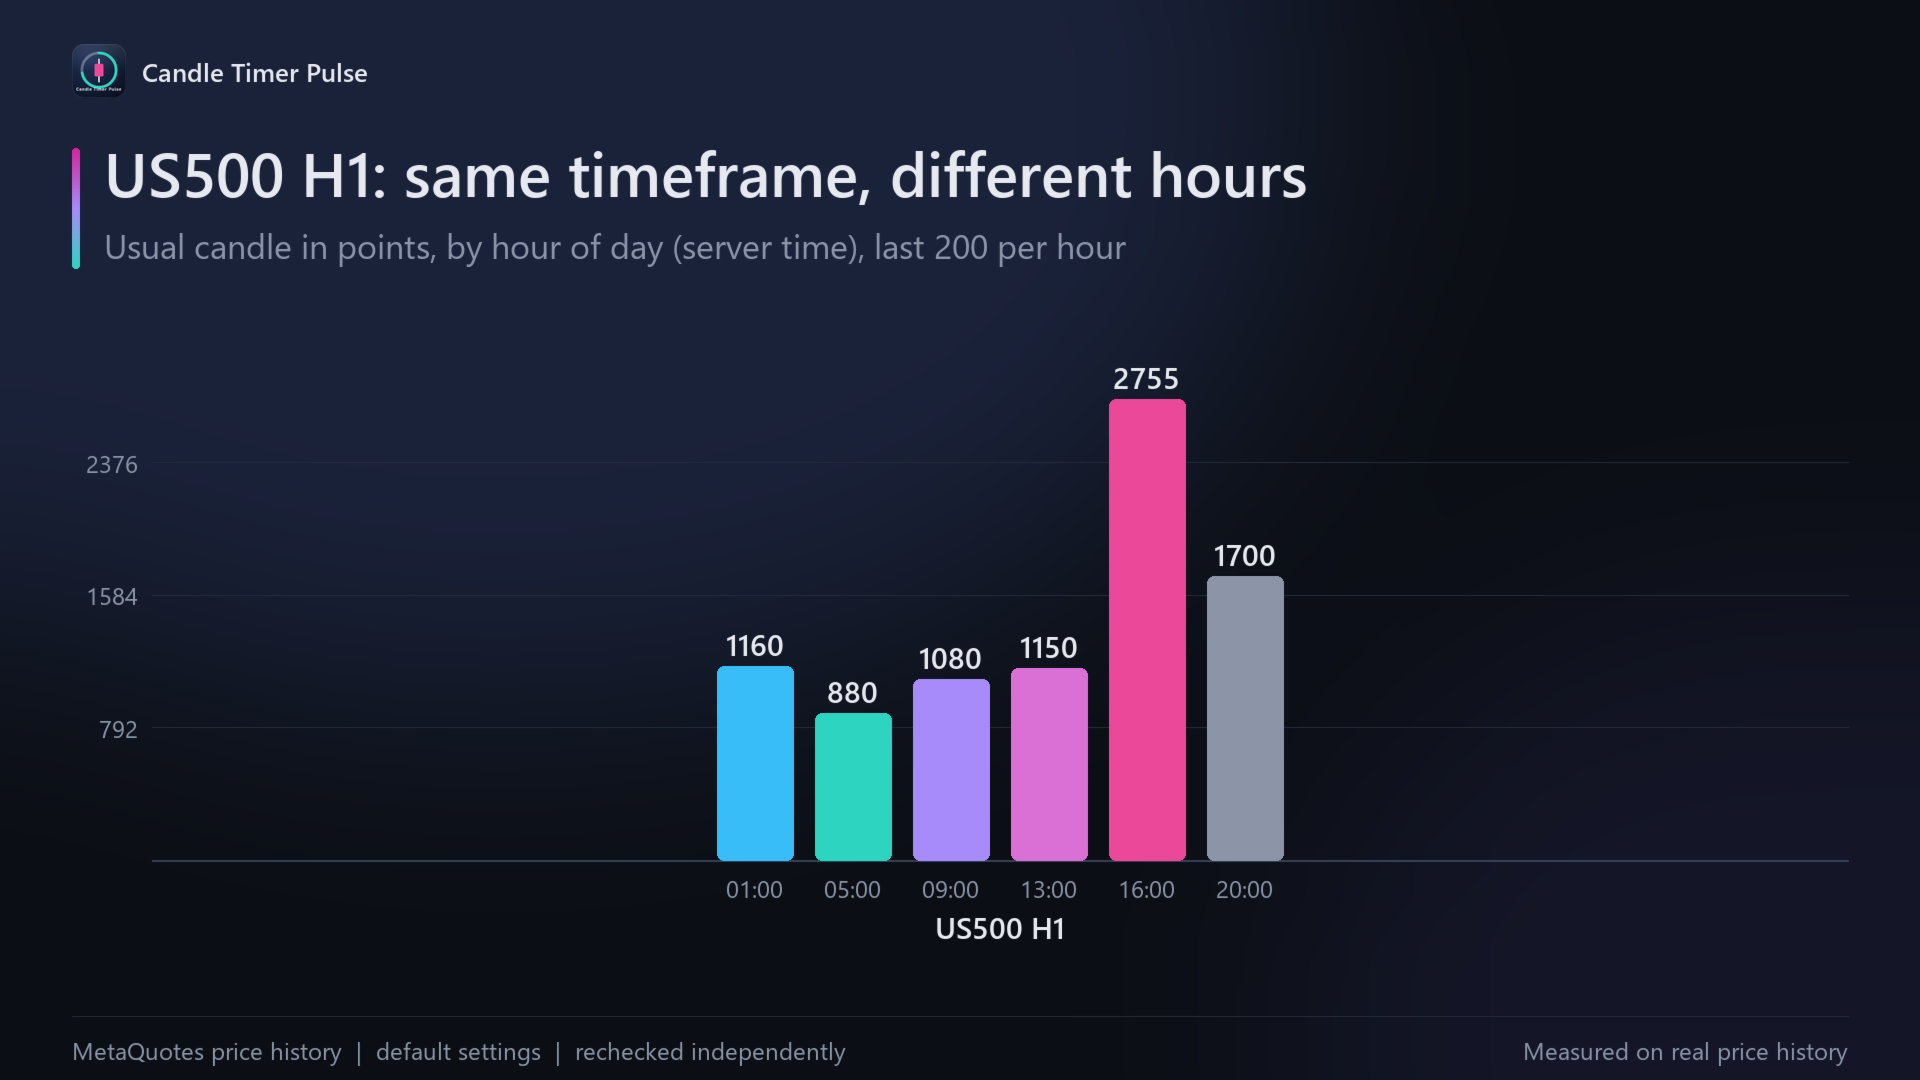
A candle countdown that also tells you how big the current candle already is. On gold H1, the usual 16:00 candle was 3119 points and the usual 23:00 candle 645 points: the same timeframe, very different candles by hour. Candle Timer Pulse shows the time left in the current candle and compares its size so far with the usual candle of this timeframe at this hour, from the symbol's own history. Free, clear, and checked against a separate implementation.
What it does
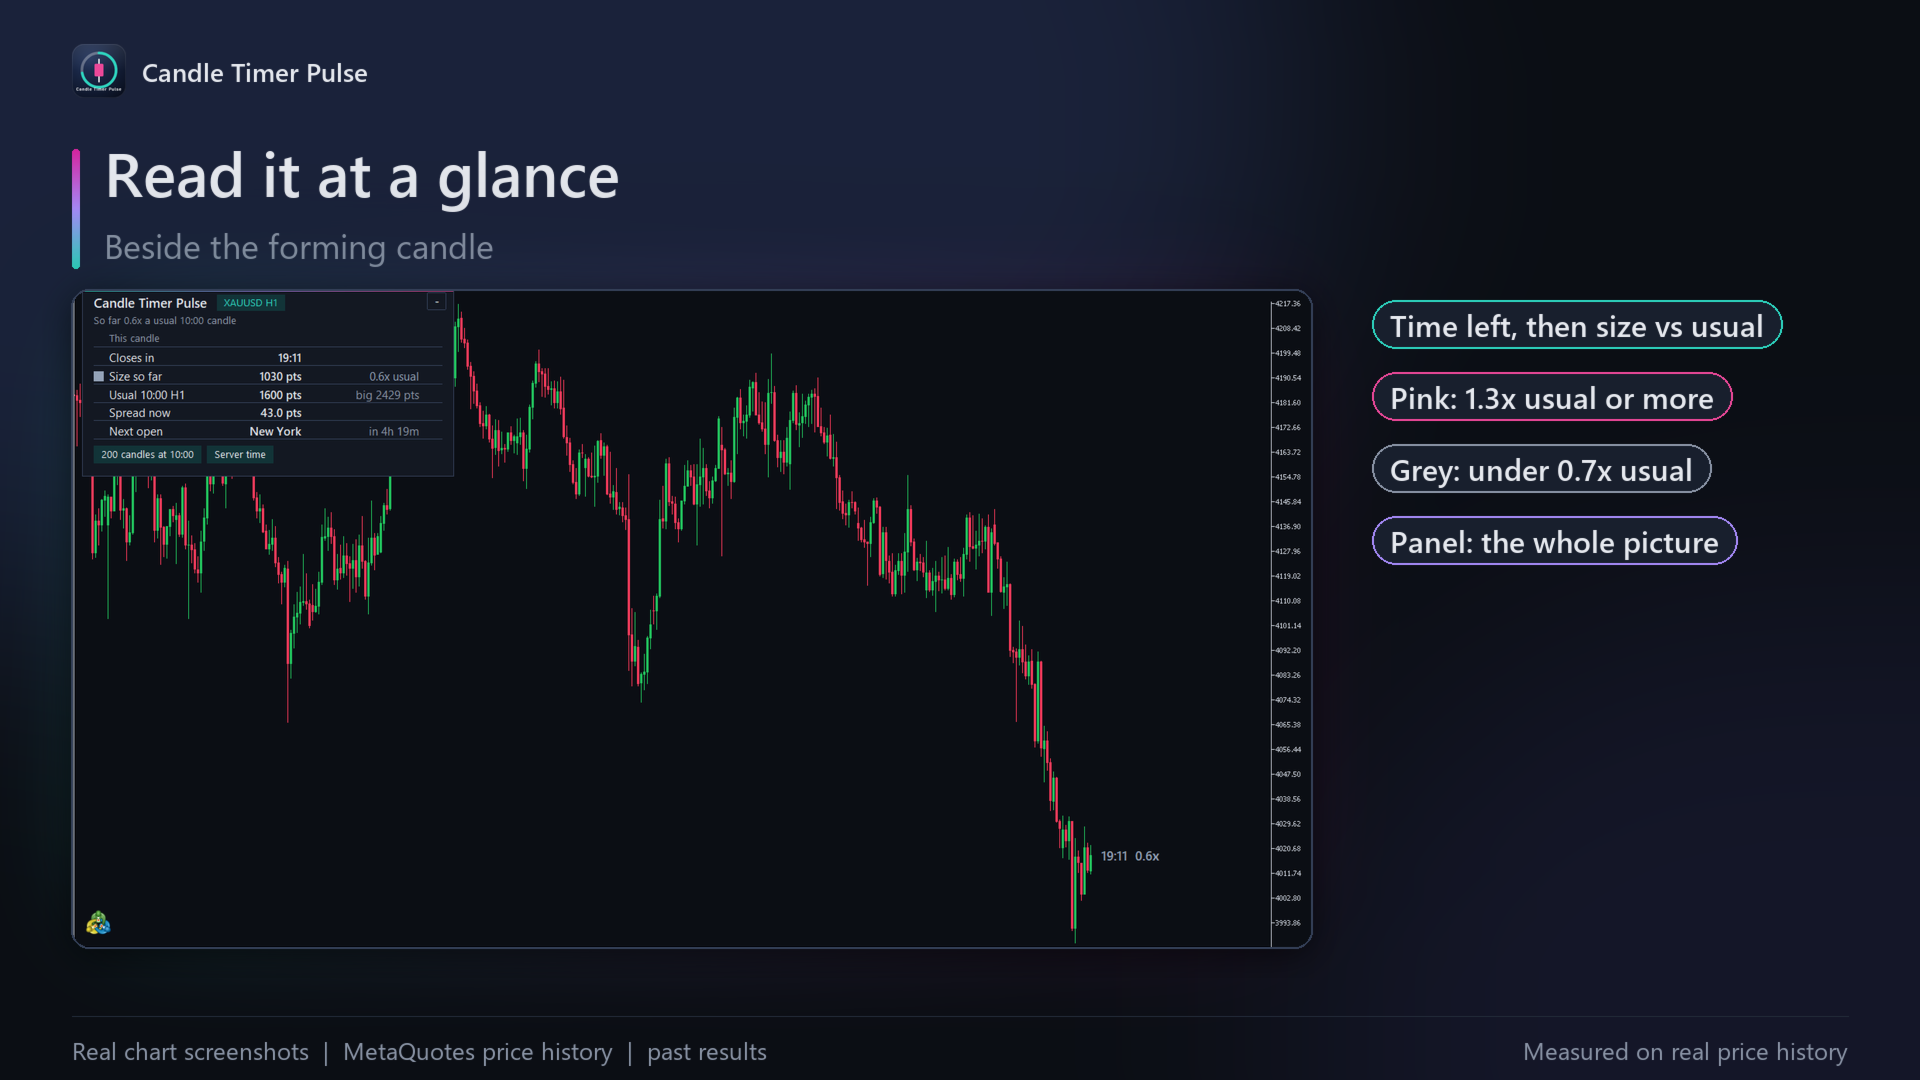
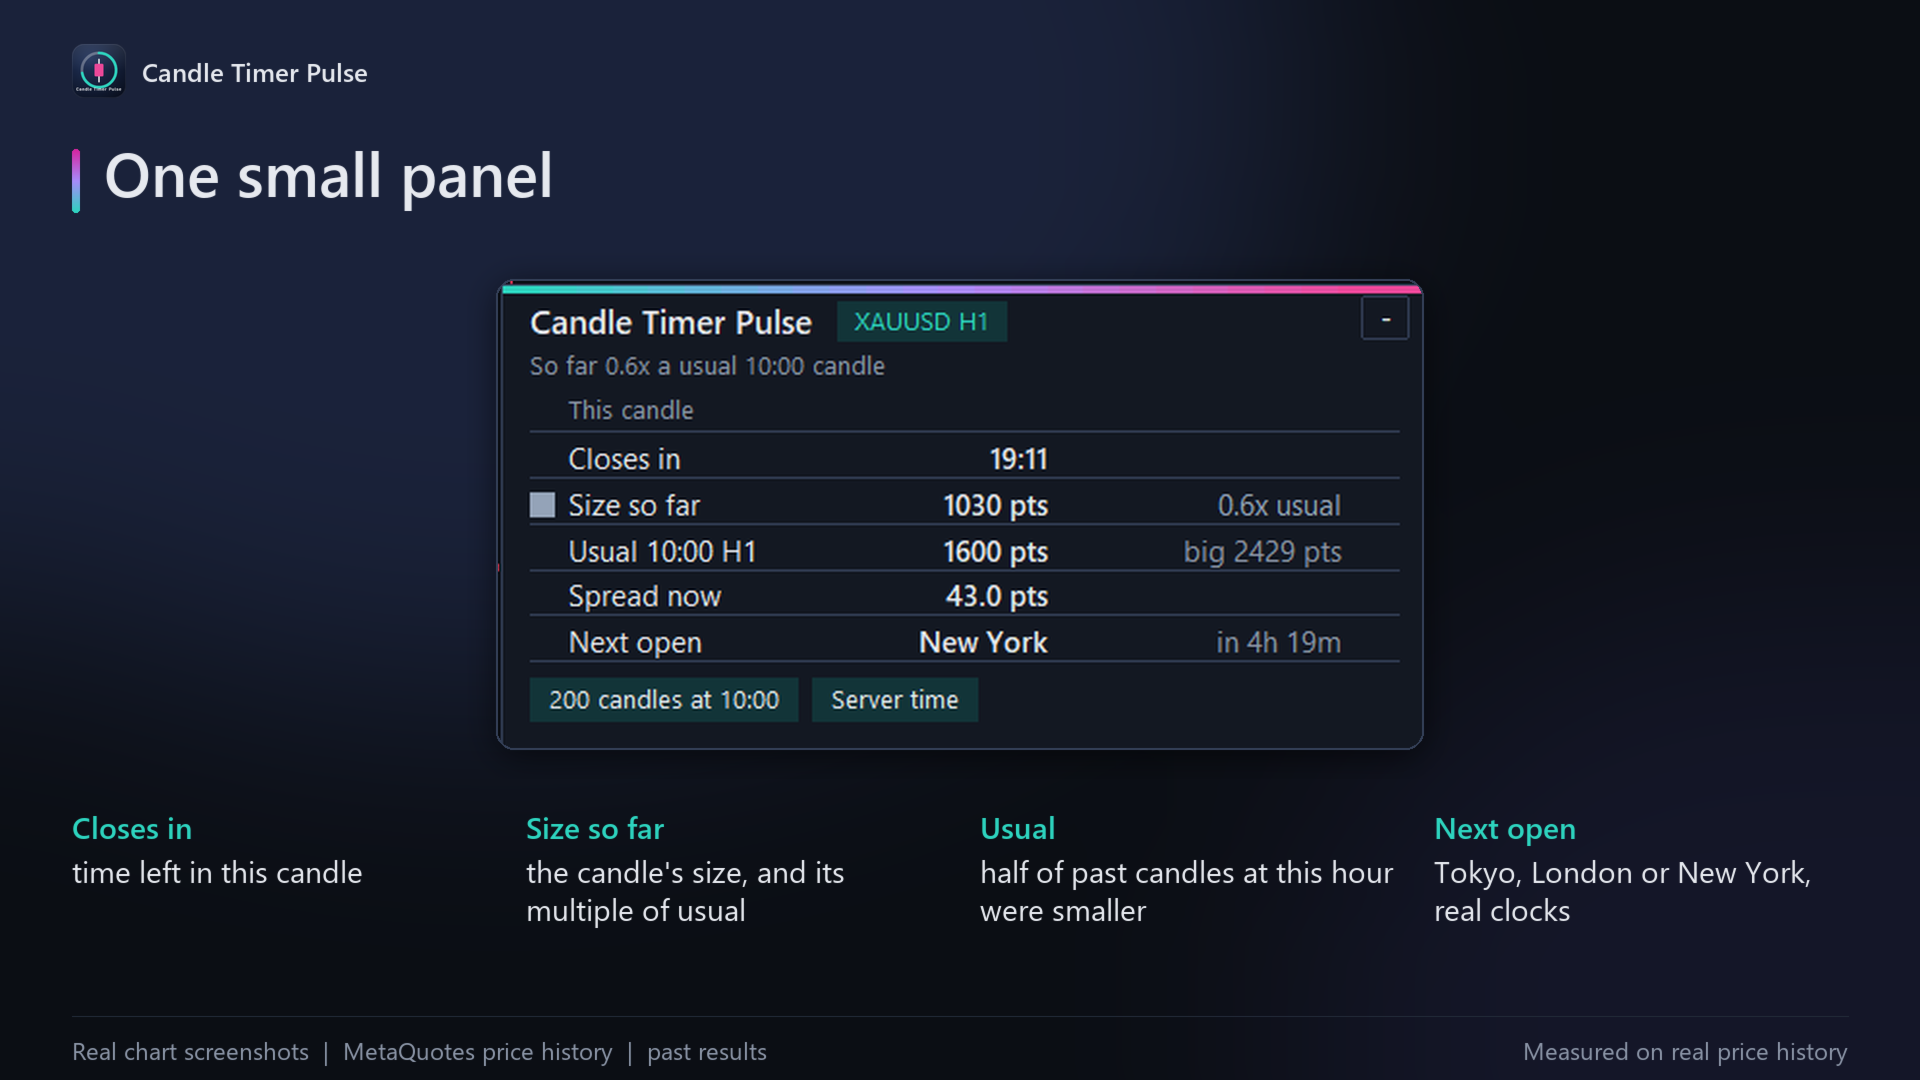
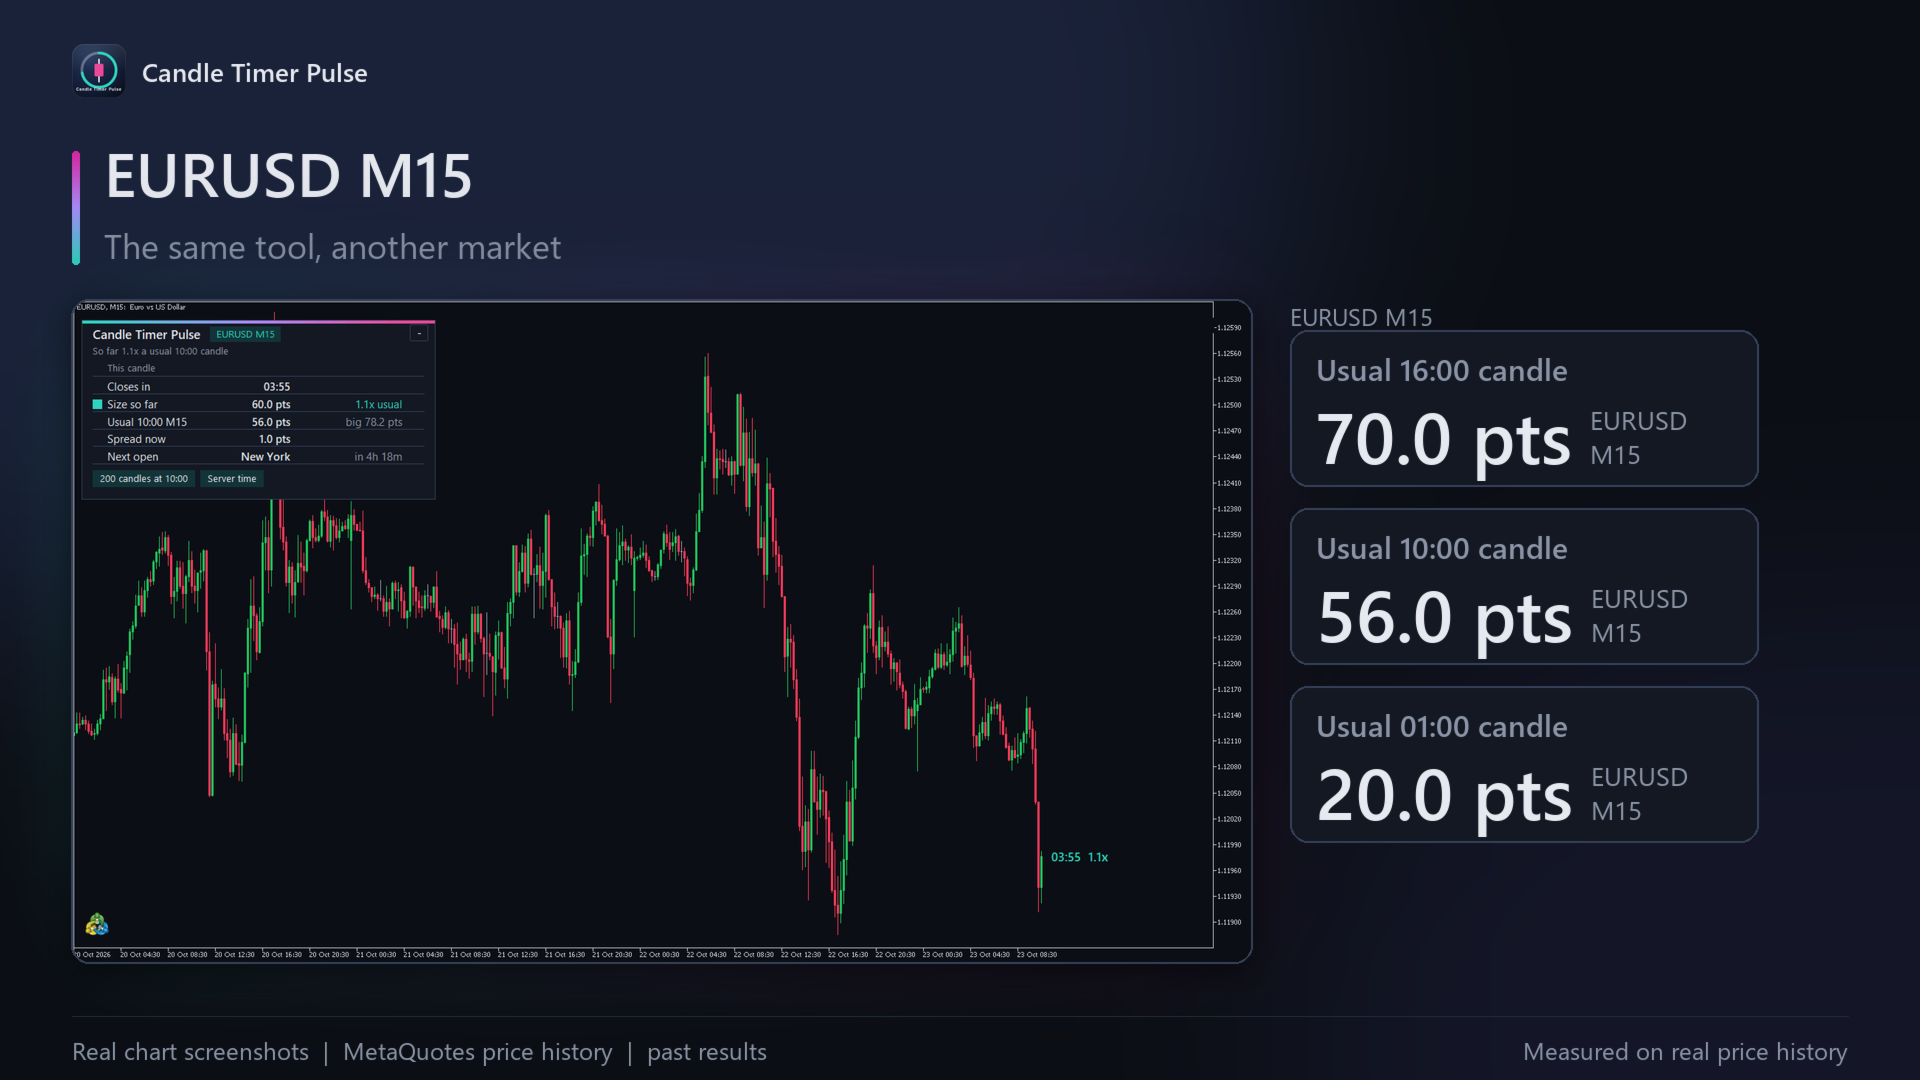
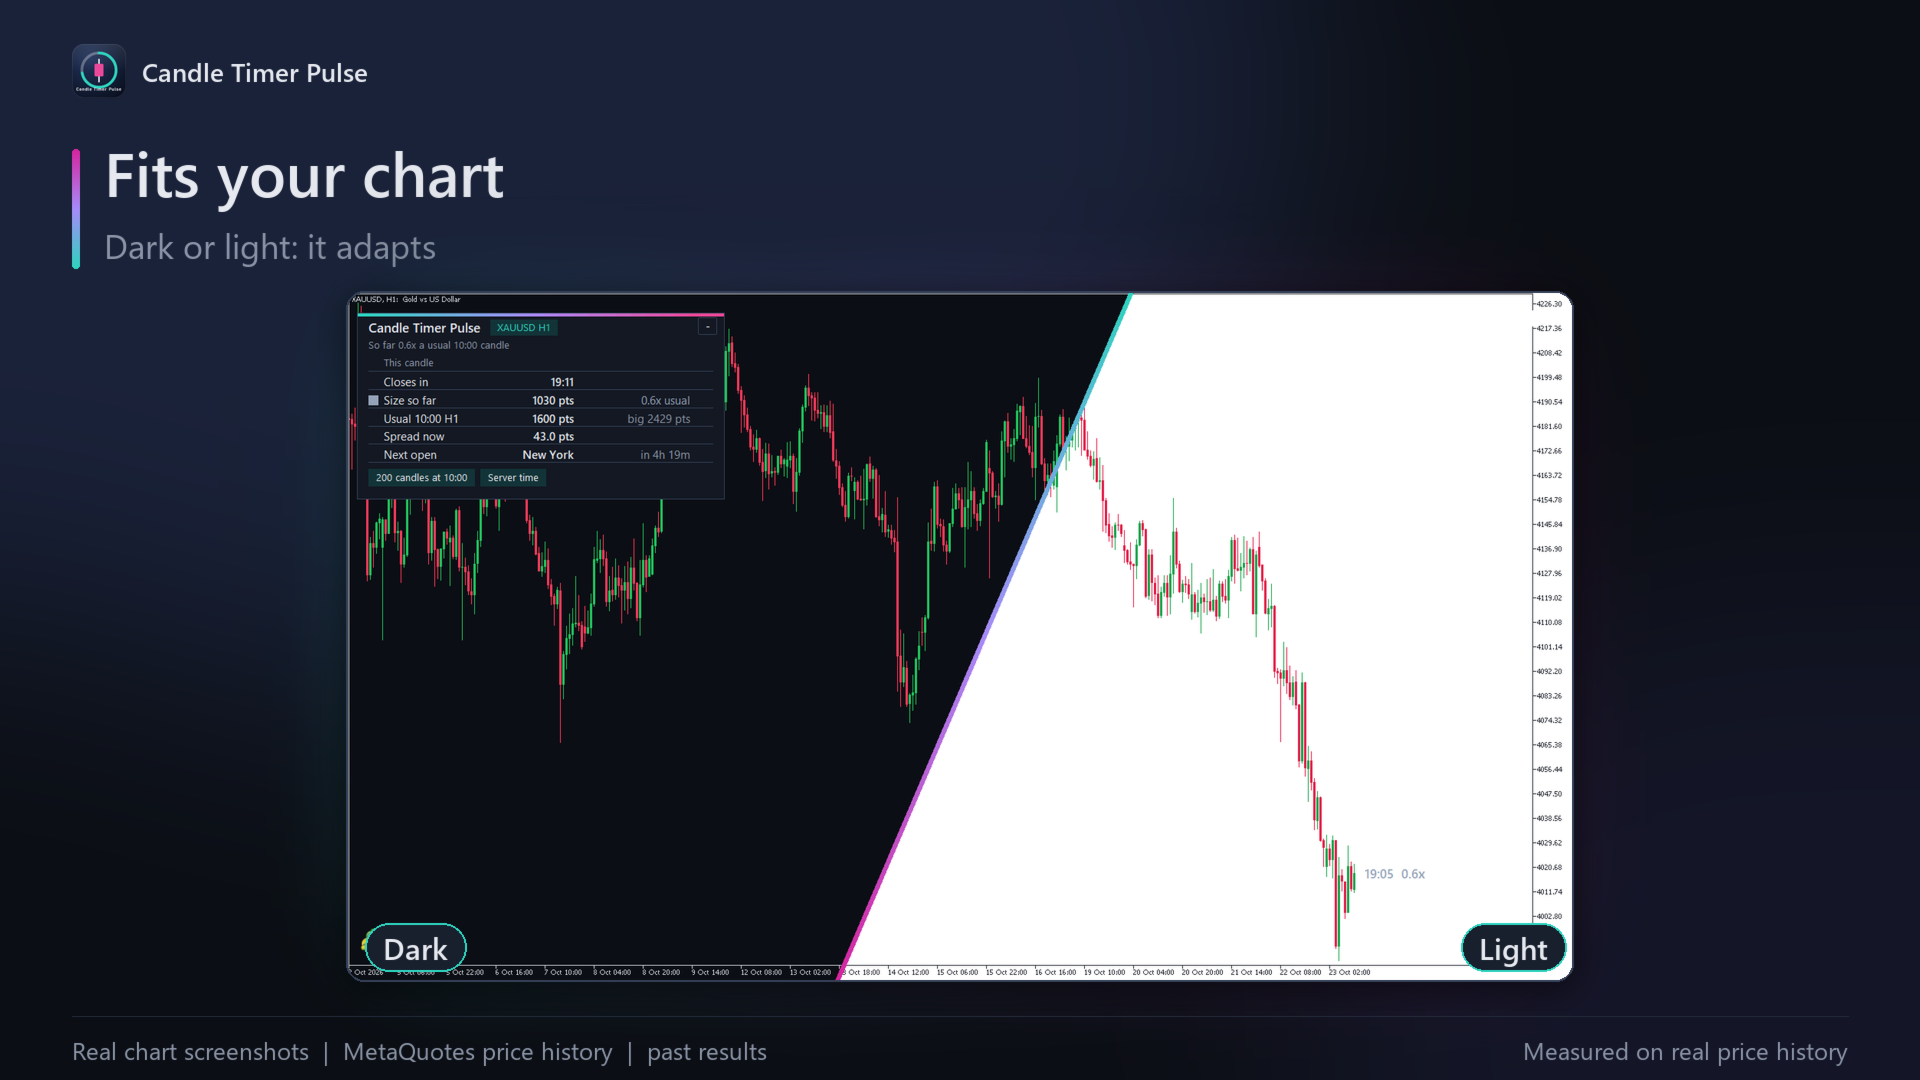
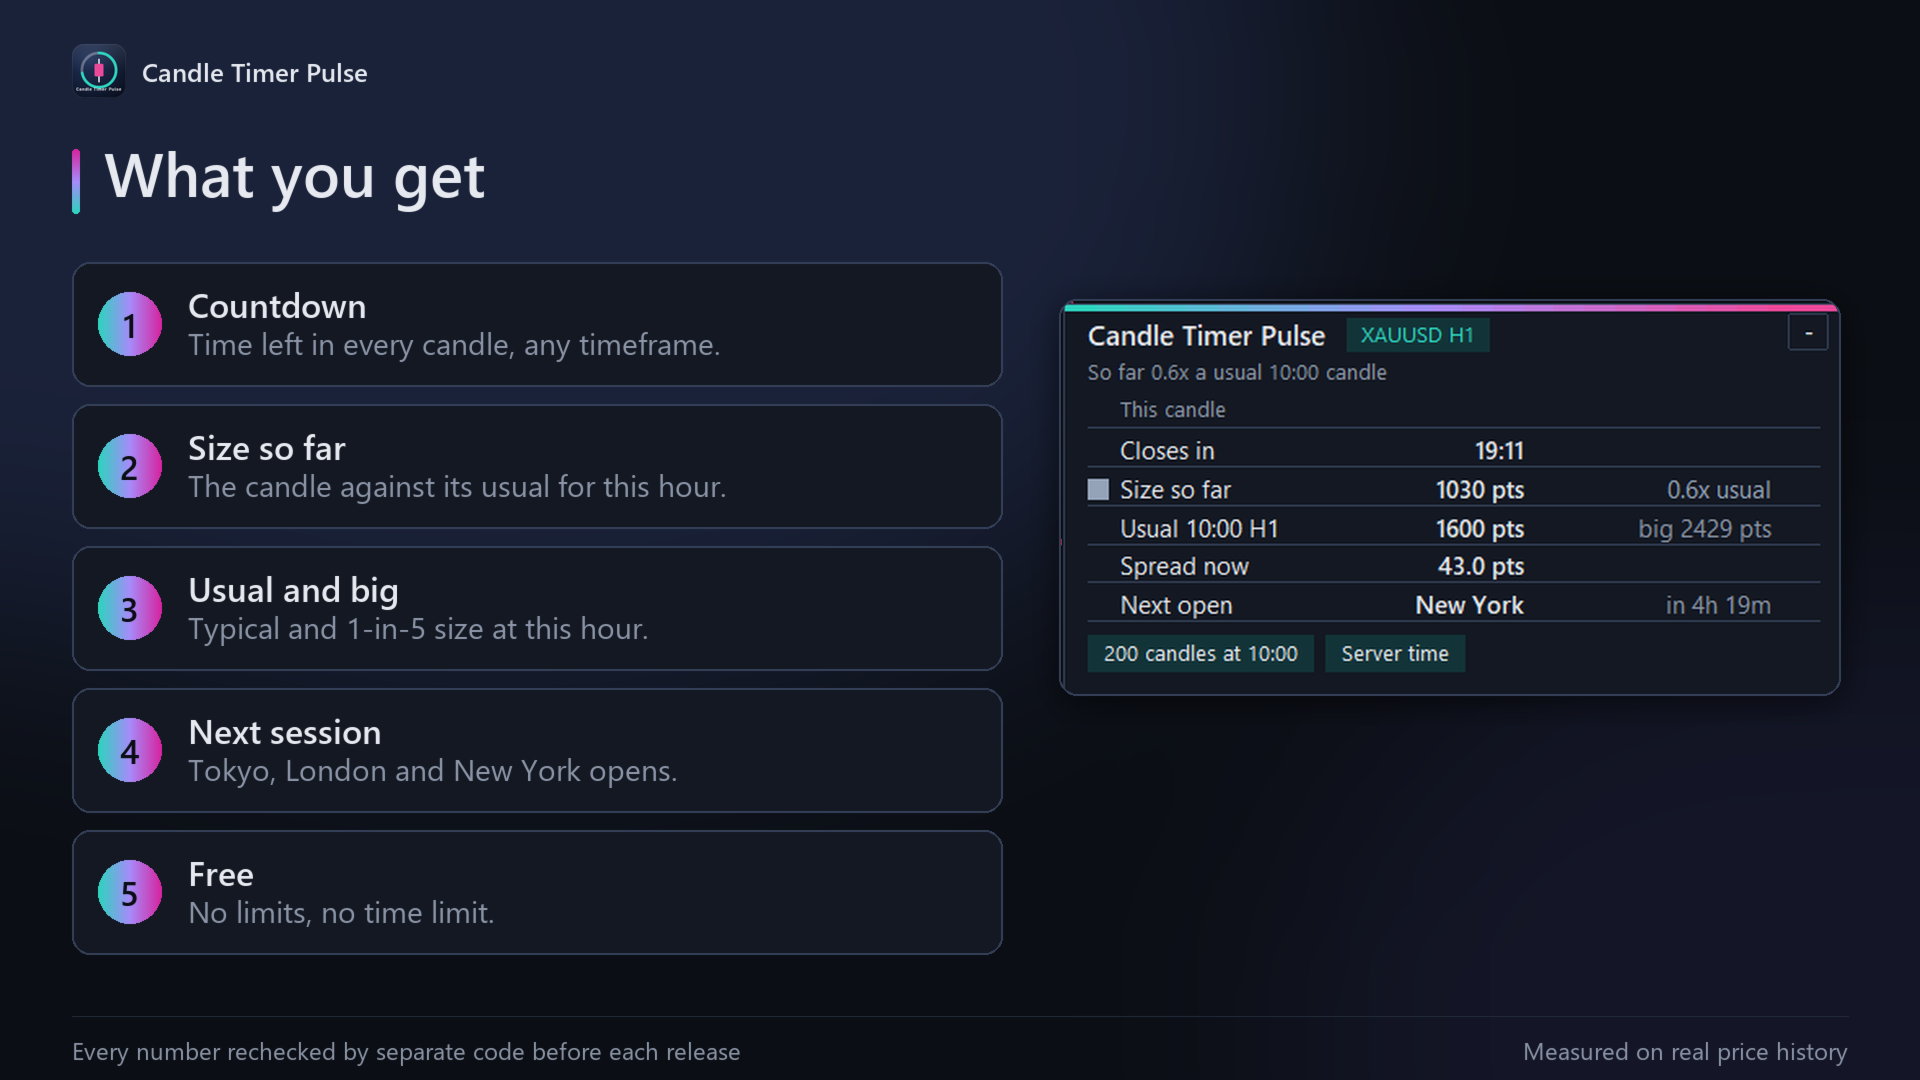
Beside the forming candle, a countdown shows the time left, followed by the candle's size so far as a multiple of the usual candle at this hour (for example 1.4x). Its colour changes with that multiple: grey under 0.7x, aqua for a normal candle, pink at 1.3x or more. A small panel adds the size so far in points, the usual and the big candle at this hour (1 in 5 past candles were bigger), the spread now, and the time to the next Tokyo, London or New York open.
How it works
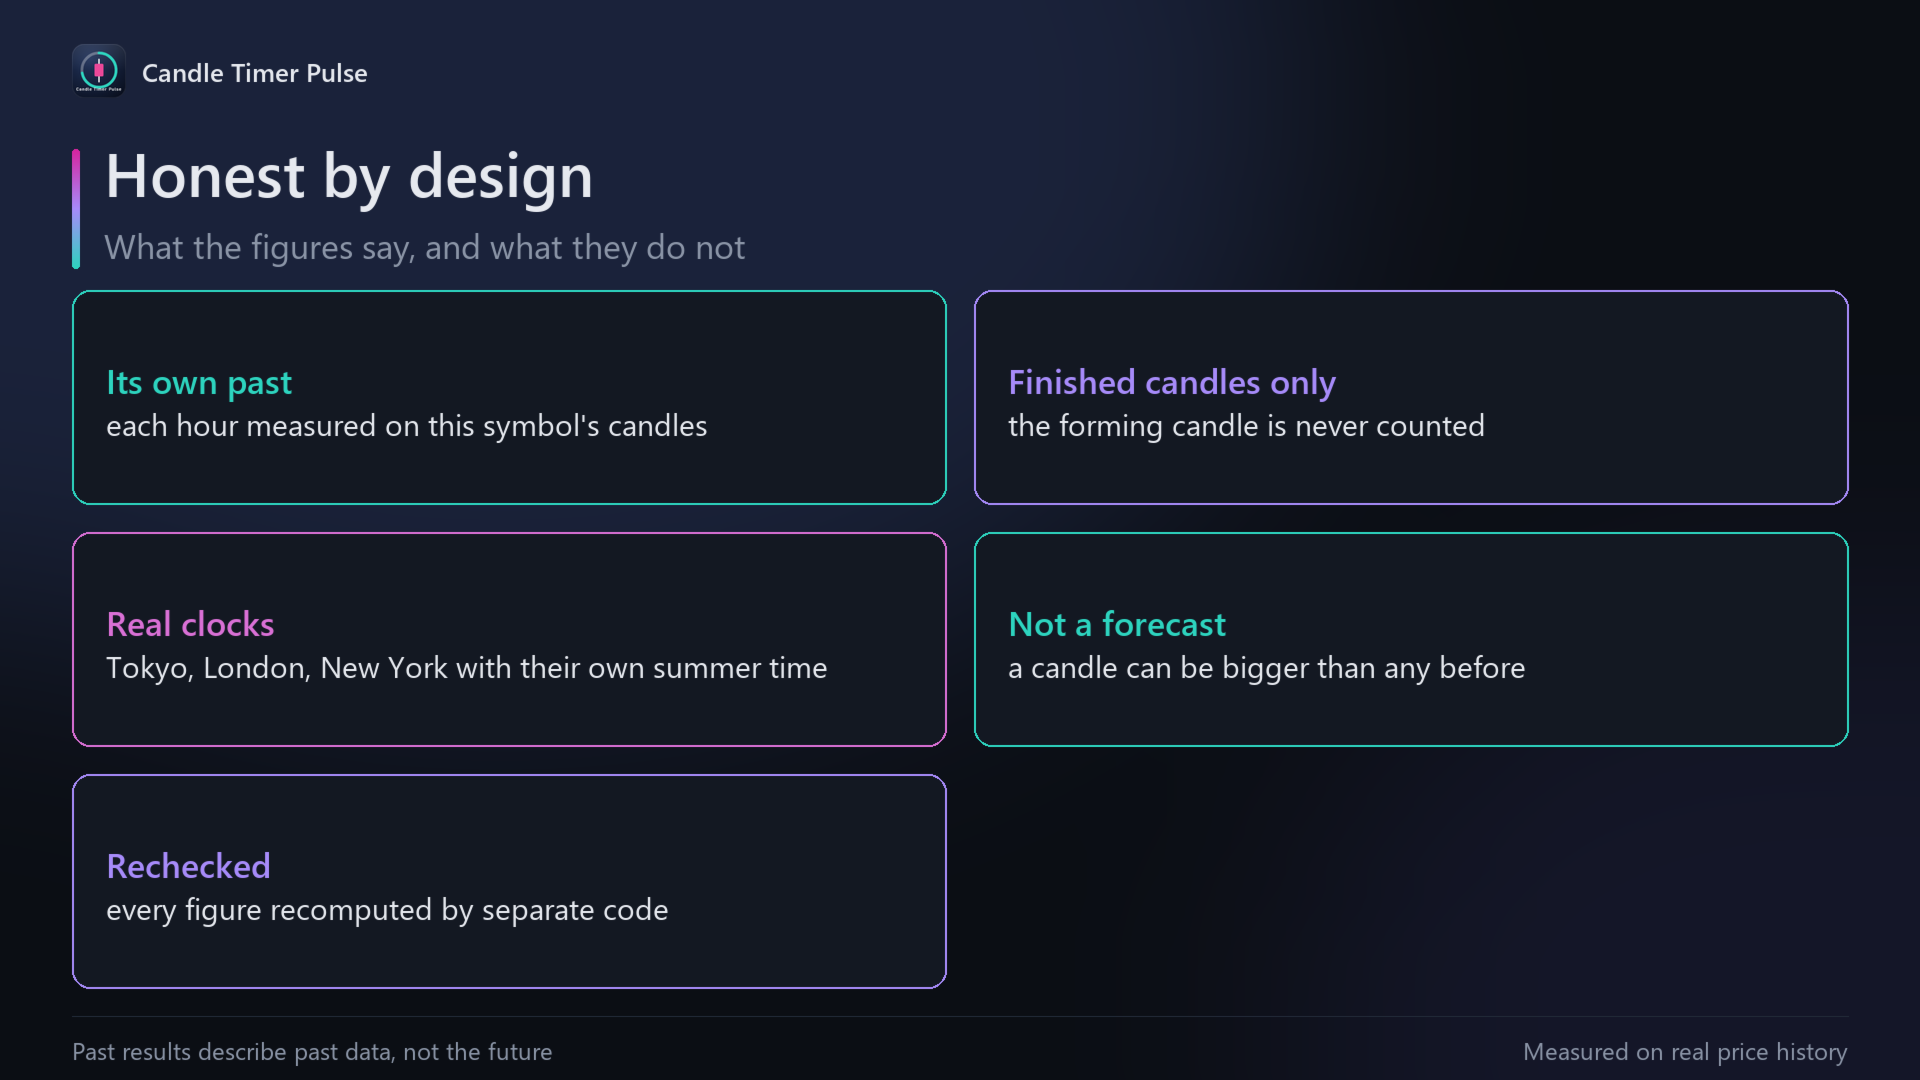
On intraday timeframes, the forming candle is compared with past candles of the same timeframe that opened at the same hour of day; on daily and longer timeframes, with all past candles. The last 200 such candles are used by default. Hours of day can follow the broker's server time or the New York, London, Tokyo or UTC clock, each with its own summer time. Session opens use each city's own clock: Tokyo 09:00, London 08:00 and New York 08:00, Monday to Friday. Only finished candles are counted. The countdown follows the trade server's clock, so it keeps moving between ticks.
How it was tested
Every number (the usual and big candle for each hour, the count, the size so far and its multiple, and the next session opens) is recomputed by a separate implementation from the same broker data and matches it to the last decimal, on gold, EURUSD, US500 and USDJPY across H1, M15 and D1. The session opens were checked at 200 moments from 2015 to 2037, across summer-time changes and weekends, against an independent time-zone database.
Results and risks
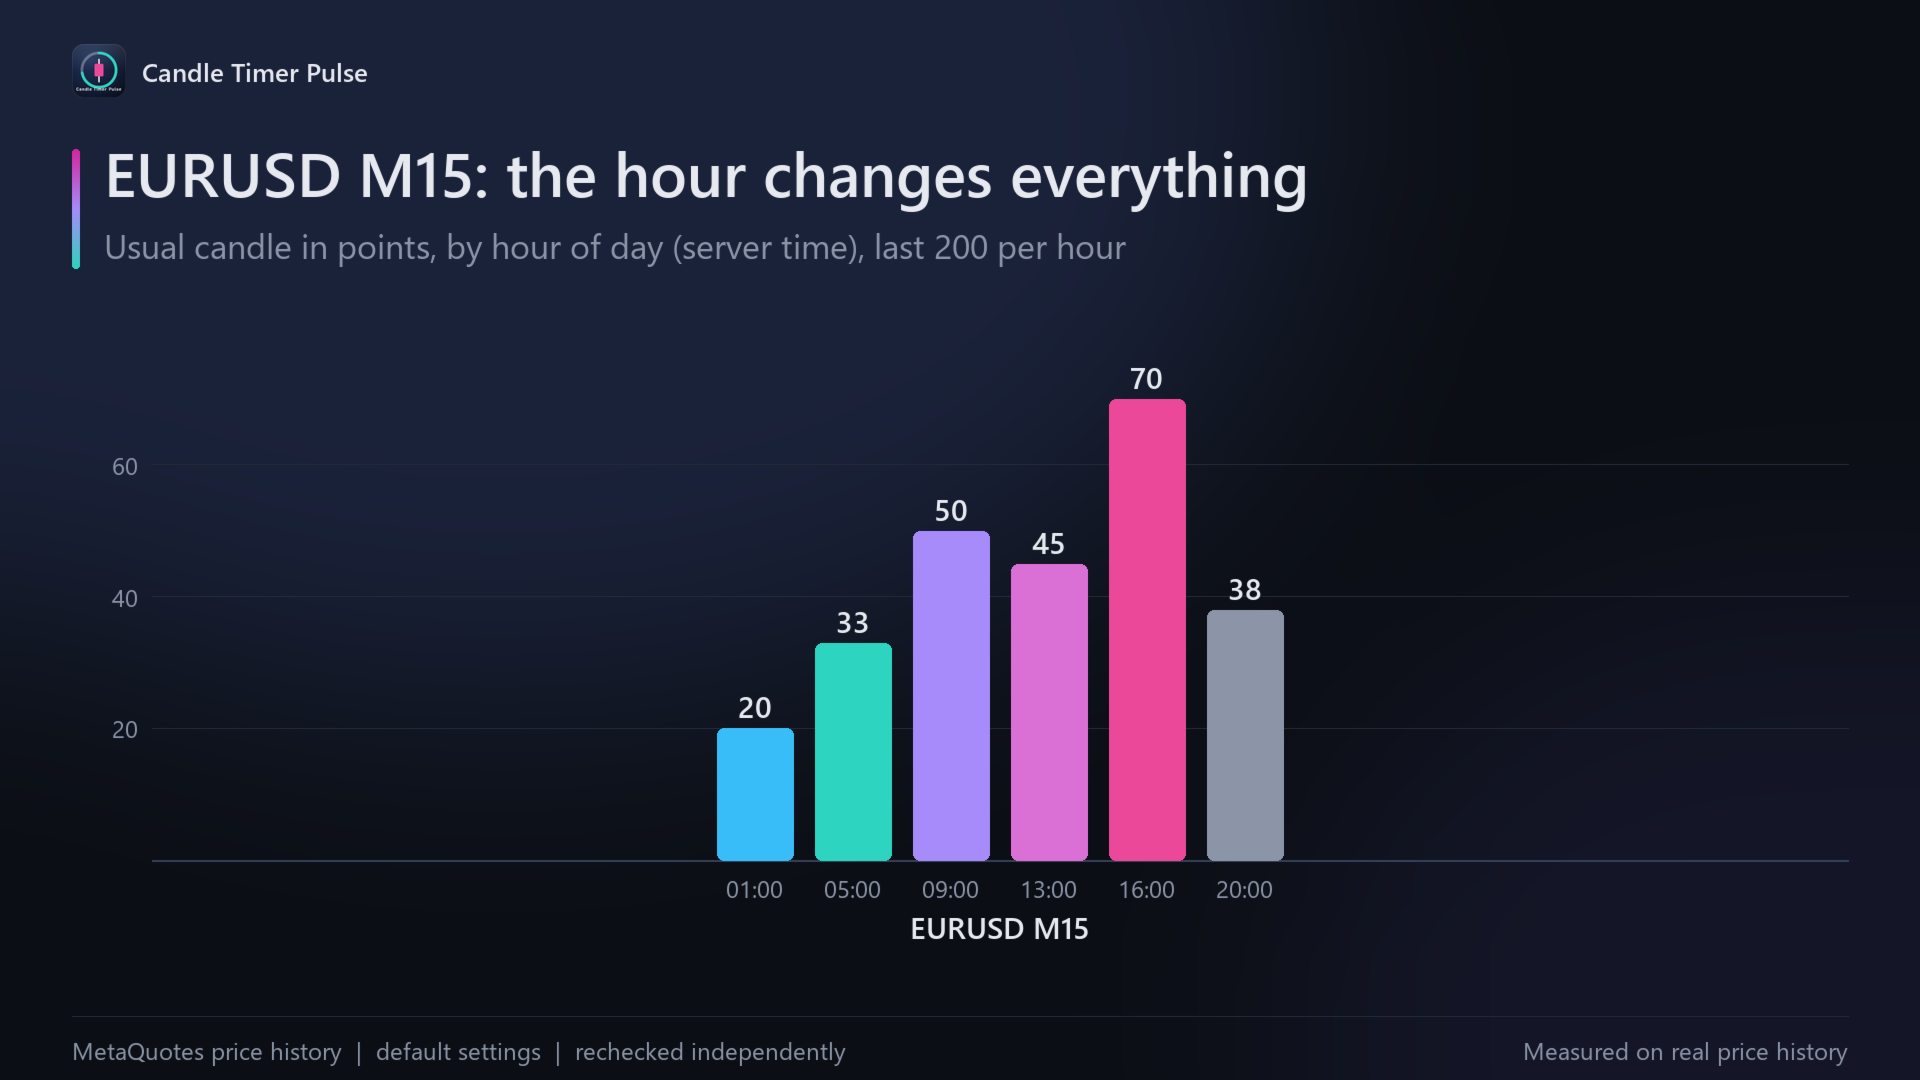
On gold H1 over the last 200 candles per hour, the usual 16:00 candle was 3119 points, the usual 07:00 candle 1287 points and the usual 23:00 candle 645 points (server time of one broker). On EURUSD M15, the usual 16:00 candle was 70.0 points and the usual 01:00 candle 20.0 points. These describe past candles, not the future: any candle can be larger than anything seen before, especially around major news.
Recommended use
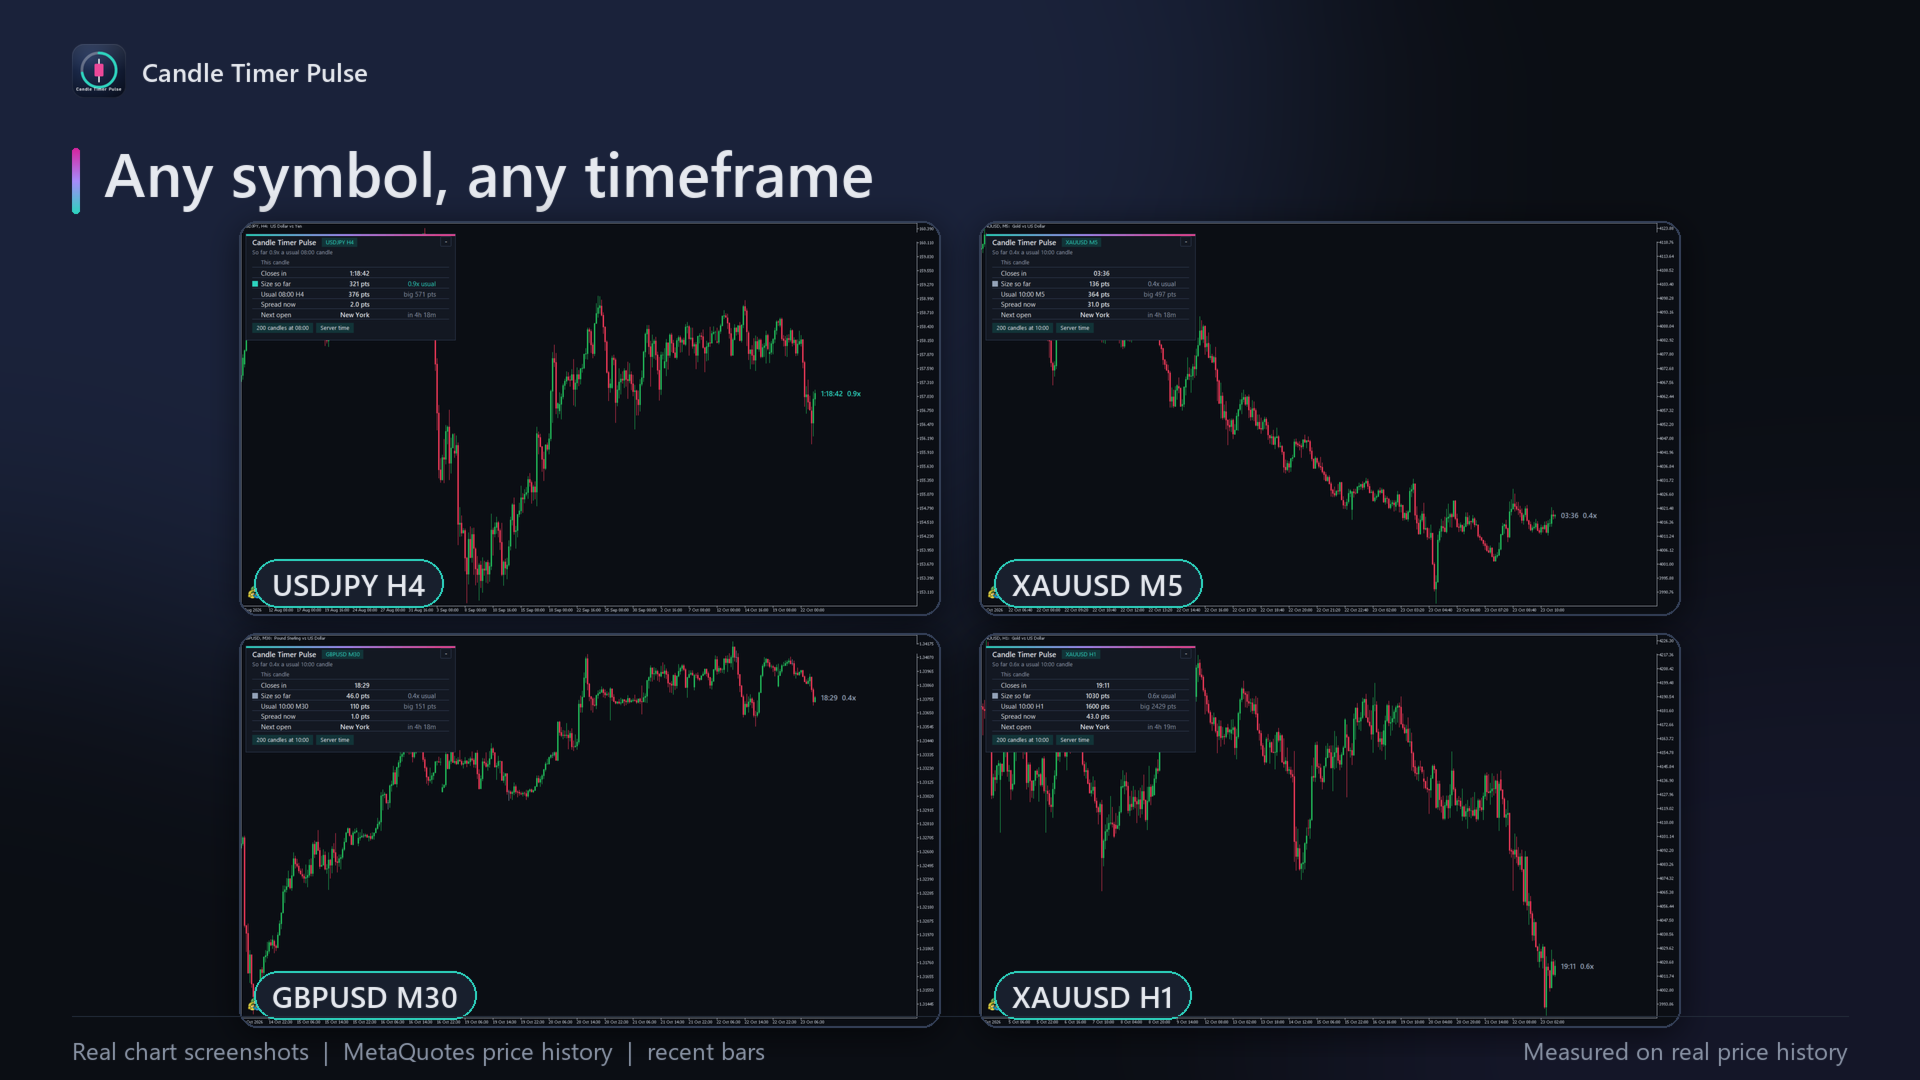
Any symbol and any timeframe, from M1 to monthly. An hour needs at least 20 past candles to be compared. Typical uses: knowing how long the current candle has left, seeing whether this candle is already large for its hour, and knowing when the next main session opens.
Inputs
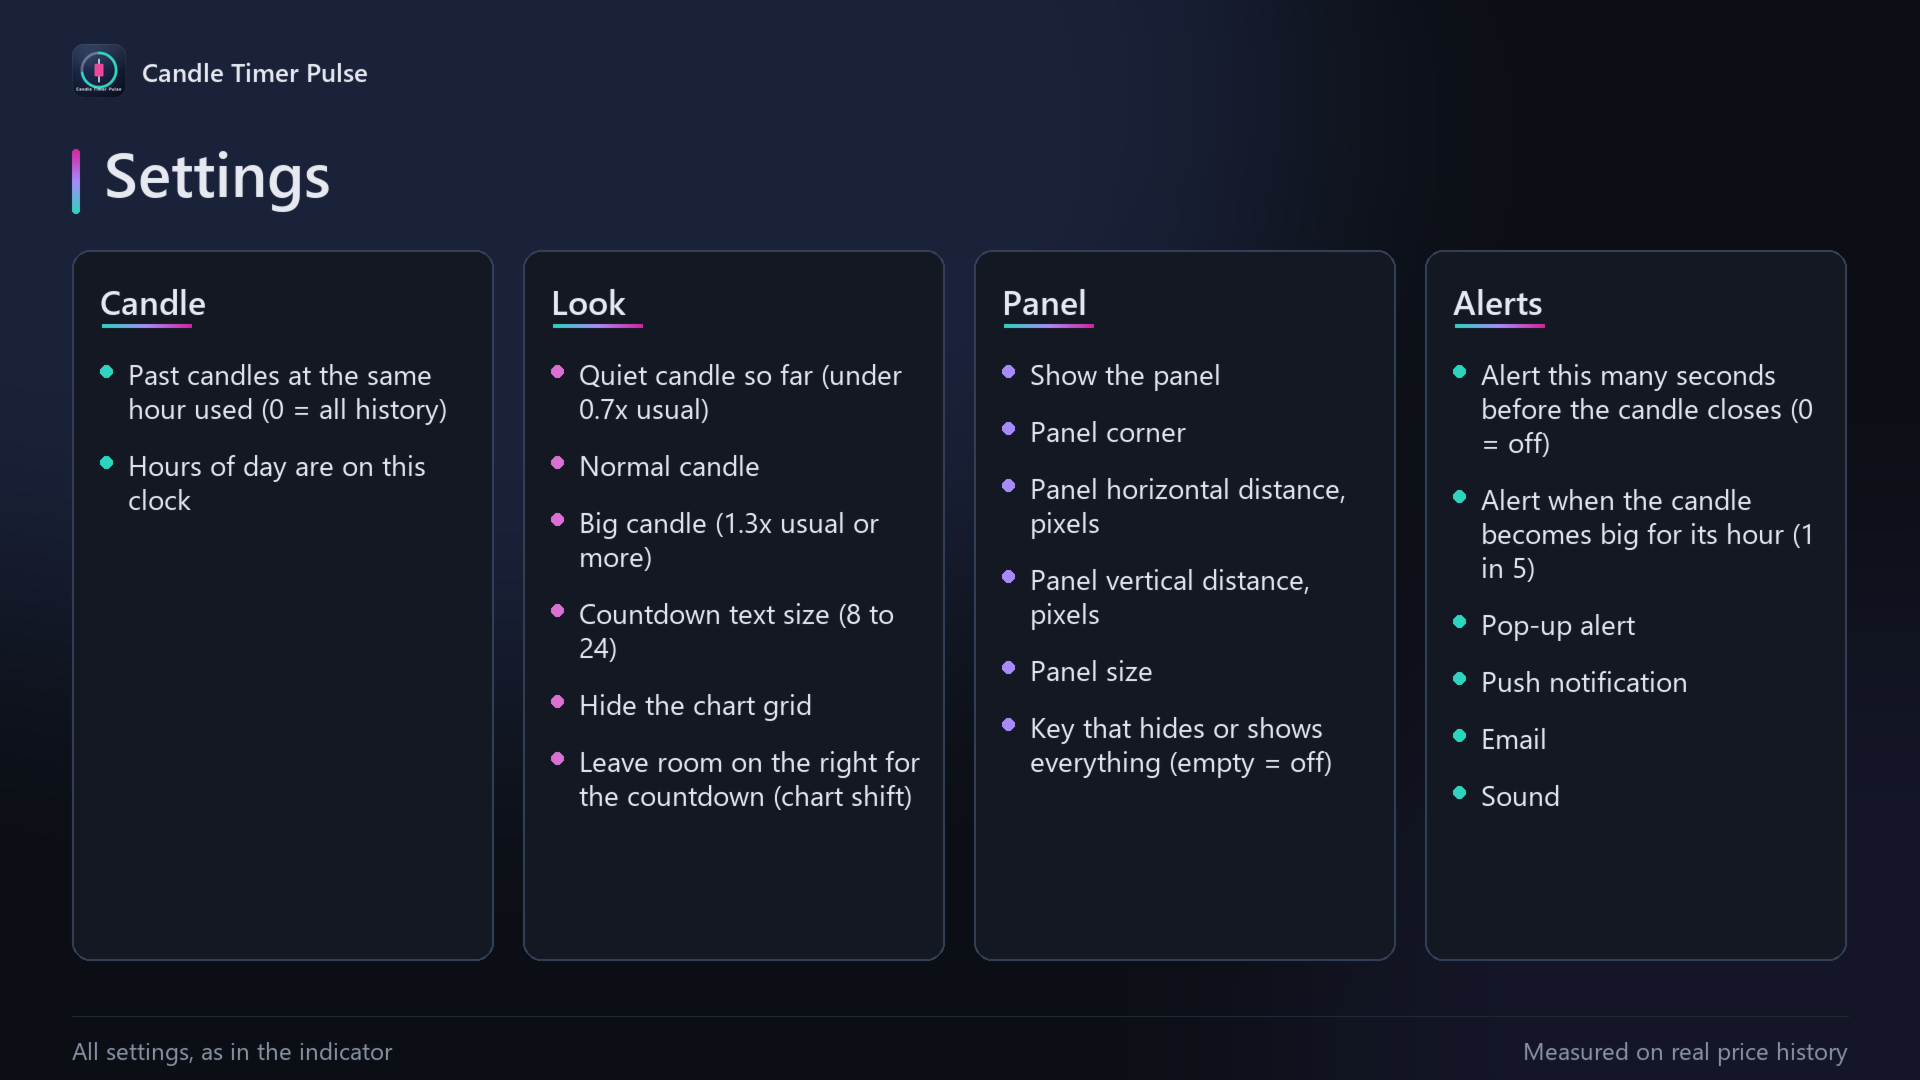
- Past candles at the same hour used: 200 by default; 0 uses all history.
- Hours of day are on this clock: broker server time (default), New York, London, Tokyo or UTC.
- Colours of quiet, normal and big candles, and the countdown text size.
- Panel: show or hide, any chart corner, distance from the edges in pixels, and size (small, normal, large). One key (H by default) hides or shows everything the indicator draws.
- Alerts: a set number of seconds before the candle closes, and when the candle becomes big for its hour (1 in 5); pop-up, push notification, email and sound, each on or off. Off by default.
- Leave room on the right for the countdown (chart shift): on by default.
- Hide the chart grid: on by default.
Risk notice
Trading forex, metals, indices and other leveraged products carries a high risk of loss. Candle Timer Pulse is an analysis tool: it does not give investment advice or trading recommendations, and it does not guarantee any result. All figures describe past data, and past behaviour does not guarantee future behaviour. You are responsible for your own trading decisions.
Support
Questions? Message me through MQL5 chat.
A full guide with pictures: https://www.mql5.com/en/blogs/post/778318