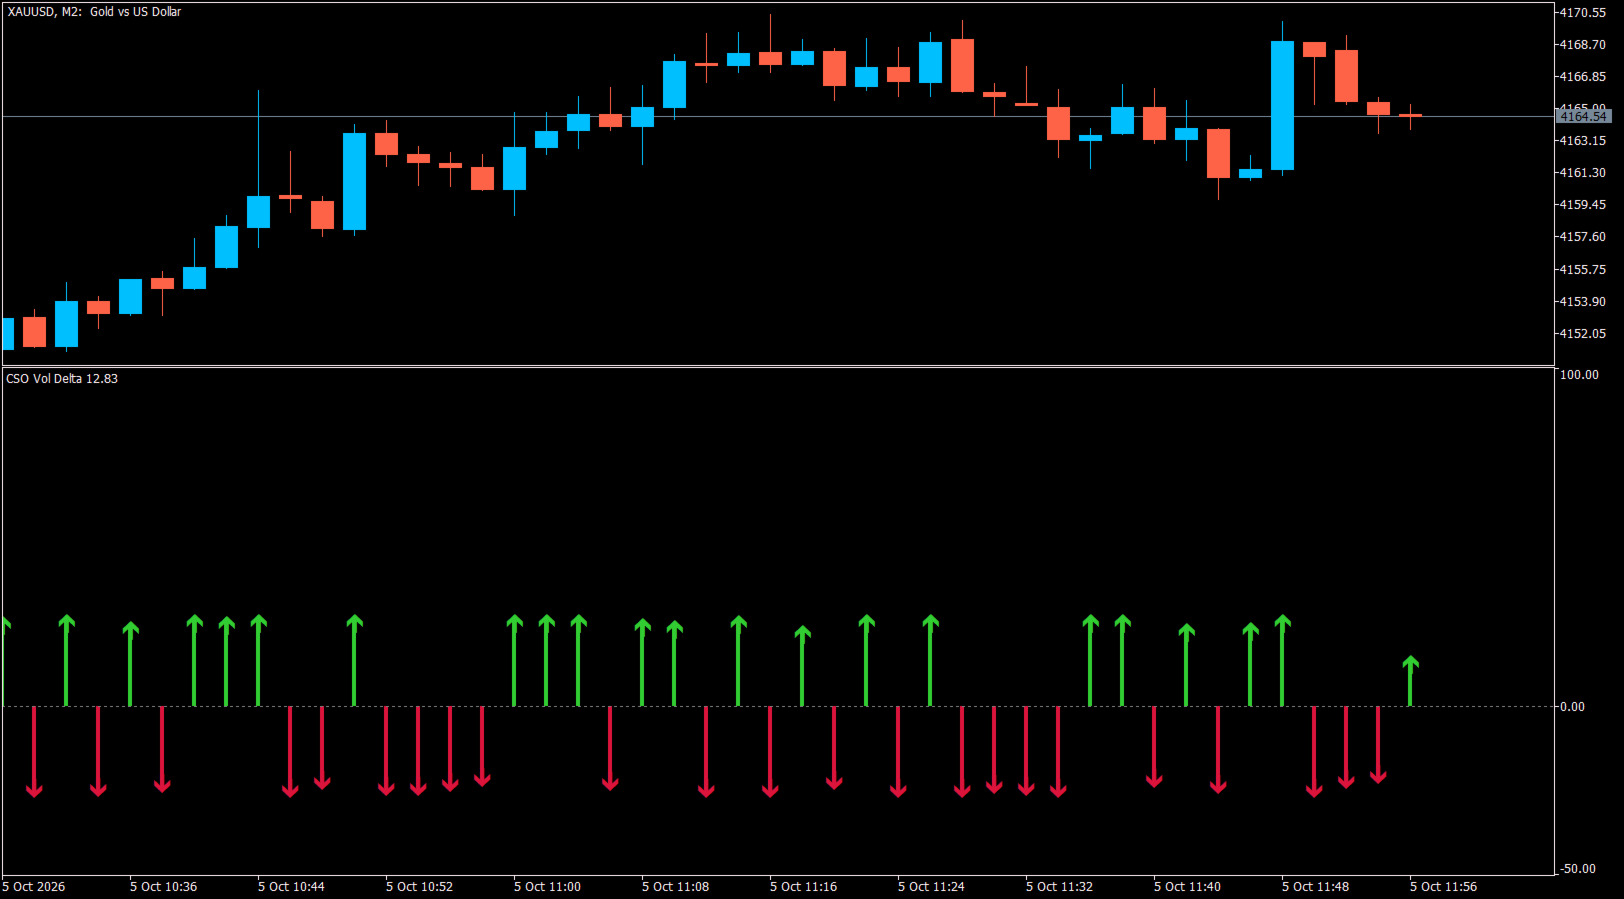
CSO Volume Delta
- Indicators
-
Nguyen Thanh Trieu
 I'm a software developer and trader. I build practical tools for MetaTrader 5 that I use in my own trading.
My work covers market structure, price action logic, risk visualization, and custom indicators and utilities. - Version: 1.1
Trading without volume data leaves you blind to market exhaustion. A trend might look strong on the price chart, but the underlying volume often dries up right before a reversal.
CSO Volume Delta plots the net difference between bullish and bearish tick volume. It measures this against an EMA baseline to print a clear histogram. You can see when buying pressure is fading at resistance, or selling pressure is dying at support.
This tool provides a direct read on market participation so you can avoid entering trades at the end of a trend.
This is a standalone tool and the free companion to the full Candle Strength Oscillator.
How It Works
- Volume Baseline: Uses a dynamic EMA to filter out normal market noise.
- Directional Histogram: Green bars show excess buying volume. Red bars show excess selling volume.
- Reversal Signals: Plots arrows on the histogram when the delta reaches extreme thresholds.
Need the complete momentum suite? View the main Candle Strength Oscillator here.