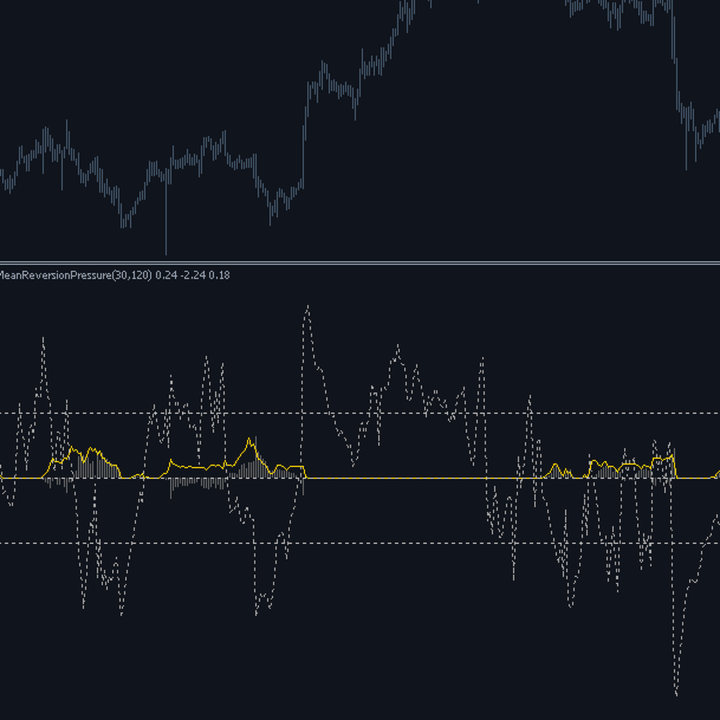
Mean Reversion Pressure
- Indicators
- Version: 1.0
- Activations: 5

# Mean Reversion Pressure - Deviation that actually pays
*Category: Oscillators | Difficulty: advanced | Window: separate window below the chart | Markets: Universal (Forex, indices, commodities, crypto, stocks) | Suggested timeframes: M30, H1, H4, D1*
## Short description
> Measures price deviation from the mean and weights it by the market actual tendency to revert, estimated on recent data. It signals only when the deviation is exploitable.
## Full description
### Overview
It is not enough for price to be far from the mean to make betting on a return worthwhile: that market, at that moment, must actually have a tendency to revert. This is the distinction separating a mean reversion strategy that works from one that loses money systematically. This indicator combines both pieces of information. It measures price deviation from its own mean in standard deviations and weights it by a reversion coefficient estimated on recent data: the correlation, sign flipped, between a bar deviation and the next bar change. When the coefficient is high the market genuinely tends to revert and the deviation becomes a signal; when it is zero or negative the market is persistent and the same deviation should simply be ignored.
### How the calculation works
1. The deviation is the difference between price and moving average, divided by the standard deviation of that same window.
2. For every past bar the change realized on the following bar is recorded.
3. The reversion coefficient is the correlation between deviation and subsequent change, sign flipped.
4. The estimation window starts from the previous bar and goes back: it only uses pairs where both terms have already been observed.
5. A negative coefficient indicates a persistent market and is zeroed: in that case there is no reversion pressure to measure.
6. The pressure is the sign flipped deviation multiplied by the coefficient: it is zero when the market does not revert, however far price has gone.
### How to use it
- Trade only when the pressure exceeds the threshold: a large deviation with a zero coefficient is not an opportunity.
- Compare the histogram with the grey raw deviation line: when they diverge sharply, the market is not reverting.
- The gold coefficient line alone is an excellent regime filter: high means a market suited to reversion strategies.
- A coefficient collapsing while the deviation stays high signals a sideways phase is turning into a trend.
- Do not use it in isolation: it says the conditions for a reversion exist, not that the reversion will happen now.
### Who it is for and on which timeframes
It targets mean reversion traders who need to know when to switch off, and developers building systems with adaptive logic. It works from M30 to D1. It requires a minimal grasp of the correlation concept, otherwise the coefficient risks being ignored and the indicator reduced to a plain deviation meter, losing all its value. It is the most conceptually dense of the category and is not for traders looking for a tool to apply without understanding it.
### Practical example of reading a signal
On EURCHF H1 price sits two standard deviations above the mean: the grey deviation line is high and a mean reversion trader would be tempted to sell. But the gold coefficient is at zero: over the last one hundred and twenty bars positive deviations were not followed by declines, quite the opposite. The histogram therefore stays in the grey zone and flags nothing. Two weeks later the coefficient rises markedly and, at the same two standard deviation stretch, the histogram exceeds the threshold and turns red. The difference between the two moments is not in price, equally far from the mean, but in how the market behaves around that deviation.
## Input parameters
| Parameter | Default | Description |
|---|---|---|
| `InpMaPeriod` | 30 | Period of the reference average the deviation is measured from. |
| `InpStatWin` | 120 | Window over which the reversion coefficient is estimated. Below 60 the estimate is too unstable to be usable. |
| `InpSignalLevel` | 1.20 | Pressure beyond which the signal is deemed relevant and the histogram is coloured. |
| `InpAppliedPrice` | PRICE_CLOSE | Price the average and deviation are computed on. |
## Advantages / strengths
- It separates exploitable deviation from useless deviation, a distinction no ordinary deviation oscillator makes.
- The reversion coefficient alone is an excellent regime filter, usable independently as well.
- The estimation window uses only fully observed pairs: no future information enters the computation.
- It shows both the raw and the weighted deviation, making the contribution of the coefficient visible.
## Limitations and warnings
- The correlation between deviation and subsequent change is typically weak: the coefficient often stays at low values.
- The coefficient estimate is itself subject to error and can vary noticeably from bar to bar.
- The scale factors used to make the lines readable on the chart are conventional and carry no absolute meaning.
- It is the hardest of the category to interpret correctly without having read the documentation.
**No repaint:** values printed on a closed bar are never modified afterwards.
**Disclaimer.** This product is a technical analysis tool, not an automated trading system, and it offers no profit guarantee whatsoever. Financial markets carry the risk of total loss of the invested capital. Past performance is not indicative of future results. Every signal must be confirmed with your own analysis, a money management plan and prior testing on a demo account. The author is not responsible for trading decisions taken on the basis of this indicator.
## Suggested tags / keywords for MQL5
`mean reversion`, `oscillator`, `correlation`, `regime`, `deviation`, `statistics`, `no repaint`, `adaptive`