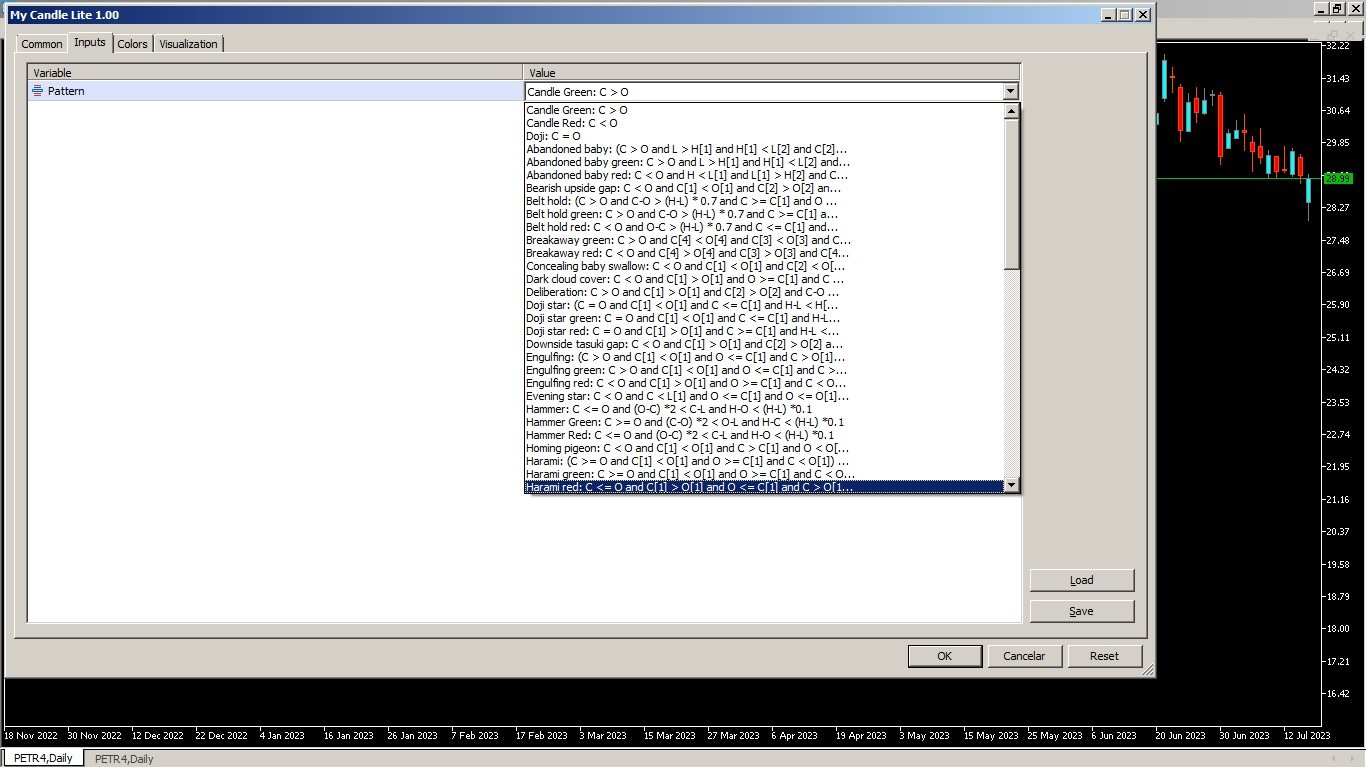
• Overview
  • Reviews (1)
  • Comments

My Candle Patterns

5

This indicator is a demo version of the complete My candle, which can be downloaded here: Candle Patterns Creator

With the full version, you can create your own candle rules and modify a traditional candle pattern to be more accurate according to your strategy.

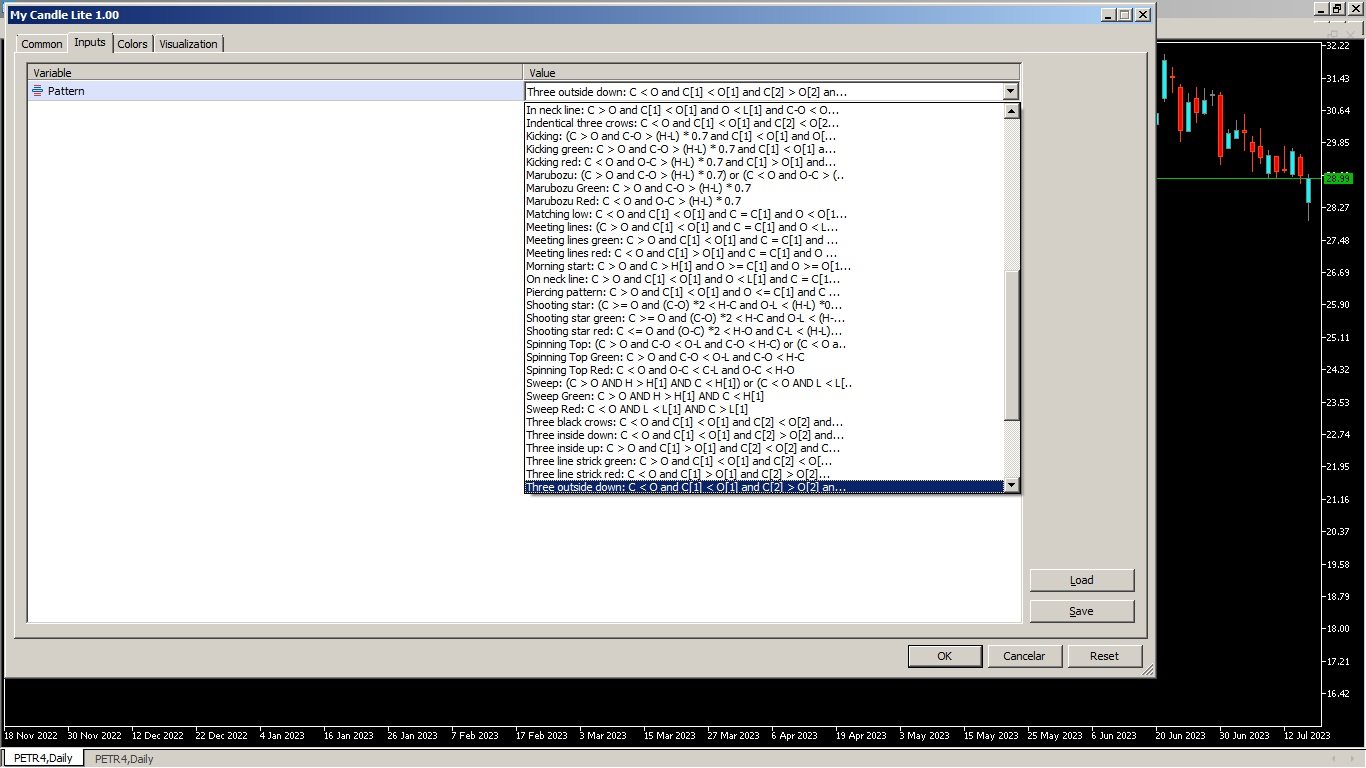
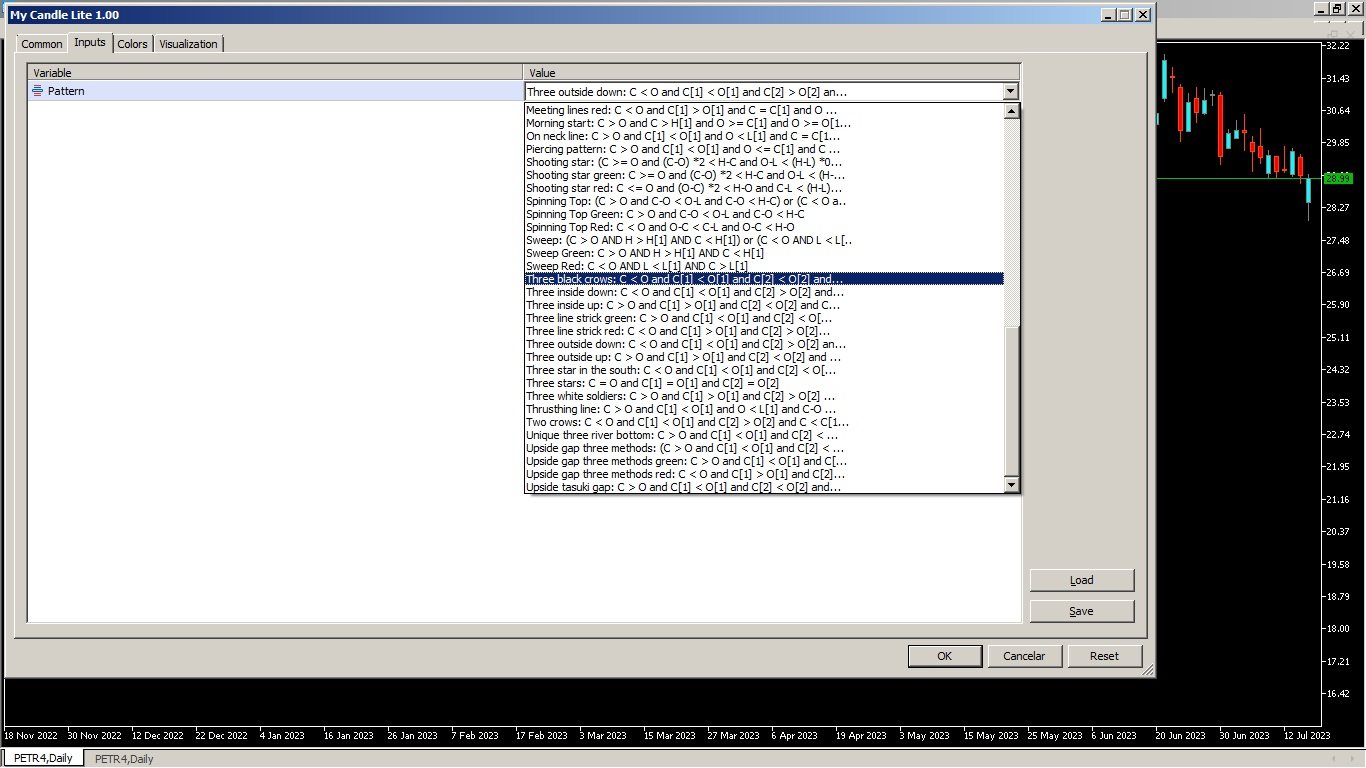
The indicator includes several example candle rules, but here I will demonstrate only a few:
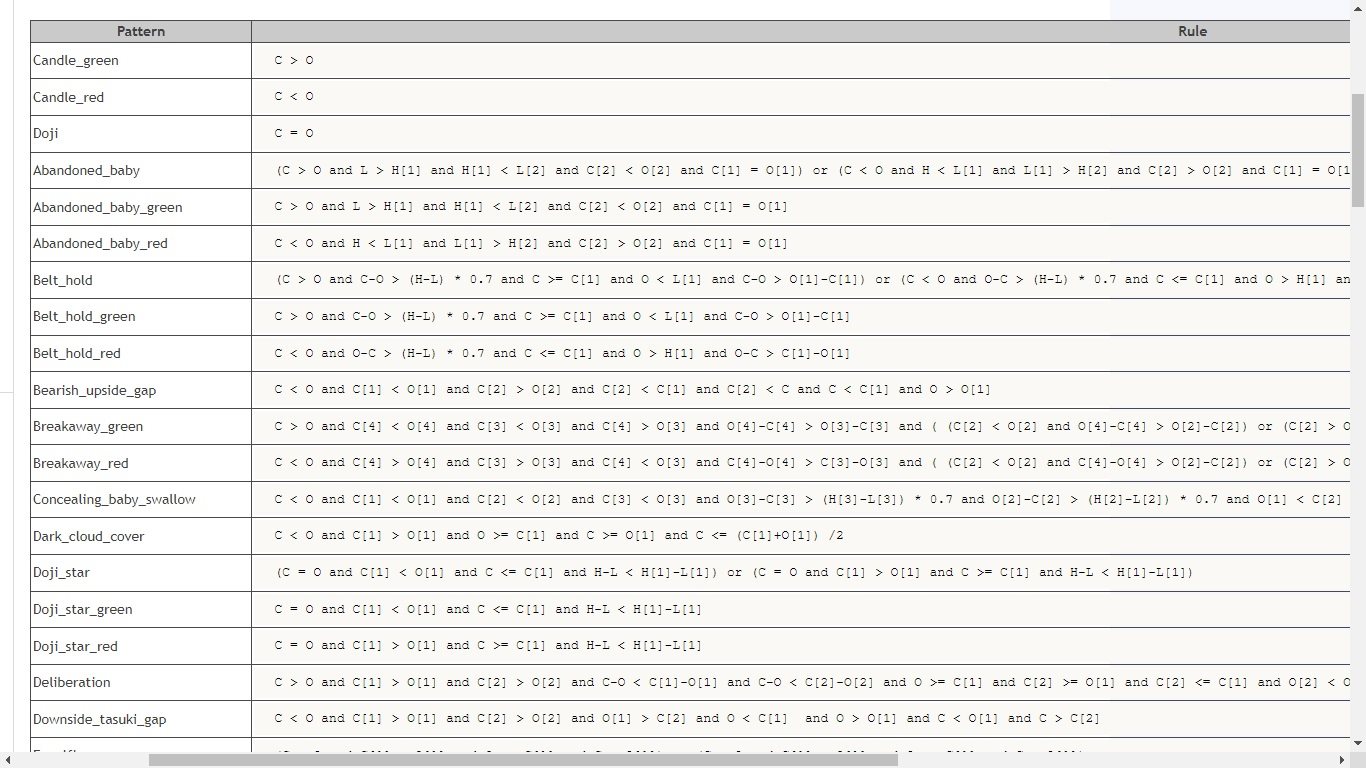
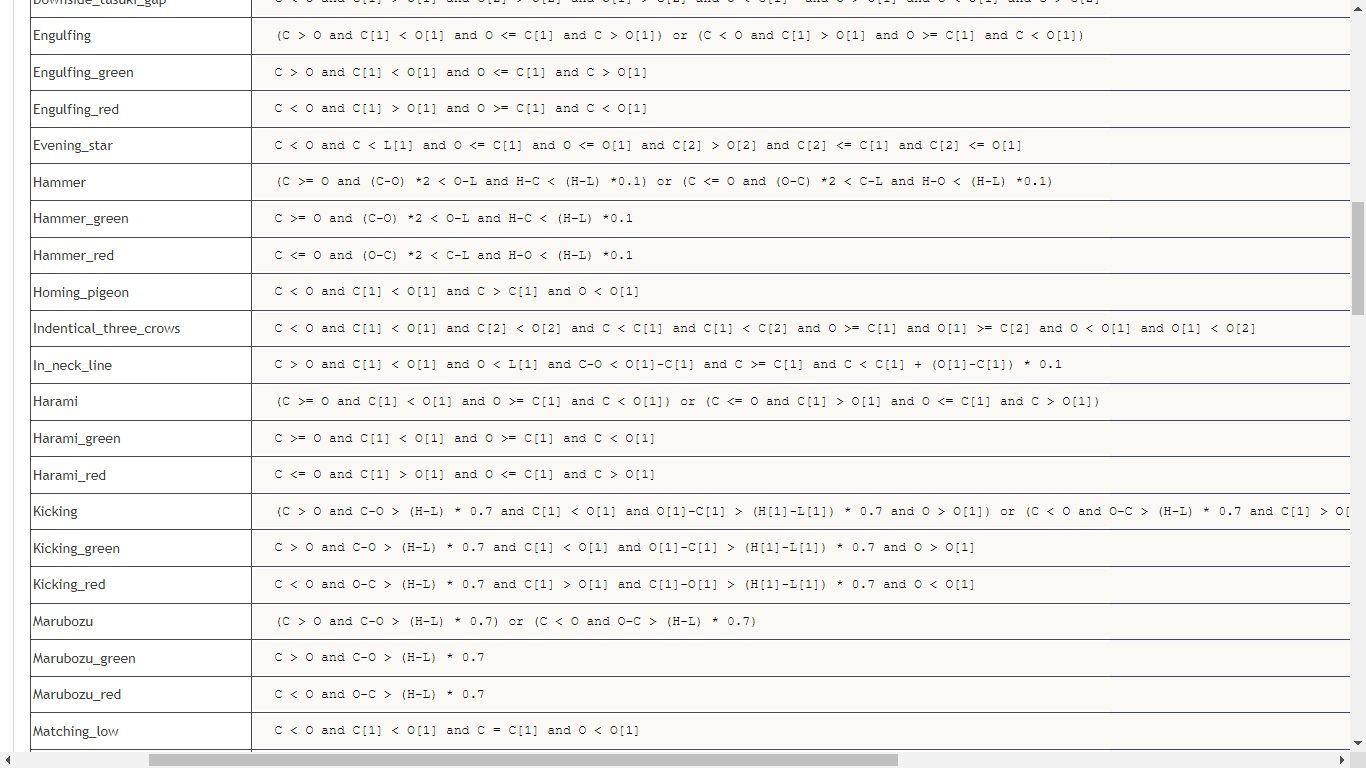
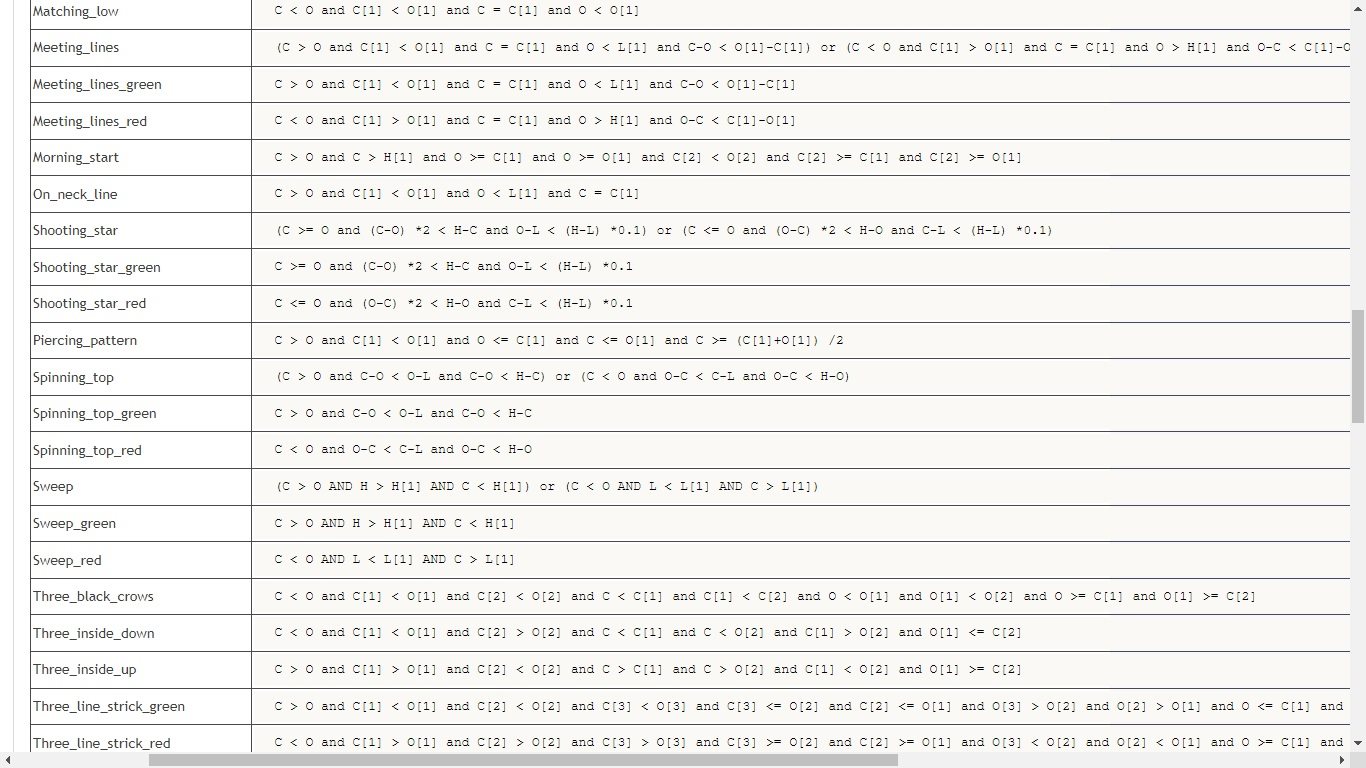
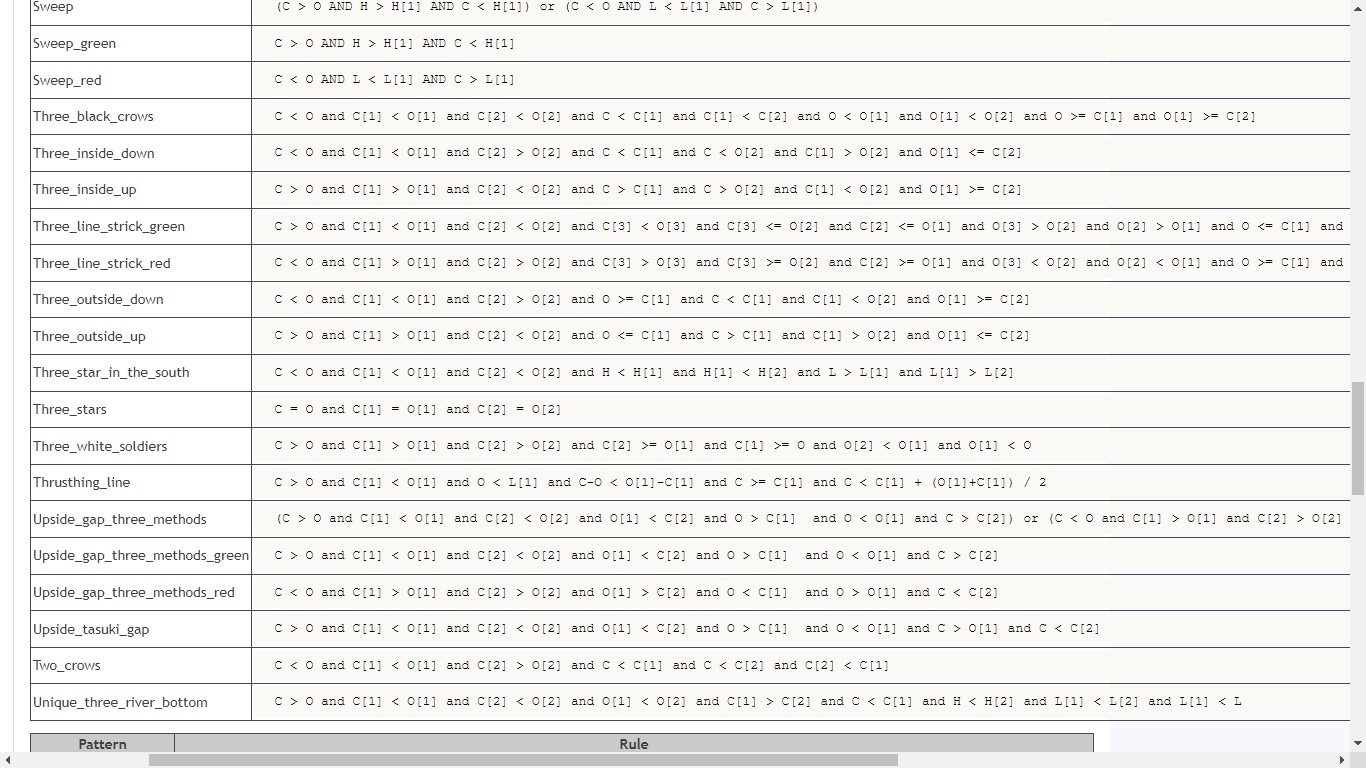
Pattern Rule
Candle Green
C > O
Candle Red
C < O
Doji
C = O
Hammer
(C > O and (C-O) *2 < O-L and (C-O) *0.5 > H-C) or (C < O and (O-C) *2 < C-L and (O-C) *0.5 > H-O)
Hammer Green
C > O and (C-O) *2 < O-L and (C-O) *0.5 > H-C
Hammer Red
C < O and (O-C) *2 < C-L and (O-C) *0.5 > H-O
Marubozu 
(C > O and C-O > (H-L) * 0.7) or (C < O and O-C > (H-L) * 0.7)
Marubozu Green 
C > O and C-O > (H-L) * 0.7
Marubozu Red 
C < O and O-C > (H-L) * 0.7
Spinning Top
(C > O and C-O < O-L and C-O < H-C) or (C < O and O-C < C-L and O-C < H-O)
Spinning Top Green
C > O and C-O < O-L and C-O < H-C
Spinning Top Red
C < O and O-C < C-L and O-C < H-O

Candle pattern formed with 1 candle

  • candle green
  • candle red
  • doji
  • hammer
  • hammer green
  • hammer red
  • marubozu
  • marubozu green
  • marubozu red
  • shooting star
  • shooting star green
  • shooting star red
  • spinning top
  • spinning top green
  • spinning top red

Candle pattern formed with 2 candle

  • Belt hold
  • Belt hold green
  • Belt hold red
  • Dark cloud cover
  • Doji star
  • Doji star green
  • Doji star red
  • Engulfing
  • Engulfing green
  • Engulfing red
  • Homing pigeon
  • In neck line
  • Harami
  • Harami green
  • Harami red
  • Kicking
  • Kicking green
  • Kicking red
  • Matching low
  • Meeting lines
  • Meeting lines green
  • Meeting lines red
  • On neck line
  • Piercing pattern
  • Sweep
  • Sweep green
  • Sweep red
  • Thrusthing line

Candle pattern formed with 3 candle

  • Abandoned baby
  • Abandoned baby green
  • Abandoned baby red
  • Bearish upside gap
  • Deliberation
  • Downside tasuki gap
  • Evening star
  • Indentical three crows
  • Morning start
  • Three black crows
  • Three inside down
  • Three inside up
  • Three outside down
  • Three outside up
  • Three star in the south
  • Three stars
  • Three white soldiers
  • Upside gap three methods
  • Upside gap three methods green
  • Upside gap three methods red
  • Upside tasuki gap
  • Two crows
  • Unique three river bottom

Candle pattern formed with 4 candle

  • Concealing baby swallow
  • Three line strick green
  • Three line strick red

Candle pattern formed with 5 candle

  • Breakaway green
  • Breakaway red
Reviews 1
windy99
88
windy99 2024.01.31 13:46 
 

good

Recommended products
Simple Weis Wave
Jean Jacques Huve Ribeiro
4.2 (5)
One of the best tools for analyzing volume, Weis Wave was idelized by David Weis, to facilitate the reading of directional flow. For the VSA method disciples it is an evolution of the practices created by Richard Wycoff, facilitating a predictive reading of the market, always seeking an accumulation and distribution of the negotiated contracts. Cumulative wave volume  Range of wave ( removed) Average Wave volume Ref "Tim Ord lectures" ( removed)
FREE
Automatic Trendlines
Pasi Hakamaki
4.63 (49)
The indicator draws trendlines on chart. This indicator has six inputs. User can specify alternative labels for both lines. If multiple instances of the indicator are used, the labels must differ. User can set width and color of the lines and depth which specifies what significant peaks should be used. For example, Depth=10 sets trendlines using the current peaks and valleys that have at least 10 bars to the right and to the left and that have highs/lows less/greater than the peak's high/low. In
FREE
LT Donchian Channel
Thiago Duarte
4.75 (4)
Donchian Channel is an indicator created by Richard Donchian. It is formed by taking the highest high and the lowest low of the last specified period in candles. The area between high and low is the channel for the chosen period. Its configuration is simple. It is possible to have the average between the upper and lower lines, plus you have alerts when price hits one side. If you have any questions or find any bugs, please contact me. Enjoy!
FREE
Important Lines
Terence Gronowski
4.88 (26)
This indicator displays Pivot-Lines, preday high and low, preday close and the minimum and maximum of the previous hour. You just have to put this single indicator to the chart to have all these important lines, no need to setup many single indicators. Why certain lines are important Preday high and low : These are watched by traders who trade in a daily chart. Very often, if price climbs over or falls under a preday low/high there is an acceleration in buying/selling. It is a breakout out of
FREE
Pivot Point Supertrend (corresponds to Pivot Point Super Trend indicator from Trading View) Pivot Point Period:    Pivot point defined as highest high and highest low... input 2 = defining highest high and highest low with 2 bars on each side which are lower (for highest high) and are higher (for lowest low calculation) ATR Length  : the  ATR  calculation is based on 10 periods ATR Factor: ATR multiplied by 3
FREE
Rainbow MT5
Jamal El Alama
4.33 (3)
Description : Rainbow MT5 is a technical indicator based on Moving Average with period 34 and very easy to use. When price crosses above MA and MA changes color to green, then this is a signal to buy. When price crosses below MA and MA changes color to red, then this is a signal to sell. The Expert advisor ( Rainbow EA MT5 ) based on Rainbow MT5 indicator is now available here . MT4 version is available here .
FREE
Are you tired of drawing trendlines every time you're analyzing charts? Or perhaps you would like more consistency in your technical analysis. Then this is for you. This indicator will draw trend lines automatically when dropped on a chart. How it works Works similar to standard deviation channel found on mt4 and mt5. It has 2 parameters: 1. Starting Bar 2. Number of bars for calculation The   starting bar   is the bar which drawing of the trend lines will begin, while the   number of bars for c
FREE
Follow The Line MT5
Oliver Gideon Amofa Appiah
4.42 (31)
This indicator obeys the popular maxim that: "THE TREND IS YOUR FRIEND" It paints a GREEN line for BUY and also paints a RED line for SELL. (you can change the colors). It gives alarms and alerts of all kinds. IT DOES NOT REPAINT and can be used for all currency pairs and timeframes. Yes, as easy and simple as that. Even a newbie can use it to make great and reliable trades. NB: For best results, get my other premium indicators for more powerful and reliable signals. Get them here: https://www.m
FREE
The   Pivot Point indicator   automatically calculates and displays the pivot point line and support and resistance levels. Pivot can be calculated according to the Classic, Floor, Fibonacci, Woodie, Camarilla or DeMark formula. It is also possible to select the period for calculating the indicator. A trader can choose from daily, weekly, monthly, or user-defined periods. Types of pivots Classic Floor Fibonacci Woodie Camarilla DeMark Main features The indicator shows the current and histor
FREE
Pivot Point Fibo RSJ is an indicator that traces the support and resistance lines of the day using Fibonacci rates. This spectacular indicator creates up to 7 levels of support and resistance through Pivot Point using Fibonacci rates. It is fantastic how the prices respect each level of this support and resistance, where it is possible to perceive possible entry/exit points of an operation. Features Up to 7 levels of support and 7 levels of resistance Set the colors of the levels individual
FREE
Get ALERTS for break of your TRENDLINES, SUPPORT LINES, RESISTANCE LINE, ANY LINE!! 1. Draw a line on the chart (Trend, support, resistance, whatever you like) and give it a name (e.g. MY EURUSD line) 2. Load the Indicator and input the Line Name the same name in Indicator INPUT so system knows the name of your line (= MY EURUSD line) 3. Get Alerts when Price breaks the line and closes Works on All Time frames and charts LEAVE A COMMENT AND IF THERE IS ENOUGH INTEREST I WILL WRITE AN EA WHICH
FREE
Reversal Composite Candles
MetaQuotes Ltd.
3.43 (23)
The idea of the system is to indentify the reversal patterns using the calculation of the composite candle. The reversal patterns is similar to the "Hammer" and "Hanging Man" patterns in Japanese candlestick analysis. But it uses the composite candle instead the single candle and doesn't need the small body of the composite candle to confirm the reversal. Input parameters: Range - maximal number of bars, used in the calculation of the composite candle. Minimum - minimal size of the composite can
FREE
Free automatic Fibonacci is an indicator that automatically plots a Fibonacci retracement based on the number of bars you select on the BarsToScan setting in the indicator. The Fibonacci is automatically updated in real time as new highest and lowest values appears amongst the selected bars. You can select which level values to be displayed in the indicator settings. You can also select the color of the levels thus enabling the trader to be able to attach the indicator several times with differe
FREE
AliPivot Points is a Meta Trader 5 Indicator that draws you the latest pivot points. You can choose from timeframes ranging from 1 Minute to 1 Month. Calculation methods for pivot points includes: Classic Pivot Points Camarilla Pivot Points Fibonacci Pivot Points Woodie Pivot Points You can personalize the line colors, style, and width to suit your preference. The indicator displays values on the right side of the chart. AliPivot Points values can also be utilized by developers for creating Expe
FREE
The selective pin bar is designed to identify reversals. To use the selective pin bar effectively, traders typically look for Strong Rejection: The tail of the pin bar should extend significantly beyond the surrounding price action. It indicates that there was a sharp rejection of higher or lower prices during the trading period. A strong rejection suggests that the market sentiment may be changing.
FREE
PZ Lopez Flow MT5
PZ TRADING SLU
4.5 (4)
This indicator studies price action as an aggregation of price and time vectors, and uses the average vector to determine the direction and strength of the market. This indicator highlights the short-term directionality and strength of the market, and can be used to capitalize from short-term price movements by trading breakouts or binary options.  [ Installation Guide | Update Guide | Troubleshooting | FAQ | All Products ] Find market direction easily Confirm with breakouts or other indicators
FREE
This indicator is stand alone version from  MP Pivot Levels  (All in one) containing Woodie Pivots. Woodie’s pivot points are made up of multiple key levels, calculated from past price points, in order to frame trades in a simplistic manner. The key levels include the ‘pivot’ itself, and multiple support and resistance levels (usually up to three each). Traders use these levels as a guide for future price movements when setting up trades. The pivot : (Previous high + previous low + 2 x previou
FREE
This indicator is stand alone version from  MP Pivot Levels  (All in one) containing Demark's Pivots. Calculations:     PP = X / 4     R1 = X / 2 - LOWprev     S1 = X / 2 - HIGHprev Uses: When the pair currency price may change the direction of movement. Possible constraints of support and resistance that creates plateaus for the currency pair prices. Tendency identification by comparing the present prices according to current day's pivot point and also the prior day's pivot points. ___________
FREE
Tabajara V5
Flavio Javier Jarabeck
4.87 (38)
Metatrader 5 version of the famous Andre Machado's Tabajara indicator. If you don't know Andre Machado's Technical Analysis work you don't need this indicator... For those who need it and for those several friend traders who asked this porting from other platforms, here it is... FEATURES 8-period Moving Average 20-period Moving Average 50-period Moving Average 200-period Moving Average Colored candles according to the inflexion of the 20-period MA SETTINGS You can change the Period of all M
FREE
Waves Sizer
Flavio Javier Jarabeck
3.67 (6)
Wyckoff fans, enjoy! Ideally to be used with the Weis Waves indicator, but it can be easily used alone, the Waves Sizer puts the range (in resulting Price movement) done by the Price on its market swings. You can control how accurate or loose will be the swings. This tool is very helpful for visually know how much the Price has traveled in your Timeframe. This way you can confront this level of effort with the resulting Volume, etc... Weis Waves indicator: https://www.mql5.com/en/market/pro
FREE
What is this indicator? This indicator is the MACD (Moving Average Convergence/Divergence) supporting Virtual Trading mode of  Knots Compositor . When the mode is turned on, the indicator will be recalculated based on the displayed candlesticks. When the mode is turned off, the indicator will be recalculated based on the original chart candlesticks. Types of the applied price - Close - Open - High - Low - Median Price (HL/2) - Typical Price (HLC/3) - Weighted Price (HLCC/4) KC-Indicators
FREE
Auto Midas VWAP
Paulo Henrique Faquineli Garcia
AUTO MIDAS VWAP Volume Weighted Average Price (VWAP) is a trading benchmark commonly used by Big Players that gives the average price a Symbol has traded throughout the day. It is based on both Volume and price. Commonly, MIDAS VWAP damand you to determine the initial point of analysis. This indicator plots automatically based on ZigZag Approach. You will be able to use up to 3 HIGH MIDAS VWAP's and 3 LOW MIDAS VWAP's. Wish the best trade results!!
Swiss VWAPsimple
Terence Gronowski
5 (4)
Swiss VWAPsimple Motivation Did not find free VWAP that works, the one that I found craseh. So I created a VWAP which calculates values only for the actual day. So computer resouces are not over stressed. What is VWAP, how is it used?  VWAP stands for Volume Weighed Average Price, it calculates the running sum of tick volume and the runnung sum of price times tickvolume. The division of these sums result in a weighed price (Sum P*V/Sum V). The calculation starts normally at midnight. The value
FREE
Value Chart Candlesticks
Flavio Javier Jarabeck
4.67 (9)
The idea of a Value Chart indicator was presented in the very good book I read back in 2020 , " Dynamic Trading Indicators: Winning with Value Charts and Price Action Profile ", from the authors Mark Helweg and David Stendahl. The idea is simple and the result is pure genius: Present candlestick Price analysis in a detrended way! HOW TO READ THIS INDICATOR Look for Overbought and Oversold levels. Of course, you will need to test the settings a lot to find the "correct" one for your approach.
FREE
This indicator sums up the difference between the sells aggression and the buys aggression that occurred in each Candle, graphically plotting the waves of accumulation of the aggression volumes.   Through these waves an exponential average is calculated that indicates the direction of the business flow. Note: This indicator DOES NOT WORK for Brokers and/or Markets WITHOUT the type of aggression (BUY or SELL).   Be sure to try our Professional version with configurable features and alerts:  Agr
FREE
Weis Waves
Flavio Javier Jarabeck
3.15 (26)
The original author is David Weis, an expert in the Wyckoff Method. The Weis Wave is a modern adaptation of the 1930's Wyckoff Method, another expert in Tape Reading techniques and Chart Analysis. Weis Waves takes market volume and stacks it into waves according to price conditions giving the trader valuable insights about the market conditions. If you want to learn more about this subject you can find tons of videos in YouTube. Just look for "The Wickoff Method", "Weis Wave" and "Volume Spread
FREE
MIDAS Super VWAP
Flavio Javier Jarabeck
4.29 (14)
Imagine VWAP, MVWAP and MIDAS in one place... Well, you found it! Now you can track the movement of Big Players in various ways, as they in general pursue the benchmarks related to this measuring, gauging if they had good execution or poor execution on their orders. Traders and analysts use the VWAP to eliminate the noise that occurs throughout the day, so they can measure what prices buyers and sellers are really trading. VWAP gives traders insight into how a stock trades for that day and deter
FREE
Dual RSI
Paul Conrad Carlson
Indicator alerts for Dual Relative strength index rsi. Large rsi preset at 14 is below 30 small rsi preset at 4 is below 10 for buy bullish signals . Large rsi preset are 14 is above 70 small rsi preset at 4 is above 90 for sell bearish signals . Includes mobile and terminal alerts. draws lines when alerts. This indicator can help identify extremes and then the tops or bottoms of those extremes .
FREE
PZ Penta O MT5
PZ TRADING SLU
4 (6)
The Penta-O is a 6-point retracement harmonacci pattern which usually precedes big market movements. Penta-O patterns can expand and repaint quite a bit. To make things easier this indicator implements a twist: it waits for a donchian breakout in the right direction before signaling the trade. The end result is an otherwise repainting indicator with a very reliable trading signal. The donchian breakout period is entered as an input. [ Installation Guide | Update Guide | Troubleshooting | FAQ | A
FREE
Camarilla Swing Trade Indicator
Chayakorn Rakwongthai
4 (1)
Camarilla Swing Trade Indicator is an Indicator. Support and resistance points are calculated from the High Low Close of the previous TF Week's price. What are Camarilla Pivot Points? 1.Camarilla Pivot Points is a modified version of the classic Pivot Point. 2.Camarilla Pivot Points was launched in 1989 by Nick Scott, a successful bond trader. 3.The basic idea behind Camarilla Pivot Points is that price tends to revert to its mean until it doesn't. 4.Camarilla Pivot Points is a mathematical
FREE
Buyers of this product also purchase
First of all Its worth emphasizing here that this Trading System is Non-Repainting , Non-Redrawing and Non-Lagging Indicator , Which makes it ideal from both manual and robot trading .  The Smart Trend Trading System MT5 is a comprehensive trading solution tailored for new and experienced traders . It combines over 10 premium indicators and features more than 7 robust trading strategies , making it a versatile choice for diverse market conditions . Trend Following Strategy : Provides precise ent
Atomic Analyst MT5
Issam Kassas
4.27 (11)
First of all Its worth emphasizing here that this Trading Indicator is   Non-Repainting ,   Non-Redrawing   and   Non-Lagging   Indicator, Which makes it ideal from both manual and robot trading.  The Atomic Analyst  is a PA Price Action Indicator that uses Strength and Momentum of the price to find a better edge in the market. Equipped with an AI filter which help remove noises and false signals, and Increase Trading Potential. Using Multiple layers of complex Indicators, the Atomic Analyst
FX Volume MT5
Daniel Stein
4.94 (17)
Visit our all-new   Stein Investments Welcome Page   to get the latest information, updates and trading strategies. FX Volume is the FIRST and ONLY volume indicator that provides a REAL insight into the market sentiment from a broker's point of view. It provides awesome insights into how institutional market participants, like brokers, are positioned in the Forex market, much faster than COT reports. Seeing this information directly on your chart is the real game-changer and breakthrough solut
Quantum Trend Sniper
Bogdan Ion Puscasu
5 (37)
Introducing   Quantum Trend Sniper Indicator , the groundbreaking MQL5 Indicator that's transforming the way you identify and trade trend reversals! Developed by a team of experienced traders with trading experience of over 13 years,   Quantum Trend Sniper Indicator   is designed to propel your trading journey to new heights with its innovative way of identifying trend reversals with extremely high accuracy. ***Buy Quantum Trend Sniper Indicator and you could get Quantum Breakout Indicator fo
Gold Stuff mt5
Vasiliy Strukov
4.89 (166)
Gold Stuff mt5 is a trend indicator designed specifically for gold and can also be used on any financial instrument. The indicator does not redraw and does not lag. Recommended time frame H1. Contact me immediately after the purchase to get   personal bonus! Settings  and manual   here   SETTINGS Draw Arrow - on off. drawing arrows on the chart. Alerts -   on off audible alerts. E-mail notification - on off. email notifications. Puch-notification - on off. Push notifications. Next, adjust the co
Trend Screener Pro MT5
STE S.S.COMPANY
4.89 (61)
Unlock the Power of  Trends trading with Trend Screener Indicator: Your Ultimate Trend Trading Solution powered by fuzzy logic and Multi-currencies System ! Elevate your trend trading with Trend Screener, the revolutionary trend indicator powered by   fuzzy logic.  It is a powerful trend-following indicator that combines over  13 premium tools and features and 3 trading strategies  , making it a versatile choice to   make your Metatrader a Trend Analyzer. LIMITED TIME OFFER : Trend Screener Indi
RelicusRoad Pro MT5
Relicus LLC
4.82 (22)
How many times have you bought a trading indicator with great back-tests, live account performance proof with fantastic numbers and stats all over the place but after using it, you end up blowing your account? You shouldn't trust a signal by itself, you need to know why it appeared in the first place, and that's what RelicusRoad Pro does best! NOW $147 (increasing to $499 after a few updates) - UNLIMITED ACCOUNTS (PCs or MACs) **  User Manual + Strategies + Training Videos + Private Group with
First of all Its worth emphasizing here that this Trading Tool is Non Repainting , Non Redrawing and Non Lagging Indicator , Which makes it ideal for professional trading . The Smart Price Action Concepts Indicator is a very powerful tool for both new and experienced traders . It packs more than 20 useful indicators into one , combining advanced trading ideas like Inner Circle Trader Analysis and Smart Money Concepts Trading Strategies . This indicator focuses on Smart Money Concepts , prov
Top indicator for MT5   providing accurate signals to enter a trade without repainting! It can be applied to any financial assets:   forex, cryptocurrencies, metals, stocks, indices .  Watch  the video  (6:22) with an example of processing only one signal that paid off the indicator! MT4 version is here It will provide pretty accurate trading signals and tell you when it's best to open a trade and close it. Most traders improve their trading results during the first trading week with the help of
FX Power MT5 NG
Daniel Stein
5 (4)
Trading GOLD, and currencies, with the dog walk strategy  - super smart Trading GOLD, and currencies, with the breakout strategy  - super easy Visit our all-new   Stein Investments Welcome Page   to get the latest information, updates and trading strategies. FX Power MT5 NG  is the next generation of our long-time very popular currency strength meter, FX Power.  And what does this next-generation strength meter offer? Everything you have loved about the original FX Power  PLUS GOLD/XAU st
Advanced Supply Demand MT5
Bernhard Schweigert
4.53 (15)
Best Solution for any Newbie or Expert Trader! This indicator is a unique, high quality and affordable trading tool because we have incorporated a number of proprietary features and a new formula. With this update, you will be able to show double timeframe zones. You will not only be able to show a higher TF but to show both, the chart TF, PLUS the higher TF: SHOWING NESTED ZONES. All Supply Demand traders will love it. :) Important Information Revealed Maximize the potential of Advanced Suppl
Auto Order Block with break of structure based on ICT and Smart Money Concepts Futures Break of Structure ( BoS )             Order block ( OB )            Higher time frame Order block / Point of Interest ( POI )    shown on current chart           Fair value Gap ( FVG ) / Imbalance   ,  MTF      ( Multi Time Frame )    Volume Imbalance     ,  MTF          vIMB Gap’s Equal High / Low’s     ,  MTF             EQH / EQL Liquidity               Current Day High / Low           HOD /
XQ Indicator MetaTrader 5
Marzena Maria Szmit
5 (1)
Step into the realm of Forex trading with confidence and precision using XQ, a cutting-edge Forex indicator designed to elevate your trading game to unprecedented heights. Whether you're a seasoned trader or just stepping into the world of currency exchange, XQ Forex Indicator empowers you with the insights and signals needed to make informed trading decisions. The signal conditions are a combination of three indicators, and XQ Forex Indicator only display  medium and long-term trends . The ind
ICT, SMC, SMART MONEY CONCEPTS, SMART MONEY, Smart Money Concept, Support and Resistance, Trend Analysis, Price Action, Market Structure, Order Blocks, BOS/CHoCH,   Breaker Blocks ,  Momentum Shift,   Supply&Demand Zone/Order Blocks , Strong Imbalance,   HH/LL/HL/LH,    Fair Value Gap, FVG, Inversion FVG, IFVG,  Premium  &   Discount   Zones, Fibonacci Retracement, OTE, Buy Side Liquidity, Sell Side Liquidity, BSL/SSL Taken, Equal Highs & Lows, MTF Dashboard, Multiple Time Frame, BigBar, HTF OB
Blahtech Supply Demand MT5
Blahtech Limited
4.57 (14)
Was: $299  Now: $99   Supply Demand uses previous price action to identify potential imbalances between buyers and sellers. The key is to identify the better odds zones, not just the untouched ones. Blahtech Supply Demand indicator delivers functionality previously unavailable on any trading platform. This 4-in-1 indicator not only highlights the higher probability zones using a multi-criteria strength engine, but also combines it with multi-timeframe trend analysis, previously confirmed swings
Profit from market structure changes as price reverses and pulls back. The market structure reversal alert indicator identifies when a trend or price move is approaching exhaustion and ready to reverse. It alerts you to changes in market structure which typically occur when a reversal or major pullback are about to happen. The indicator identifies breakouts and price momentum initially, every time a new high or low is formed near a possible exhaustion point. The indicator draws in a rectangle on
Gann Squares Indicator: Analyzing Markets with Geometric Patterns The Gann Squares indicator is a powerful tool for market analysis that draws upon the mathematical concepts introduced by W.D. Gann in his article on "Mathematical Formula for Market Predictions." This indicator incorporates Gann's techniques involving square numbers such as 144, 90, and 52, as well as the Square of 9. Additionally, it incorporates  method for utilizing the Square of 9 in conjunction with channels and the star pa
AW Trend Predictor MT5
AW Trading Software Limited
4.76 (54)
The combination of trend and breakdown levels in one system. An advanced indicator algorithm filters market noise, determines the trend, entry points, as well as possible exit levels. Indicator signals are recorded in a statistical module, which allows you to select the most suitable tools, showing the effectiveness of the signal history. The indicator calculates Take Profit and Stop Loss marks. Manual and instruction ->  HERE  / MT4 version ->  HERE How to trade with the indicator:  Trading wit
Volume by Price MT5
Brian Collard
5 (3)
The Volume by Price Indicator for MetaTrader 5 features Volume Profile and Market Profile TPO (Time Price Opportunity). Get valuable insights out of currencies, equities and commodities data. Gain an edge trading financial markets. Volume and TPO histogram bar and line charts. Volume Footprint charts. TPO letter and block marker charts including split structures. Versatile segmentation and compositing methods. Static, dynamic and flexible ranges with relative and/or absolute visualizations. Lay
TrendLine PRO MT5
Evgenii Aksenov
4.78 (49)
The Trend Line PRO indicator is an independent trading strategy. It shows the trend change, the entry point to the transaction, as well as automatically calculates three levels of Take Profit and Stop Loss protection Trend Line PRO is perfect for all Meta Trader symbols: currencies, metals, cryptocurrencies, stocks and indices Advantages of Trend Line PRO Never redraws its signals The possibility of using it as an independent strategy It has three automatic levels Take Profit and Stop Loss lev
MetaBands M5
Vahidreza Heidar Gholami
4.67 (3)
MetaBands uses powerful and unique algorithms to draw channels and detect trends so that it can provide traders with potential points for entering and exiting trades. It’s a channel indicator plus a powerful trend indicator. It includes different types of channels which can be merged to create new channels simply by using the input parameters. MetaBands uses all types of alerts to notify users about market events. Features Supports most of the channel algorithms Powerful trend detection algorith
Introducing   Quantum Breakout PRO , the groundbreaking MQL5 Indicator that's transforming the way you trade Breakout Zones! Developed by a team of experienced traders with trading experience of over 13 years,   Quantum Breakout PRO   is designed to propel your trading journey to new heights with its innovative and dynamic breakout zone strategy. Quantum Breakout Indicator will give you signal arrows on breakout zones with 5 profit target zones and stop loss suggestion based on the breako
Owl Smart Levels MT5
Sergey Ermolov
4.47 (36)
MT4 version  |   FAQ The Owl Smart Levels Indicator is a complete trading system within the one indicator that includes such popular market analysis tools as Bill Williams' advanced fractals , Valable ZigZag which builds the correct wave structure of the market, and Fibonacci levels which mark the exact levels of entry into the market and places to take profits. Detailed description of the strategy Instructions for working with the indicator Advisor-assistant in trading Owl Helper Private User
Gartley Hunter Multi
Siarhei Vashchylka
5 (5)
Gartley Hunter Multi - An indicator for searching for harmonic patterns simultaneously on dozens of trading instruments and on all classic timeframes: (m1, m5, m15, m30, H1, H4, D1, Wk, Mn). Manual (Be sure to read before purchasing) | Version for MT4 Advantages 1. Patterns: Gartley, Butterfly, Shark, Crab. Bat, Alternate Bat, Deep Crab, Cypher 2. Simultaneous search for patterns on dozens of trading instruments and on all classic timeframes 3. Search for patterns of all possible sizes. Fr
Trend Line Map Pro MT5
STE S.S.COMPANY
4.67 (9)
Trend Line Map indicator is an addons for   Trend Screener Indicator . It's working as a scanner for all signals generated by Trend screener ( Trend Line Signals ) . It's a Trend Line Scanner based on Trend Screener Indicator.  If you don't have Trend Screener Pro Indicator,   the Trend Line Map Pro will not work.     LIMITED TIME OFFER : Trend Line Map Indicator is available for only 50 $ and lifetime. ( Original price 125$ ) By accessing to our MQL5 Blog,  you can find all our premium indica
TrendDecoder Premium MT5
Christophe, Pa Trouillas
5 (1)
Identify ranges  | Get earliest signals of Trends  | Get clear exits before reversal  | Spot the Fibo levels the price will test   |  Non-repainting, non-delayed indicator - ideal for manual and automated trading - for all assets and all time units $69   for launch - then back to >>   $149 After purchase,   please contact me on this channel   for recommended and personalised settings MT4   version:  Click here Get our full method with  BladeSCALPER  and   PowerZONES What is it about? TrendDE
TPSproTREND PrO MT5
Roman Podpora
5 (5)
TPSpro TRENDPRO  - is a trend indicator that automatically analyzes the market and provides information about the trend and each of its changes, as well as giving signals for entering trades without redrawing! The indicator uses each candle, analyzing them separately. referring to different impulses - up or down impulse. Exact entry points into transactions for currencies, crypto, metals, stocks, indices!  -  Version MT4                  DETAILED DESCRIPTION        /       TRADING SETUPS       
Was: $249  Now: $99   Market Profile defines a number of day types that can help the trader to determine market behaviour. A key feature is the Value Area, representing the range of price action where 70% of trading took place. Understanding the Value Area can give traders valuable insight into market direction and establish the higher odds trade. It is an excellent addition to any system you may be using. Inspired by Jim Dalton’s book “Mind Over Markets”, this indicator is designed to suit the
Black Dragon indicator mt5
Ramil Minniakhmetov
4.82 (56)
The trend detection indicator will compliment any strategy and can also be used as an independent tool. IMPORTANT! Contact me immediately after the purchase to get instructions and a bonus!  Benefits  Easy to use; does not overload the graphic wih unnecessary information. The ability to use as filter for any strategy. Contains bult -in dynamic levels of cupport and resistange,  which can be used both, for profit taking, and for settings up stop-losses. The indicator does not change color after t
Golden Spikes Detector
Batsirayi L Marango
5 (1)
Golden Spikes Detector This indicator is based on an advanced strategy primarily for trading spikes on Boom and Crash Indices. Complex algorithms were implemented to detect high probability entries only. It alerts on potential Buy and Sell entries. To trade spikes on the Deriv or Binary broker, only take Buy Boom and Sell Cash alerts. It was optimised to be loaded on 5-minute timeframe although multiple timeframe analysis is done in the background. Features ·             Desktop pop up and sound
More from author
Supports And Resistances Lines
Francisco Gomes Da Silva
4.78 (40)
Support and Resistance zones Indicator MT5 this indicator knows how to identify tops and bottoms automaticly. This support and resistance indicator creates support lines and resistance lines based on tops and bottoms. how to make support and resistance lines. this is an indicator to make automatic support and resistance lines. how to find support level with indicator. this indicator finds tops and bottoms automaticly. The Indicator automatically creates support lines every time “Fractals” create
FREE
Sweet VWAP Anchored MT5
Francisco Gomes Da Silva
5 (3)
Save time and make more accurate decisions with Anchored VWAPs If you want to test the power of this tool, you can download the free Anchored VWAPs indicator for MT5 . In addition to this indicator working independently, it is also an extension for the free Sweet VWAP version. This is because when you click in the free version, the VWAP you see at the mouse pointer will be anchored. And for better understanding, what will be anchored there is this indicator, with all its functionalities. This in
Sweet VWAP MT5
Francisco Gomes Da Silva
4.36 (14)
Discover where major institutions are trading and optimize your investments with the Free Anchored VWAP Indicator This indicator is designed for traders specializing in anchored VWAP strategies, offering the speed to analyze VWAP behavior from specific anchor points with just your mouse cursor. Key Features: VWAP Anchoring: The main function of this indicator is to show how VWAP would behave if anchored at a point chosen by the trader. This allows for a more precise analysis of market conditions
FREE
Sweet VWAP Aux
Francisco Gomes Da Silva
4.25 (4)
Save time and make more informed decisions with Sweet VWAP Aux If you haven't already downloaded our free VWAP indicator for Metatrader 4 , do it now and experience its incredible capabilities for visualizing anchored vwap. Then come back here and get to know Sweet VWAP Aux - the perfect extension for your Sweet VWAP indicator. With just one click, Sweet VWAP allows you to anchor the VWAP indicator at the point of your choice, saving time and eliminating the need to set it up manually. In additi
Supports And Resistances Lines MTF MT4
Francisco Gomes Da Silva
4.89 (9)
Supports and Resistances, was created to help you identify tops and bottoms automatically on several different timeframes and thus plot these tops and bottoms on the current chart. Let's go to the explanation of the creation of resistances There is a rule field, which you can define what is a top and bottom the top rule is set by default like this: H[ 0 ]<=H[ 1 ] and H[ 1 ]=>H[ 2 ] Where: Element Description H  means   High [0]  means   current   candle [1]  means   previous   candle <=  m
FREE
VWAP With Alerts
Francisco Gomes Da Silva
5 (2)
This VWAP is a simple VWAP, but we have added alerts to let you know when the price touches the simple VWAP or when the price crosses the VWAP. This indicator is a traditional VWAP indicator for MetaTrader 5 (MT5). The default parameters are those of the normal VWAP, but you have the ability to use new calculations and the best part: When the price touches or crosses the VWAP, you will be notified through alerts, mobile notifications, email, or sound events. Free anchored VWAP indicator for MT5
FREE
Bar Number
Francisco Gomes Da Silva
5 (2)
Candle counter This indicator counts and identifies candles based on a longer time frame Bigger Timeframe You can choose the daily timeframe as " Bigger Timeframe ", and run it within any smaller chart. that it will count the bars based on the daily chart . If you pass as a parameter the timeframe " H1 " then the indicator will know how to count the bars inside the H1 chart you just need to run it on smaller charts. The main parameter is the " Bigger Timeframe " which is a larger timeframe than
FREE
Paula Bollinger Bands
Francisco Gomes Da Silva
5 (1)
Transform your investment strategy with the Expert Advisor for MetaTrader investor robot. Based on the powerful Bollinger Bands strategy, created by Joe Ross and dubbed Paula by renowned Brazilian trader Rodrigo Cohen, you will have access to advanced technology that will maximize your profits and minimize your risks. Don't waste any more time with old and inefficient strategies. With our investor robot, you will have access to a highly accurate algorithm that combines technical analysis of m
FREE
OHLC Shifted
Francisco Gomes Da Silva
5 (3)
Previous Day's Close and Bar Shift Indicator for MetaTrader! The Previous Day's Close and Bar Shift Indicator is a tool designed to enhance technical analysis and decision-making in trading. With this indicator, you will have access to detailed information about the opening, high, low, and closing levels of any bar, allowing for precise and comprehensive analysis of market movements. Imagine having the ability to nest one timeframe within another, enabling detailed analysis of each bar across di
FREE
VWAP With Alerts MT4
Francisco Gomes Da Silva
This VWAP is a simple VWAP, but we've incorporated notifications that inform you when the price hits or crosses the VWAP line. This indicator is a traditional VWAP indicator for MetaTrader 4 (MT4). The default parameters are those of the normal VWAP, but you have the ability to modify the VWAP calculation, and the best part: When the price touches or crosses the VWAP, you will be notified through alerts, mobile notifications, email, or sound events. Anchored VWAP indicator for MT4 . Parameters:
FREE
Sweet VWAP
Francisco Gomes Da Silva
3.67 (3)
Discover where large institutions are trading and optimize your investments with the Free Anchored VWAP Indicator for MetaTrader 4. Find out the price where large institutions are making trades with our Free Anchored VWAP Indicator for MetaTrader 4! Now you can save your valuable time by automating the plotting of your anchored VWAPs at market tops and bottoms. Our free version allows you to easily view the VWAP in real-time by following the mouse pointer on the chart. With this, you can instant
FREE
Rule Plotter
Francisco Gomes Da Silva
5 (4)
Build Your Strategy Yourself This tool allows you to develop your strategies using all the indicators available natively in MetaTrader and any indicators downloaded from the internet that use buffers to display data on the screen. This tool is another reason for you to consider MetaTrader to automate your trading strategies. With it, you can create your own strategy signals in a simple and intuitive way, using any MetaTrader indicator. How Do I Know If My Internet-Downloaded Indicator Uses Buffe
FREE
Auto Anchored VWAPs
Francisco Gomes Da Silva
Unveil Trading Insights with Auto Anchored VWAPs: Auto Anchored VWAPs serve as your guiding companion in the world of trading. These indicators pinpoint crucial market turning points and illustrate them on your chart using VWAP lines. This is a game-changer for traders who employ anchored VWAP strategies. How Does It Work? Identifying High Points: If the highest price of the current candle is lower than the highest price of the previous one, And the previous high is higher than the one before it
FREE
Bar Counter MT4
Francisco Gomes Da Silva
5 (6)
candlestick counter indicator this indicator counts candles that are on the chart of any timeframe a free bar counter for you to download on mt4 the candlestick counter counts how many candles there are inside a larger chart with this candle counter you can do the automatic candlestick count free candlestick count indicator for you to download and count bars automatically bar counter to count the bars count candle counter indicator mt4 count candle bar counter for MT5 If you are interested in th
FREE
Auto Anchored VWAPs MT4
Francisco Gomes Da Silva
5 (1)
Unveil Trading Insights with Auto Anchored VWAPs: Auto Anchored VWAPs serve as your guiding companion in the world of trading. These indicators pinpoint crucial market turning points and illustrate them on your chart using VWAP lines. This is a game-changer for traders who employ anchored VWAP strategies. How Does It Work? Identifying High Points: If the highest price of the current candle is lower than the highest price of the previous one, And the previous high is higher than the one before it
FREE
Rule Plotter MT4
Francisco Gomes Da Silva
5 (1)
How to Create an Automated Trading Robot Have you ever wondered how powerful it would be to automate your trading strategies with just a few clicks of the mouse? Imagine having the freedom to create and test different trading strategies without the need to dive into complicated code. With Rule Plotter, this vision becomes a reality. Here we will explore how you can create your own custom trading robot using Rule Plotter, a trade-system creation tool that simplifies the entire process. What is Ru
FREE
OHLC Shifted MT4
Francisco Gomes Da Silva
5 (2)
Previous Day's Close and Bar Shift Indicator for MetaTrader! The Previous Day's Close and Bar Shift Indicator is a tool designed to enhance technical analysis and decision-making in trading. With this indicator, you will have access to detailed information about the opening, high, low, and closing levels of any bar, allowing for precise and comprehensive analysis of market movements. Imagine having the ability to nest one timeframe within another, enabling detailed analysis of each bar across di
FREE
Paula Bollinger Bands Strategy
Francisco Gomes Da Silva
4 (2)
Bollinger bands out/in strategy A strategy created by Joe Ross, and very useful for finding trades when the market is overloaded. Indicator You don't need to find where there are entries on the chart, this indicator shows them for you. The entrance The trade is confirmed when the price closes outside the bollinger bands on a candle and the candle after the price closes inside the bands. comment I want to improve this indicator, so you can help me sending me your reviews and comments, thanks :).
FREE
First Bar
Francisco Gomes Da Silva
Trade System You choose a bar on the day to trade, when this bar closes the robot will send two orders a at the high other at the low of the candle, which gets again the other will be canceled Stop the stop will be one tick under the low on case of the buy, or one tick above the high on case of the sell Take The take can be setted how much you wants of the stop range, it can be costumized in the strategy otimization Otimization This robot have the input to get risck return, so you can run int in
FREE
Fibonacci on ZigZag
Francisco Gomes Da Silva
4.93 (15)
Mouse You can draw fibonaccis moving the mouse over the zigzag indicator Pin them You can click on fibonacci with this option and it will no longer be deleted unless you click on it again :) Precision The tuned fibonacci gets the precise point in lower timeframes Enjoy it You can ask me for add more features, so please comment and leave your ranting for me to be happy, thank you :)
FREE
Rule Plotter Scanner
Francisco Gomes Da Silva
Have you ever thought about having a scanner that scans all strategies and shows the buy and sell points for all timeframes of that asset, all at the same time? That's exactly what this scanner does. This scanner is designed to display the buy and sell signals you created in the Rule Plotter: strategy creator without programming and run them within this scanner on various assets and different timeframes. The default strategy for Rule Plotter is only bullish and bearish candles. This means that i
FREE
Rule Plotter Expert
Francisco Gomes Da Silva
5 (1)
This Expert Advisor has been designed to test and execute your strategies created within the Rule Plotter indicator. How to use: Download the indicator Rule Plotter - a tool for creating trading systems without the need for programming . Next, develop your strategies within the Rule Plotter indicator. Finally, execute your created strategies using this Expert Advisor. Parameters: Strategy: Your trading system created within the Rule Plotter indicator, allowing you to test and execute your custom
Pattern Wizard
Francisco Gomes Da Silva
Patterns Wizard is a tool for creating candlestick patterns. With it, you can create various patterns and add as many instances of this indicator as you want on your chart, each with a different pattern. To better understand how creation formulas work, you can refer to the examples of the My Candle indicator, which has over 70 examples of candlestick patterns The main difference with this indicator is that it has 30 rule parameters , meaning you can set a different rule for each of the last 30 c
FREE
Trailing on Last Top Bottom
Francisco Gomes Da Silva
5 (1)
This tool places stops on your positions Quickly test by Metatrade Strategy Tester. Your stop will be at the last bottom in case of a long position Or your stop will be at the last top in case of a short position Furthermore, this tool manages the trailing of your open positions. always place your stop at the last high formed or the last formed bottom to create the tops and bottoms I use the free indicator "Supports and Resistances Lines" which is available for download at this link: downl
Trailing on Last Top Bottom MT4
Francisco Gomes Da Silva
5 (1)
Discover the Power of Risk Management with Price Action to Position Your Stop Loss! Have you ever experienced the situation where you know exactly when to enter a trade, but you're unsure about the right time to exit? Don't worry, you're not alone! Many traders face this challenge on a daily basis. The good news is that our price action-based risk management tool is here to solve this problem. While you focus on identifying the optimal entry points, our tool takes control and handles the trade e
Rule Plotter Expert MT4
Francisco Gomes Da Silva
5 (1)
Trading Your Strategies Created with Rule Plotter Indicator with Rule Plotter Expert: Now that you have created your custom strategies using the Rule Plotter Indicator and visualized the arrows indicating entry and exit points on the chart, it's time to bring these strategies to life in the financial markets. With the Rule Plotter Expert, you can trade autonomously and accurately based on these arrows, making the most of the potential of your strategies Turning Arrows into Actions: The arrows ge
Hide Scale
Francisco Gomes Da Silva
5 (1)
Hide Scale - Tool for Traders Who Want More Screen Space Instructions Press "T" to hide the time scale and "P" to hide the price scale. You can customize these keys by clicking the corresponding button and typing a new key on your keyboard. To hide both scales at the same time, you can assign the same key to both options. To show the scales again, simply press the corresponding key again. Why We Created This Tool We created this Hide Scale tool to help traders who use our Sweet VWAP indicator to
FREE
TrendPlator
Francisco Gomes Da Silva
TrendPlator: Empower Your Trading Strategies with an Advanced Trend Projection Indicator Explore the potential of our innovative indicator! With the ability to analyze and project trend lines from larger timeframes directly onto your current timeframe, it provides strategic support that catches the attention of traders across the board. These points become strategic levels of support or resistance for your trades, strengthening your trading strategy. Visualize the opportunity to add an indicator
Hide Scale MT4
Francisco Gomes Da Silva
5 (2)
Hide Scale - The ideal tool for traders who want to maximize chart space How to use Hide Scale Press "T" to hide the time scale and "P" to hide the price scale. You can customize the keyboard shortcuts by clicking on the corresponding buttons and choosing a new key for each function. If you want to hide both scales at the same time, you can assign the same key to both options. To display the scales again, simply press the corresponding key again. The reason behind creating this tool We developed
FREE
Pattern Wizard MT4
Francisco Gomes Da Silva
Patterns Wizard is a tool for creating candlestick patterns. With it, you can create various patterns and add as many instances of this indicator as you want on your chart, each with a different pattern. To better understand how creation formulas work, you can refer to the examples of the My Candle indicator, which has over 70 examples of candlestick patterns The main difference with this indicator is that it has 30 rule parameters , meaning you can set a different rule for each of the last 30 c
Filter:
windy99
88
windy99 2024.01.31 13:46 
 

good

Francisco Gomes Da Silva
72499
Reply from developer Francisco Gomes Da Silva 2024.01.31 14:08
Thank you very munch for your review Windy
Reply to review