Watch the Market tutorial videos on YouTube
How to buy а trading robot or an indicator
Run your EA on
virtual hosting
virtual hosting
Test аn indicator/trading robot before buying
Want to earn in the Market?
How to present a product for a sell-through
Paid Technical Indicators for MetaTrader 5 - 60

Welcome to the future of trading with the KMeans Price Zones Detector, an innovative MetaTrader indicator that leverages the power of machine learning to identify key price zones. This tool utilizes the KMeans clustering algorithm to dynamically detect centroids in price data, highlighting areas where prices are more likely to encounter support, resistance, or consolidation. Innovative KMeans Algorithm The KMeans Price Zones Detector stands out due to its advanced use of the KMeans clustering al

Optimize your trading strategies with the RAR (Relative Adaptive RSI) indicator! This advanced technical analysis indicator combines the power of the Relative Strength Index (RSI) with adaptive techniques, providing more precise and reliable signals than a common oscillator. What is the RAR Indicator? The RAR is an indicator designed for MetaTrader 5 that uses Exponential Moving Averages (EMA) and Adaptive Moving Averages (AMA) to smooth the RSI and dynamically adjust it to market conditions. Th
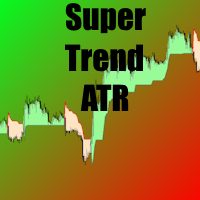
=== > What does this indicator do? It draws a line that represents the Supertrend, based on an ATR
Choose The ATR multiple The ATR period and that's all !!! **** See screenshot 01 to 2
Do not hesitate to ask me for the iCustom code to easily integrate this SuperTrend into your own codes
=== > Example on Bitcoin **** See screenshot 03
=== > For whom? Whether you are a discretionary trader, algorithmic trader or developer, the indicator is designed to meet your needs. I understand the imp
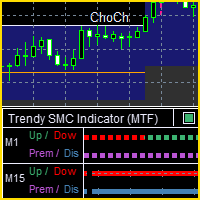
The Trendy SMC ( MTF ) indicator monitors trends and SMC concepts from multiple timeframes, allowing you to see what's happening from different perspectives, but on the one chart.
It is designed to help with a range of trading strategies related to trends and SMC concepts (such as Premium / Discount prices, Fib retracement levels and Fair Value Gaps). Features include:
Determining the trend based on market structure (breaks of highs and lows) Displaying the current trading range (between the

PyNinjaTrader - Drag & Drop Python API Connector for NinjaTrader 8
PyNinjaTrader seamlessly connects your Python scripts with NinjaTrader 8 using a simple drag-and-drop strategy. This fully tested, fast, and efficient solution utilizes websockets for communication, with the strategy acting as the server and the Python script as the client.
Features: - Python login to NinjaTrader 8 Terminal - Keep-alive function for continuous connection - Retrieve NinjaTrader 8 account info to Python client
===> What does this indicator do? It is a moving average weighted by volume, it is a precise smoothing according to the volumes exchanged
It plots a single WWMA average with the choice of timeframe
You drop this indicator on your charts as many times as you need to average.
Choose the parameters and characteristics of your average and that's it!!! **** See Screenshot 01 to 02
Do not hesitate to ask me for the Icustom code to easily integrate this average into your own codes, another ind
Async Charts is an indicator to synchronize charts and display a customized crosshair (cursor) on all selected charts. This is a useful utility for traders using multiple timeframes of analyzing multiple symbols for trade entry or exit.
Main Features : Real time Crosshair Synchronization on All Selected Charts
Supports Multiple Timeframes and Multiple Symbols at the same time
Auto Scroll Option
Graphical Adjustment of Color, Font, Size, ...
Locking All or Locking Specific Charts
More and

Индикатор тиковых объемов представляет собой инструмент технического анализа, используемый для оценки активности трейдеров на рынке. Этот индикатор отображает количество тиков (изменений цен) за определенный временной период и показывает преобладание тиков, направленных на покупку или продажу.
Основные характеристики и функции индикатора тиковых объемов: Гистограмма объемов:
Белый цвет: Означает преобладание тиков, направленных на покупку. Когда количество покупок превышает количество прода

This is the test product. Please, DO NOT BUY IT! This is the test product. Please, DO NOT BUY IT! This is the test product. Please, DO NOT BUY IT! This is the test product. Please, DO NOT BUY IT! This is the test product. Please, DO NOT BUY IT! This is the test product. Please, DO NOT BUY IT! This is the test product. Please, DO NOT BUY IT! This is the test product. Please, DO NOT BUY IT!
MetaTrader Market - trading robots and technical indicators for traders are available right in your trading terminal.
The MQL5.community payment system is available to all registered users of the MQL5.com site for transactions on MetaTrader Services. You can deposit and withdraw money using WebMoney, PayPal or a bank card.
You are missing trading opportunities:
- Free trading apps
- Over 8,000 signals for copying
- Economic news for exploring financial markets
Registration
Log in
If you do not have an account, please register
Allow the use of cookies to log in to the MQL5.com website.
Please enable the necessary setting in your browser, otherwise you will not be able to log in.