Watch the Market tutorial videos on YouTube
How to buy а trading robot or an indicator
Run your EA on
virtual hosting
virtual hosting
Test аn indicator/trading robot before buying
Want to earn in the Market?
How to present a product for a sell-through
Paid Technical Indicators for MetaTrader 5 - 19
Some candles have a strong tendency to continue the movement, or its turn. Using the Colored candles and patterns indicator, such candles are clearly visible. This indicator calculates the parameters of each candle, as well as its volume, and after that it colors the candles depending on its strength and direction. Bullish candles turn green and bearish candles turn red. The greater the strength of the bulls or bears, the brighter the color. If desired, the colors can be changed. In addition, t
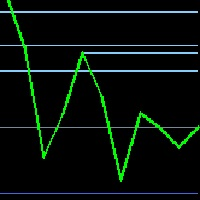
Resistance and Support levels is one of the most important factors when you enter the market This indicator will automatically draw all resistance and support for last x (you can insert the x value as you like) resistances and supports You should trade between those lines and put your stop loss behind this line (if you in sell then your stop line should be above this line, and opposite for buy) Also your take profit should be upon those lines So you should trade between support and resistance

Hi Friends! this is countdown candles with 4 functions. 1. Countdown current Candles 2. Countdown H1 timeframe. 3. Countdown H4 timeframe. 4. show the spread index and the lowest spread value within 5 minutes. Instructions for installing and downloading this indicator in the link below. https://www.youtube.com/watch?v=fi8N84epuDw
Wish you have a happy and successful day.

Trend indicator, draws 2 bars of different colors on the chart. A change of one lane to another signals a market reversal in the opposite direction. The indicator also places on the chart 3 parallel dashed lines High, Middle, Low line which show respectively the top, middle, bottom of the forming reversal.
Parameters
Depth - Depth of indicator calculation, the higher the parameter, the longer-term signals; Deviation - Deviation of the indicator during drawing; Backstep - The intensity of th
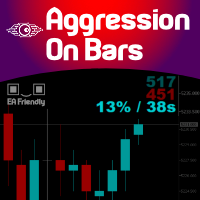
Imagine a Buy and Sell Pressure monitor on your chart that shows in REAL-TIME this data, bar by bar? Well, imagine no more. We present you an exclusive creation of Minions Labs : Aggression On Bars indicator. On every new bar on you chart this indicator will start counting in real-time the BUY/SELL pressure and present this data statistics directly inside your chart. As soon as a new bar is created in your chart, the counter restarts. Simple and effective. Just watch the video to see it running
Elite SR - Advanced Level Indicator for automatic detection of support and resistance levels with different degree of credibility should become a part of your trading arsenal. This indicator is accessible via iCustom function and provides level values as well as their degree of credibility. Elite SR is fully adjustable and can work on any time-frame with any trading instrument!
Important information For all detailed information about this indicator you can visit 747Developments website.
Feat
Get all the moving averages in one indicator. Simple moving average, Exponential moving average, Smoothed moving average, Linear weighted moving average, Double Exponential Moving Average, Triple Exponential Moving Average, T3 Moving Average and MORE. Find in the comments a Free Expert Advisor that uses the XPMA . It will show you how easy to make an EA based on the XPMA (XP MOVING AVERAGE). Settings: Moving Average Type: The Moving Average Type. It can be one of these types: SMA (Simple Moving

I present to you an indicator for manual trading on DeMark's trend lines. All significant levels, as well as the indicator signals are stored in the buffers of the indicator, which opens the possibility for full automation of the system. Bars for calculate (0 = unlimited) - Number of bars to search for points DeMark range (bars) - Shoulder size to determine point

SETI is a Break indicator multipair searching SETI is a powerful indicator of for any par and any timeframe. It doesn't requires any additional indicators for the trading setup.The indicator gives clear signals about opening and closing trades. This Indicator is a unique, high quality and affordable trading tool. Can be used in combination with other indicators Perfect For New Traders And Expert Traders Low risk entries. Never repaints signal. Never backpaints signal. Never recalculates

Open time indicator 4 Major sessions. 1. Sydney is open 0h - 9h (GMT + 3) 4h - 13h (VN - GMT + 7) 2. Tokyo is open 3h - 12h (GMT + 3) 7h - 16h (VN - GMT + 7) 3. Lodon is open 10h - 19h (GMT + 3) 14h - 23h (VN - GMT + 7) 4. Newyork is open 15h - 24h (GMT + 3) 19h - 4h (VN - GMT + 7) Link download indicator KIDsEA Session Please come to my youtube for free download, please feel free for like and subscribe for my channel.

Fibonacci fast drawing tool with 4 outstanding features 1. Quick action by clicking on the candle 2. Draw the bottom of the selection exactly 3. Include Standard Fibo levels and display prices at levels 4. Draw extended fibo to identify the price zone after break out Please see video clip below for more details. Free download link of FiboCandleClick indicator inside youtube.
Description
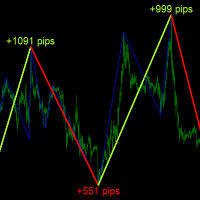
ABC Trend Detector is an indicator that identifies impulses and trends in the market and displays their presence on the price chart. Found patterns are drawn as colored connecting lines between their highs and lows. Above / below each extreme, the value of the range (the number of pips) of the trend is displayed.
Recommendations
You can use this indicator to determine the trend and, accordingly, to determine the direction of opening a position or closing an opposite position
At its most basic, the "Average Directional Movement Index Wilder" (ADXW) can be used to determine if a security/index/currencie is trending or not. This determination helps traders choose between a trend-following system or a non-trend-following system. Wilder suggests that a strong trend is present when ADXW is above 25 and no trend is present when ADXW is below 20. There appears to be a gray zone between 20 and 25. ADXW also has a fair amount of lag because of all the smoothing techniques. Ma

The indicator displays 05 important parameters for traders 1. Display Bid -ASK price in big font 2. Display currency pair name and large time frame 3. TradeTick parameters 4. Swaplong and SwapShort 5. Point parameters used to calculate the price of SL or TP Indicators include 02 files supporting MT4 and MT5, You can download the link below. And follow the instructions of the video.

This indicator supports fast drawing of trendlines 1. Support drawing the next peak higher than the previous peak 2. Support drawing the lower peak after the previous peak 3. Support drawing the lower bottom of the bottom. 4. Support to draw the lower bottom higher than the previous bottom. 5. Support drawing trendline across the price zone. Peak connected vertex 6. Support drawing trendline across price range. Bottom connected Link to download and use for free. Including 02 files s
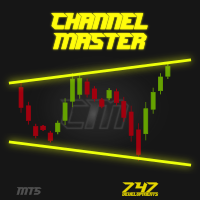
Channel Master is unique indicator for automatic channel finding. This indicator is fully adjustable by user. User can also put more instances of Channel Master to one chart with different channel size for better trend filtering. To find more information visit the 747Developments website. Features
Easy to use (just drag & drop to the chart) Fully adjustable Accessible via iCustom function Possible to use with any trading instrument Possible to use on any time-frame
The Raschke Oscillator (LBR-RSI) indicator is the famous oscillator described in the book " Street Smarts: High Probability Short-term Trading Strategies " This indicator is perfect for a variety of researchs and it can be suitable to be used in combination with your own strategy just for trend trading or range-bound trading. The personal preference is to use it when the trend is not too strong, for example you can combine it with ADX to measure the strength of the trend and use it when ADX is b
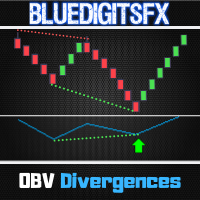
MT4 Version Available Here: https://www.mql5.com/en/market/product/48040
Telegram Channel & Group : https://t.me/bluedigitsfx
V.I.P Group Access: Send Payment Proof to our Inbox
Recommended Broker: https://eb4.app/BDFXOsprey
* Non-Repainting Indicator To Trade Divergences for any Newbie or Expert Trader ! BlueDigitsFx's OBV Divergence draws divergence lines on the chart and on the On Balance Volume (OBV) Indicator. Performs Amazingly at significant price areas such as support

The indicator predict the future candles direction, by scanning past candle movement. Based on the principal: “ The history repeat itself”. Programmed according to Kendall Correlation. In the settings menu, different scanning options are available. When the indicator find a match, start painting future candles from the current candle to the right, also from the current candle to the left as well, showing you the candle pattern what the actual signal is based on. The left side candle are option

A regression channel based on roughened fractals.
Parameters:
Period ReCalculate - indicator calculation period
switch Zero (Last) Bar-count the last open bar?
switch Push notifications when changing the position of the rounded price relative to the channel
Line Risk-displaying the risk line
Coeff Risk,% - the maximum percentage in the transaction as a percentage
The channel allows you to evaluate the trend and its strength in the market and correctly place a request for a transaction wit

Indicador Para Opções Binarias. Indicator for Binary Options Usa dois gales. Instalar em mt5 Esse indicador é para ser usado no tempo de vela de 5 minutos e em M5. Este também funciona em M1, porém é mais eficiente em M5. Só descompactar e copiar os arquivos na pasta de dados do seu MT5. Arquivos indicator na pasta MQL5 - Indicator. Baixe também a Media Movel totalmente gratis:
https://www.mql5.com/pt/market/product/50400
Esse Indicador é para a próxima vela. Apareceu a seta, só aguardar a pr

The result as the name explain, displays the result of a swing. Sometimes weis waves show a big effort, but a little result... The weis waves result is a better revelation about the volume, if united with weis waves. it is a volume indicator, but it is different from a conventional volume indicator, this indicator came from the wyckoff method, if you use the result you will have a different view of the market, regardless of which asset is operating.

Relative Strength Ratio (RSR)
The Relative Strength Ratio (RSR) indicator compares the performance of one security against another, dividing the base security by the comparative security, and showing the ratio of this division in a line c hart. This indicator is also known as the Relative Strength indicator, Price Relative , or Relative Strength Comparative .
It is one of the main tools for Intermarket Analysis professionals, to help them identify Sector Rotations and other global relations

Description
ABC Trend Levels is an indicator that identifies market trends and important trend support and resistance levels.
Recommendations
You can use this indicator to determine the trend and, accordingly, to determine the direction of opening a position or closing an opposite position.
Parameters
===== _INDICATOR_SETTINGS_ ===== - indicator settings Maximum History Bars - maximum number of history bars for calculating the indicator. Average True Range Period - ATR indicator p

The indicator shows buy and sell signals. The " CounterTrend 5 " is designed to recognize profitable counter trend patterns from your chart. Features: The CounterTrend 5 is a Counter-Trend Trading with Simple Range Exhaustion System. Signals based on the daily trading range. The indicator calculates the trading range for the last few days and compare the price movements on short time intervals and generating short term reversal points. This is a leading indicator. It works on any instruments.

This multi time frame and multi symbol indicator for MT5 alerts about Heiken Ashi Smoothed color changes. As a bonus it can also scan for Hull Moving Average color (trend) changes. Combined with your own rules and techniques, this indicator will allow you to create (or enhance) your own powerful system. Features
Can monitor all symbols visible in your Market Watch window at the same time. Apply the indicator to just one chart and instantly monitor the entire market. Can monitor every time fram

Display the date, time and price according to the movement of the mouse cursor on the chart This is useful for discretionary trading.
It is an indispensable tool for verifying and studying past market prices and trades. Large and easy-to-read characters It is easy to see even if your eyesight is weak.
Also, you can tell the date and price to YouTube and webinar viewers in an easy-to-understand manner. Characteristic Date,Time and Price are displayed. The value follows the movement of the mous

Want to make the graph cleaner?
Don't you use the opening price in your analysis?
Want to use a chart model that was used by Richard Wyckoff?
Then you need to know the Color HLC Candles and Bars indicator. In the same indicator you can switch to the display of candles or bars.
Take a look at the other volume indicators to complement your operating. And don't forget to look at the best Vwap Custom (Midas)!
Leave your comment!
Success and good trades!

Delta Single Volume is a very powerful indicator that reads the supply on the Market.
It calculates the Delta from movement of the price and the difference of BUY and SELL volumes. Its special structure allows you to get all timeframe values available on the MT5 platform. It works on Tick Volumes and Real Volumes (if avalaibles on your Broker). A good observation of this instrument can suggest great entry points and possible reversal. We are confident that this tool will help you to improve yo

Description
Reverse Rayer is an indicator that draws rays on inclined trend levels.
Recommendations
You can use this indicator to determine the trend and, accordingly, to determine the direction of opening a position or closing an opposite position.
Parameters
===== _INDICATOR_SETTINGS_ ===== - indicator settings Maximum History Bars - maximum number of history bars for calculating the indicator. Average True Range Period - ATR indicator period (used to calculate the difference be

Description The indicator uses market profile theory to show the most relevant trading zones, on a daily basis. The zones to be shown are LVN (low volume nodes) and POC (point of control). An LVN zone is one which represents price areas with the least time or volume throughout the day. Typically, these areas indicate a supply or demand initiative, and in the future, they can turn into important breakout or retracement zones. A POC zone is one which represents price areas with the most time or vo

The OCTO Indicator is a new and easy to use zero-crossing trend/trend reversal indicator that provides entry signals for both long and short positions. It is based on High/Low divergence and correlation of the values over time.
Reliability of the indicator has been backtested with an example trading robot.
How to use The OCTO indicator is added in a separate window, showing a red and a green indicator line, as well as the zero line for crossing. You can see an example of the standard look a
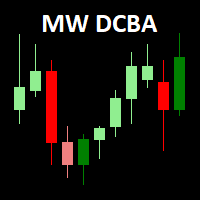
The Martinware Direction by Candle Body Analysis indicator is a direction indicator that shows the current asset direction, up or down, by checking if previous candle bodies' bases were respected or broken. It works similarly to a moving average, but it's more objective due to its lesser amount of configuration parameters.
The algorithm assumes the theory that although the highs and lows of candles have their value, it is the body that shows the conclusive market sentiment over that asset in

I recommend you to read the product's blog (manual) from start to end so that it is clear from the beginning what the indicator offers. This multi time frame and multi symbol indicator scans for engulfing and tweezer formations. The indicator can also be used in single chart mode. Combined with your own rules and techniques, this indicator will allow you to create (or enhance) your own powerful system. Features Can monitor all symbols visible in your Market Watch window at the same time. A

the indicator will show signal arrows on the graph at the crossing of a given level it has push and audible alerts. By crossing from low to high level 0.3, a blue arrow will come out for the purchase, at the same time an audible signal will sound. By crossing from low to high level 0.7, a red arrow will come out for the sale, at the same time an audible signal will sound. Possibility to deactivate push and audible alerts. MT4 version of this product here
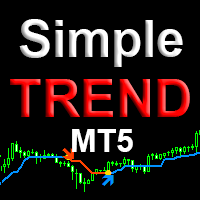
Simple trend mt5 is a professional version of the trend indicator and entry points. It uses Price action and a unique filtering algorithm to determine the trend. Shows the change in the direction of price movement on any currency pairs, without redrawing the result. Suitable for determining entry points for scalping and swing, as well as for intraday, medium-term trading. Features Marks trend reversal locations and directions. Suitable for all types of trading, in any markets. Allows you to en

ichimoku indicator with alert; audible alert, email alert, push alert you can enable or disable the settings as you wish When there is a crossing of tenkansen and kijun you will get an alert When there is a cross between Senkouspan A and Senkouspan B you will get an alert Affordable sound settings possibility to modify the parameters of the ichimoku indicator
The indicator tracks the trend in 5 different chart times for the same asset, based on 6 signals for each chart time.
The main objective of the indicator is to show us the majority trend of the financial asset in which it was placed. The system transmits the information of the trends in several graphic times, in this way the user is able to have a broad view of the movement of the asset, this type of tool makes the user have a higher hit rate by helping the operator to execute orders in favor

Indicator designed to measure the distance from the price on a given moving average.
The indicator, in addition to displaying the value of the spacing, has an average of the spacing itself, to assist and confirm analyses. Both the type of the average and the average on which the spacing value will be calculated, as well as the spacing average, are parameterizable.
With the option "SET AUTO LEVEL AND SHOW SIGNALS" enabled, the indicator displays buy and sell signals on the graph. Buy and
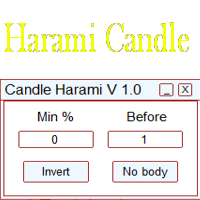
Это простой индикатор, показывающий формирование свечей харами. Входные параметры:
Min % - минимальный процент харами Before - количество свечей до сигнала Invert - инвертировать сигналы No Body - свечи без тела Length - настройка для отображения сигналов В индикаторе есть встроенный фильтр по количеству свечей до сигнала и минимальному проценту харами. Более подробно о настройках индикатора можно прочитать на моем сайте.
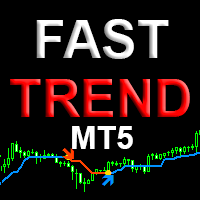
Fast trend - профессиональная версия индикатора определения направления тренда и точек входа. Индикатор с высокой вероятностью определяет направление тренда на любых валютных парах, акциях, криптовалюте без перерисовки результата. Для определения тренда использует Price action и авторский уникальный алгоритм фильтрации. Подходит для всех видов торговли, как для скальпинга так и для долгосрочной торговли. Данная версия индикатора это другая ветка эволюции алгоритма индикатора Simple Trend

The best time to trade Using this Indicator is when the time reach exactly hour,half,45 minutes,15 minutes and sometimes 5 minutes..
This indicators is helpful to those who trade boom and crash indecies.How to read this indicator first you'll see Blue allow and Red allow all these allows used to indicate or to detect the spike which will happen so the allow happens soon before the spike happen.This indicator works properly only in boom and crash trading thing which you have to consider when

This multi symbol indicator has been designed to automatically identify when price reaches major psychological levels. Also known as round numbers, whole numbers or key levels. As a bonus it can also scan for pivot point level on one selected time frame. Combined with your own rules and techniques, this indicator will allow you to create (or enhance) your own powerful system. Features Can write the signals to a file which can be used by an Expert Advisor for auto trading. Can monitor all symbols
Representation of the slope value of the linear regression. It has a reference plot to visually determine changes in the slope value (acceleration / deceleration of the price).
PARAMETERS
• Periods: number of periods to calculate linear regression
• PeriodsReference: number of periods for the calculation of the moving average on the values of the main plot
• Displacement: displacement on the horizontal axis
• AppliedPrice: price on which the calculations are made
•

The indicator tracks the trend in 5 different chart times for the same asset, based on 6 signals for each chart time.
The main objective of the indicator is to show us the majority trend of the financial asset in which it was placed. The system transmits the information of the trends in several graphical times, in this way the user is able to have a wide view of the movement of the asset, this type of tool makes the user have a higher hit rate by helping the operator to execute orders in fa
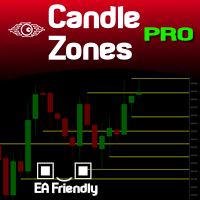
You probably heard about Candlesticks behaviors, which in most of the times could denote and trace Volume behaviors even if you are not watching Volume itself... Well, this indicator will do this. Naked traders love to rely solely on candlesticks patterns and with Candle Zones you can trap special patterns and DRAW THEM on your chart. As simple as that. There are several filters you can tweak in order to achieve the analysis you want. Just give it a try. After several months of testing, we think

Индикатор построен на основе индикаторов VIX и RSI. Комбинация двух указанных индикаторов позволяет обнаруживать зоны крайней перепроданности, где цена с большой долей вероятности изменит направление. Наиболее сильные сигналы дает в периоды слабого тренда. Сигналом индикатора является изменение направления гистограммы (с роста на снижение) выше заданного (сигнального) уровня.
В индикаторе задан широкий спектр параметров, который позволяет оптимизировать индикатор для торговли любыми активами:

BeST_Keltner Channels Strategies MT5 is an MT5 Indicator based on the original Keltner Channels Indicator and it can display in the Chart all the known Variations of Keltner Channels and also the corresponding 10 totally Strategies. Every such generally consists of a Central Moving Average Line and two Boundary Bands at a distance above and below it and can be traded mainly in a Trending Mode but also in a Ranging ReEntry Mode.
BeST_Keltner Channels Strategies Indicator Draws definite Bu
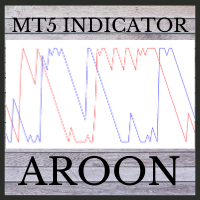
This indicator is powerful for detecting the trend.
The crossing between to line is the entry signal. Buffer 0 is UP line. Buffer 1 is DOWN line. Note: 1. Aroon is great tool for trending detecting. Please try to select the best period for each instrument.
Input AroonPeriod =14- Aroon period
MailAlert =false- Send email when entry signals appeared.
SoundAlert =false- Notify on MT5 platform.

Indicator with 3 features
- Clock : Clock independent of the chart, counting continues even when the market is closed.
- Template : After setting up a configuration in any graphic, be it color patterns, indicators, zoom ... The configuration will be copied to all active graphics.
- TimeFrame : Set the TimeFrame on a chart, and with just one click all the active charts will be changed to the same TimeFrame.

Buy and sell signals based on Joe DiNapoli's shifted 3 period exponential moving average strategy for trend reversals.
Who is he? Joe DiNapoli is a professional trader and author that has been involved in the markets for more than 38 years. He is also a registered Commodity Trading Advisor (C.T.A.) for over 15 years and has taught his techniques in the major financial capitals of Europe, Asia, South Africa, the Middle East, Russia and in the United States.
How does the indicator work? The i
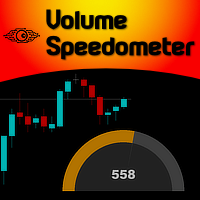
Imagine the ability to have Volume Speed second by second presented to you in the form of a speedometer... Well, imagine no more... Welcome to the new Minions Labs creation: Volume Speedometer . Volume Speedometer is a Minions Labs idea that was born trying to show in realtime what is happening with the Volume Flow of orders (or Ticks, if you don't have that) during the day. This indicator was created to be used in Intraday trading and the goal is to give you a "heads up" when the Volume flow is

FXC iCorrelatioN MT5 Indicator (Specialized for DAX - DowJones)
The indicator shows the correlation soefficient between two assets. Correlations are useful because they can indicate a predictive relationship that can be exploited in practice. The correlation coefficient shows the relationship between the two symbols. When the correlation is near 1.0, the symbols are moving togerhet in the same direction. When the correlation is near -1.0, the symbols are moving in opposite direction. Main featu

The previous day's vwap is used by some traders as a support and resistance point, after all it is one of the ways to consider the fair price of that asset or that pair the day before. Possible defenses can occur in this region indicating a reversal, or triggering stops starting a new, more directional movement. It is a matter of analyzing how it will add to your operational.
To avoid manually drawing the previous day's vwaps and saving time for your analysis, use the Vwap Freeze indicator,
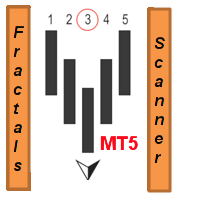
This multi time frame and multi symbol indicator identifies fractals patterns. As a bonus it can also scan for Parabolic SAR (pSAR) trend changes. Combined with your own rules and techniques, this indicator will allow you to create (or enhance) your own powerful system. Features
Can monitor all symbols visible in your Market Watch window at the same time. Apply the indicator to just one chart and instantly monitor the entire market. Can monitor every time frame, from M1 to MN, and sends you a r

Description
Range Detector is an indicator that identifies ranges in the market and displays their presence on the price chart.
Recommendations
You can use this indicator to determine the flet and, accordingly, to determine the direction of opening a position or closing an opposite position.
Parameters
Maximum History Bars - maximum number of history bars for calculating the indicator. Average True Range Period - ATR indicator period (used to calculate the difference between mov
VolumeDeltaScanner is a volume delta monitor for multiple (up to 10) time scopes. It works by online ticks or history ticks. Indicator monitors tick volumes for buys and sells separately, and find their delta on every bar and larger scopes, then displays the volume deltas for all the scopes. Every scope is presented by its own buffer/line. The smallest scope is the current timeframe. It's required. All other scopes should be multiples of it. For example, if placed on a M5 chart, it can calculat

Candle de Volume Coiote O Candle de Volume Coiote é um indicador que mede a variação do volume no tempo, seu corpo é pela variação do volume anterior pelo volume atual, sua direção pelo fechamento do preço.
1. identificado um topo no indicador Candle de Volume Coiote (marcado o fechamento do preço).
2. identificado um fundo no indicador Candle de Volume Coiote (marcado o fechamento do preço).
3. fundo 3 igual fundo 2 no indicador Candle de Volume Coiote, preço no 3 é diferente de fundo 2

The indicator identifies two most important patterns of technical analysis - Pin Bar and Engulfing. MT4-version: https://www.mql5.com/en/market/product/53591 Settings: Mincandle size for PinBar - The minimum size of the Pin-Bar candlestick; Percentage of candle body on size - The percentage of the candle body in relation to its length; PinBar Alert - Alert when a Pin-Bar is detected; PinBar Mail - Sends an email when a Pin Bar is found; PinBar Notification - Sends a push notificati

Candle com coloração de Volume Price Analysis (VPA) segundo as definições da Anna Coulling, é possível configurar períodos de climax e rising, fator de extreme e fator de rising.
Pode-se usar volume real ou volume de ticks. O VPA considera a variação de preço por volume do período, indicando se um movimento está recebendo ignição, está em seu climax ou se já não existe mais interesse.
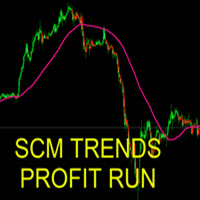
The indicator can be used in several ways. The simplest is to buy when the SCM Trends Profit Run line is painted green and sell when it is red. This indicator that allows you to detect several changes and dynamics in price that many traders can’t estimate or see without an indicator, which highlights its essence and usage.
Accordingly, traders can draw conclusions and make estimates about how the prices will change based on the information they have and then they can modify their strategy fo

It is a Graphical and Trend indicator that brings several advantages. Eliminates noise.
Facilitates the identification of the trends. Can be used as directional force indicator. Identify lateralization: candles with close and open price closer. Identifies high volatility: candles with shadows larger than the body. Attention!!! Works on any asset and any time frame.
Easy setup Symbol: anyone Time frame: anyone Parameters: Indicator Period Recommended Period : betw
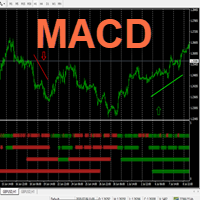
Hello This Indicator will draw Green (Up) and Red (Down) small arrows from Multi TimeFrames based in ( MACD ) to help you to take decision to buy or sell or waiting If there 4 green arrows in same vertical line that's mean (Up) and If there 4 Red arrows in same vertical line that's mean (Down) and the options contain (Alert , Mobile and Mail Notifications). Please watch our video for more details https://youtu.be/MVzDbFYPw1M and these is EA for it https://www.mql5.com/en/market/product/59092 G
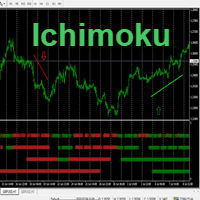
Hello This Indicator will draw Green (Up) and Red (Down) small arrows from Multi TimeFrames based in ( Ichimoku ) to help you to take decision to buy or sell or waiting If there 4 green arrows in same vertical line that's mean (Up) and If there 4 Red arrows in same vertical line that's mean (Down) and the options contain (Alert and Mobile , Mail Notifications). Please watch our video for more details https://youtu.be/MVzDbFYPw1M and these is EA for it https://www.mql5.com/en/market/product/590
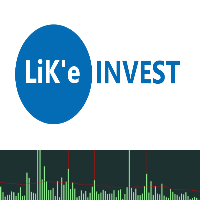
Indicator VolumeTick https://youtu.be/tmHZKdMCMGo
made for rapid identification of possible reversal points, when the conditions of consolidation and bi-directional trading traders, the number of volumes in the market increases sharply, which shows the interest of the participants to change the direction of movement of the tool market and counts the number of ticks on each bar, made in the form of an oscillator. This way we can foresee stopping trading or trading in the other direction, or add

The indicator is based on a proven successful strategy. It shows buys and sello signals with suggested stop and target. In the same way, it calculates the essential trading analysis statistics as successful and profit ratio. KEY LINKS: Indicator Manual – How to Install - Frequent Questions - All Products Indicator features Effective and understandable signals. It can be used as a complete trading strategy. Complete trading statistics to evaluate the indicator performance. It shows exact

SR Breakup Indicator it is an indicator based on support and resistance . It makes price breakout levels visible by opening the trader's mind to spot market opportunities.
Attention!!! This Indicator can be used in any time frame.
Suggestion of use Wait until the support and resistance lines are horizontal and closer. Do Trade (BUY): if price breakout resistance level (outside line). Do Trade (SELL): if price breakout support level (outside line). Use internal lines as Sto

WT Vwap 5 Bands
The WT Vwap Bands indicator is an indicator that combines price and volume, helping to show whether the price is within the "fair price", overbought or oversold.
The indicator code was designed for performance and has already been tested in a real trading account.
In addition to the visual inputs (color, thickness and line style), the user can define a% value that depends on the price.
The default values work with the most distant band at 1% of the price and then di

Buy and sell signals based on the Wave Setup strategy for entering a trade on the pullback after a reversal.
How does the indicator work? The indicator activates the buy and sell signal when their respective conditions are met. For an uptrend, we need a reversal up on the EMA9 followed by prices above the ascending SMA21 making a pullback and a touch on it. For a downtrend, we need a reversal down on the EMA9 followed by prices below the descending SMA21 making a pullback and a touch on it.
Indicator summary Индикатор информационная панель отображает значения и торговые действия, а так же выводит сводную информацию о торговых действиях, основанных на 11 встроенных индикаторах. Встроенные индикаторы:
RSI (Relative Strength Index )- пересечение зоны перекупленности сверху вниз - сигнал на продажу. Пересечение зоны перепроданности снизу вверх - сигнал на покупку. При колебаниях в зоне между перекупленостью и перепроданостью сигнал формируется в зависимости от нахождения значения о
The MetaTrader Market is a simple and convenient site where developers can sell their trading applications.
We will help you post your product and explain you how to prepare your product description for the Market. All applications on the Market are encryption-protected and can only be run on a buyer's computer. Illegal copying is impossible.
You are missing trading opportunities:
- Free trading apps
- Over 8,000 signals for copying
- Economic news for exploring financial markets
Registration
Log in
If you do not have an account, please register
Allow the use of cookies to log in to the MQL5.com website.
Please enable the necessary setting in your browser, otherwise you will not be able to log in.