Watch the Market tutorial videos on YouTube
How to buy а trading robot or an indicator
Run your EA on
virtual hosting
virtual hosting
Test аn indicator/trading robot before buying
Want to earn in the Market?
How to present a product for a sell-through
Technical Indicators for MetaTrader 5 - 4

RaptorT: Cumulative Volume and Cumulative Volume Delta (Buying Selling Pressure) Introduction RaptorT CV & CVD (CVD is also known as Buying/selling Pressure or Book Pressure) offers two basic and meaningful indicators for trading having volumes as main index and weigh of the market interest. It gives good insights in combination with VWAP line and its four upper and lower standard deviations, developing PVP (Peak Volume Price, the equivalent of the POC for the old Market Profile), Volume Profi

DAILY STATS PANEL is a small panel that shows some statistic of opened chart. For example: Fibonacci resistance and support, daily average moving points and today's moving range, etc. After applied this expert advisor to chart, a small panel will be shown on the right. ** NOTE: This is not an algo trading expert advisor. **
Input parameters show_pivot - Whether or not to show pivot, resistance and support line on the chart. Pivot Color - R1-R4, Pivot and S1-S4 horizontal line colors.
Stati

Micro ******************* Секундные графики MT5 ********************** Более точного инструмента для входа в сделку вы не найдёте. Входные параметры: Timeframe, sek - период построения графика, секунды Displayed bars - отображаемые бары Step of price levels, pp, 0-off - шаг отрисовки ценовых уровней, пункты Scale points per bar, 0-off - масштаб в пунктах на бар Show lines - отображение текущих уровней Show comment - отображение комментария Standard color scheme - стандартная цветовая сх
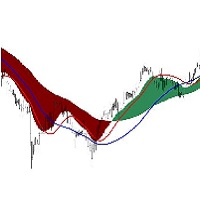
The Visual MACD Indicator is a forex technical analysis tool based on Moving Average Convergence Divergence, but it is plotted directly on the main trading chart with two macd signals. You should look for buy trades after the yellow line crosses the blue line and the MACD wave is blue. Similarly, you should look for sell trades after the yellow line crosses the blue when the MACD wave is red and the price is below the blue line . Go ahead and add it to your best trading system. It fits all

FXC iMACD-DivergencE MT5 Indicator
This is an advanced MACD indicator that finds trend-turn divergences on the current symbol. The indicator detects divergence between the MACD and the price movements as a strong trend-turn pattern.
Main features: Advanced divergence settings
Price based on Close, Open or High/Low prices Give Buy/Sell open signals PUSH notifications
E-mail sending Pop-up alert Customizeable Information panel Input parameters: MACD Fast-EMA: The Fast-EMA variable of the MACD

GIVE A LOOK TO MY OTHER PRODUCTS ! 100 % PER MONTH PROFIT---- MY NEW SIGNAL HERE -------> https://www.mql5.com/en/signals/2162238?source=Site+Signals+My# MACD Cross Alert is a tool indicator that notificate directly to your phone whenever the signal line crosses the base line. For more accurate signals,crosses are filtered like this : Buy Signal : SIGNAL LINE CROSSES ABOVE BASE LINE AND BOTH ARE ABOVE THE 0 VALUE Sell Signal : SIGNAL LINE CROSSES BELOW BASE LINE AN

This indicator provides you with MACD formula applied to volume-aware Accumulation/Distribution and OnBalance Volumes indicators. In addition to tick volumes it supports special pseudo-real volumes, synthesized for Forex symbols where real volumes are unknown. More details on the volume surrogates may be found in description of another indicators - TrueVolumeSurrogate and OnBalanceVolumeSurrogate (algorithm of the latter is used internally in MACDAD for AD and OBV calculation before they procee

Tool for Identifying Potential Reversal Points and Trend Direction
This tool is excellent for identifying potential reversal points and trend direction in the market. It works well with confirming indicators such as MACD, Stochastic, RSI - standard indicators available on all MT5 platforms. Together with them, it forms a reliable strategy. In the settings, you can adjust the channel distance and period.
It is recommended to enter a trade when the signal line crosses the upper channel bounda
For those who are fans of the traditional MACD ( Moving Average Convergece/Divergence ) indicator, here it is a way faster indicator that could be very useful for intraday trading. Of course it could be used in higher timeframes, with the proper settings. Here at Minions Labs we always encourage traders to calibrate every single indicator you have to extract and distill every drop of good information it has for you. And this is the case with this speedy friend... This Zero Lag MACD could be used
The Moving Average Convergence Divergence Indicator (MACD) is both a trend–seeking and momentum indicator which uses several exponential moving averages set to closing prices to generate trading signals. This Version brought to you the Stochastic confluence filtering the signals, this set ups amazing entries on índices and stock futures trading.
We added many types of alerts plus the Delay Cross Filter to aid in your search for better opportunities in the market.
Product Features Sound aler

Description: TrendAccess can optimize your trading time by showing you the trend via two different calculation modes quick and easy.
No more searching for Trends. Just open the chart and look at the trend display.
Features: Shows Uptrend, Downtrend and "No Trend" indicator
Shows the calculated ZigZag Profile
Works on all timeframes Two different calculation Modes (MACD and Candle-based calculation)
Settings: Variable
Standard Value Description
Calculation Mode
Candle based
C

This multi symbol dashboard indicator can send an alert when a strong trend has been identified. It can do so by building up the dashboard using the following indicators/oscillators (hereafter only mentioned as incdicators): RSI, Stochastics, ADX, CCI, MACD, WPR (Williams Percent Range, also called as Williams %R), ROC (Price Rate of Change) and Ultimate oscillator. It can be used with all time frames from M1 to MN (it can only show 1 time frame at a time). It gives you perspectives on momentum,

I present an indicator for professionals. Prof MACD is very similar to classic MACD in appearance and its functions . However, Prof MACD is based on completely new algorithms (for example, it has only one averaging period) and is more robust, especially on small timeframes, since it filters random price walks. The classic MACD indicator (Moving Average Convergence / Divergence) is a very good indicator following the trend, based on the ratio between two moving averages, namely the EMA

九转序列,源自于TD序列,是因TD序列的9天收盘价研判标准而得名。 汤姆·德马克(Tom DeMark)技术分析界的着名大师级人物,创建了以其名字首字母命名的TD系列的很多指标,价格反转的这个指标就是其中重要的一个,即TD序列。 德马克原版TD序列指标要复杂一些,想研究就自行看关于德马克的资料吧。这里只说简单的TD序列(九转序列)。 九转序列分为两种结构,低九买入结构和高九卖出结构。 TD高九卖出结构:连续出现的九根K线,这些K线的收盘价都比各自前面的第四根K线的收盘价高, 如果满足条件,就在各K线上方标记相应的数字,最后1根就标记为9,如果条件不满足,则K线计数中断,原计数作废重新来数K线。如出现高9,则股价大概率会出现转折。 TD低九买入结构:连续出现的九根K线,这些K线的收盘价都比各自前面的第四根K线的收盘价低,如果满足条件,就在各K线下方标记相应的数字,最后1根就标记为9,如果条件不满足,则K线计数中断,原计数作废重新来数K线。如出现低9,则股价大概率会出现转折。
结构的本质是时间和空间的组合,时间是横轴,空间是纵轴,不同的时间周期和空间大小的组合,形成不同的结构形态,不同
Peanut Indicator This indicator indicates trend with thick blue and red LINE based on Golden cross, Dead cross, and MACD. You can adjust the number freely in parameter settings(MA Period, MACD Value). Thus, you can adjust this indicator to your trading currency type, period, and so on. This indicator's default number is suited for USD/JPY M30 or H1 trade. HOW TO USE GREEN LINE:RISE, BUY RED LINE:FALL, SELL Parameters(Customizable) MAPeriod1 (Short term) MAPeriod2 (Long term) MAC

This indicator implements the logic behind Traders Dynamic Index to the classic MACD Indicator. It helps to find powerful trende changes and ignore meaningless ones. It is simply the classic MACD indicator plotted with volatility bands on top designed with the sole purpose of being able to ignore trend changes that do not follow an over-extension or over-contraction of the market. The indicator alerts on trend changes after the volatility bands have been breached and implements alerts of all ki

This indicator plots in the candles the divergence found in the selected indicator and can also send a notification by email and / or to the cell phone.
Works on all TIMEFRAMES. Meet Our Products
He identifies the divergences in the indicators:
Relative Strength Index (RSI); Moving Average Convergence and Divergence (MACD); Volume Balance (OBV) and;. iStochastic Stochastic Oscillator (STOCHASTIC).
It is possible to choose the amplitude for checking the divergence and the indicator has

This indicator Allow you to get notification from 7 indicators. Scan all your favorite pairs with your favorite technical indicator, and get notified on your preferred timeframes.
Settings are Customizable
(RSI, ADX, MACD, Alligator, Ichimoku, Double MA, and Stochastic)
Click to change the time frame or open new pairs
Notification: Phone/Popup/Email
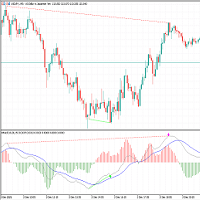
The Macd Signal with DIF line, DEA line and colored Macd Histogram. The Moving Average Convergence Divergence Indicator (MACD) is both a trend–seeking and momentum indicator which uses several exponential moving averages set to closing prices to generate trading signals. The Gray Line is the DIF line. The Blue Line is the DEA line. Version 2.0: New features are added: The indicator can show Classical bearish divergence, Classical bullish divergence, Reverse bearish divergence and Reverse bullish

MACD Intraday Trend PRO is an Indicator developed through an adaptation made of the original MACD created by Gerald Appel in the 1960s. Through years of trading it was observed that by changing the parameters of the MACD with Fibonacci proportions we achieve a better presentation of the continuity of the trend movements, making that it is possible to more efficiently detect the beginning and end of a price trend. Due to its efficiency in detecting price trends, it is also possible to identify ve

This indicator displays buy or sell signals according to Bill Williams' definition of the Trading Zone. [ Installation Guide | Update Guide | Troubleshooting | FAQ | All Products ] Easy to use and understand Avoid trading flat markets Deterministic indicator with clear rules The indicator is non-repainting It implements alerts of all kinds It has straightforward trading implications. A blue arrow is a buy signal A red arrow is a sell signal According to Bill Williams trading in the zone helps t

A ‘Supertrend’ indicator is one, which can give you precise buy or sell signal in a trending market. As the name suggests, ‘Supertrend’ is a trend-following indicator just like moving averages and MACD (moving average convergence divergence). It is plotted on prices and their placement indicates the current trend. The Supertrend indicator is a trend following overlay on your trading chart, much like a moving average, that shows you the current trend direction. The indicator works well in a tren

Simple and fast MACD oscillator with MACD and signal lines and two-color histogram.
I wasn't happy with the Meta Trader MACD oscillator as it's not immediate to read and the other ones I tried felt a bit laggy or added unneeded features on top, so I decide to make one that feels familiar to me. I hope you will find it useful!
Contact me for any issues or bugs and I will try to help the best I can.

A lot of professional traders use high quality divergence signals as a part of their strategy to enter a position. Spotting correct divergences quickly can often be hard, especially if your eye isn’t trained for it yet. For this reason we’ve created a series of easy to use professional oscillator divergence indicators that are very customisable so you get only the signals you want to trade. We have this divergence indicator for RSI, MACD, Stochastics, CCI and OBV. RSI: https://www.mql5.com/en/
A lot of professional traders use high quality divergence signals as a part of their strategy to enter a position. Spotting correct divergences quickly can often be hard, especially if your eye isn’t trained for it yet. For this reason we’ve created a series of easy to use professional oscillator divergence indicators that are very customisable so you get only the signals you want to trade. We have this divergence indicator for RSI, MACD, Stochastics, CCI and OBV. RSI: https://www.mql5.com/en/ma
A lot of professional traders use high quality divergence signals as a part of their strategy to enter a position. Spotting correct divergences quickly can often be hard, especially if your eye isn’t trained for it yet. For this reason we’ve created a series of easy to use professional oscillator divergence indicators that are very customisable so you get only the signals you want to trade. We have this divergence indicator for RSI, MACD, Stochastics, CCI and OBV. RSI: https://www.mql5.com/en/

A lot of professional traders use high quality divergence signals as a part of their strategy to enter a position. Spotting correct divergences quickly can often be hard, especially if your eye isn’t trained for it yet. For this reason we’ve created a series of easy to use professional oscillator divergence indicators that are very customisable so you get only the signals you want to trade. We have this divergence indicator for RSI, MACD, Stochastics, CCI and OBV. RSI: https://www.mql5.com/en/

A lot of professional traders use high quality divergence signals as a part of their strategy to enter a position. Spotting correct divergences quickly can often be hard, especially if your eye isn’t trained for it yet. For this reason we’ve created a series of easy to use professional oscillator divergence indicators that are very customisable so you get only the signals you want to trade. We have this divergence indicator for RSI, MACD, Stochastics, CCI and OBV. RSI: https://www.mql5.com/en/

Binary Options Assistant (BOA) Multi Currency Dashboard for Binary Options (MT5) .
You can use any of the BOA Signals Indicators with the dashboard. Just change the BOA Signals Indicator Name in the dashboard settings to the indicator you want to get signals from. For example: CHILL. BLAZE: BOA_BLAZE_Indicator_v1 Strategy : BLW Online Trading Binary Options Strategy (3 Moving Average)
LAVA: BOA_LAVA_Indicator_v1 Strategy: Lady Trader Binary Options Strategy (Bollinger Bands & Stoc

This indicator looks for SIGNS of Buy and Sell
14 SIGNS: Crossover of 2 moving averages; Crossover of 3 moving averages; RSI Indicator; Stochastic Indicator; Crossing line 0 MACD;
Divergence of the RSI indicator; Divergence of the MACD indicator;
Divergence of the OBV indicator;
Divergence of the STOCHASTIC indicator; Three white soldiers candle pattern; Three black crows candle pattern; Hanging man candle pattern; Hammer candle pattern; Rupture Bands Bollinger.
The indicator plot
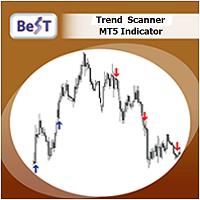
BeST_Trend Scanner is an MT5 Indicator that uses a proprietary algorithm in order to identify the most likely levels and probable moment for an upside or a downside trending price move.
BeST_Trend Scanner is a very useful tool that defines in advance and with a high statistical percentage of accuracy the subsequent Resistance & Support Levels of the anticipated upside or downside trending move of price and so
When used at its Reverse Entries Mode :
It generates Buy or Sell arrows at the

Binary Options Assistant (BOA) BURN Signals Indicator provides signals based on Ana Trader Binary Options Strategy. Indicators: MACD & Stochastic
Stop missing trades, stop jumping from chart to chart looking for trade set-ups and get all the signals on 1 chart! U se any of the BOA Signals Indicator with the Binary Options Assistant (BOA) Multi Currency Dashboard . All BOA Signal Indicator settings are adjustable to give you more strategy combinations. The signals can be seen visually and hea

DYJ TRADINGVIEW is a multi indicator rating system, using the rating signals counts and analysis tools to find entry opportunities in global markets DYJ TRADINGVIEW has 10 built-in indicators for market analysis. Indicator-based analysis is used by many traders to help them make decisions on what trades to take and where to enter and exit them. We use several different types that can complement each other well. Use us to follow your market, You can find more accurate transactions. The trend ind

Use the opportunities of the MACD with maximum efficiency. Choose the price, filters and averaging method, all possible parameters. A unique feature of "MACD by MK"is the amplified signal line. The bends of the indicator have color designations and are additionally reflected on the main chart. By correlating them and the initial price, make your trading more qualitative. For ease of use, a neat ZigZag has been added
A remarkable property of "MACD by MK" is the detection of motion attenuation.

A flexible 2-Line MACD indicator The default MACD indicator inside MT4, limits you to using the MACD with a fast-EMA, slow-EMA. This MACD indicator allows you to set your own MA-Method choices for these 2 components, separately! You can select from SMA, EMA, SMMA, LWMA, ADAPTIVE MA, FRACTAL MA, DEMA, TEMA, VARIABLE INDEX DYNAMIC MA, and can even use a separate method for each 2 fast-slow. The signal line has options from SMA-EMA-SMMA-LWMA. On-chart colored candles, with drawing condition types i

The Boom And Crash Spike Entry This Indicator is Also Developed To milk the BOOM and CRASH indices . Free EA/Robot Also available based on the indicator DM after purchase of the indicator to get the EA/Robot for free and it's results. You get the EA only if you buy the indicator not rent it. It works On all Boom and Crash pairs (boom 300, 500, 1000 & Crash 300, 500, 1000) I would Highly recommend that you use this indicator to Catch spikes on Boom and Crash for higher win rate and accuracy

I have been trading and designing indicators and EAs for the last 5 years, and with great pride and excitement, I am honored to present FMC Alert(Forex Market Conditions Alert) to you all!
If you are a fan of the traditional indicators like the stochastic indicator, macd and moving averages, but if you would like a complete indicator that can utilize all these indicators, and some others, then the F.M.C Alert is the indicator for you. F.M.C Alert is an indicator that allows traders to customiz
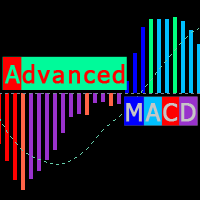
Modified MACD, for technical analysis of charts, with color backlight of histogram signals. The indicator highlights, the direction of the histogram movement, the change in the direction of the histogram movement, the histogram peaks, the interaction of the histogram and the signal curve. Also, the indicator makes it easier to find convergences / divergences between bars and the histogram (which serve as a powerful signal in some trading systems using the MACD indicator). Color designation of Ad

Brief description The ContiStat indicator calculate statistic frequency of green (up) and red (down) movement in the chart and determine movement dynamics (silver curve). There are two key parameters to understand the ContiStat principle: Block height and Block count . The ContiStat engine convert instrument price chart move to Blocks of constant height (price) regardles of how much time it take. Example 1: Block height is set to 50. DE30 index price make move from 15230 to 15443 in an hour. 4 g

Among the top indicators offered here on the market in terms of value for money.
I recommend you to read the product's blog (manual) from start to end so that it is clear from the beginning what the indicator offers. This supply and demand zone indicator draws the zones on the chart and sends alerts when the price has reached or broken a zone. It has support for one nested zones (zones on one other time frame than the current) which will also be drawn on the chart and involve alerts. It

KT MACD Alerts is a personal implementation of the standard MACD indicator available in Metatrader. It provides alerts and also draws vertical lines for the below two events: When MACD crosses above the zero line. When MACD crosses below the zero line.
Features It comes with an inbuilt MTF scanner, which shows the MACD direction on every time frame. A perfect choice for traders who speculate the MACD crossovers above/below the zero line. Along with the alerts, it also draws the vertical line
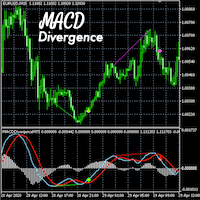
MACD Divergence Detector MT5
- Non-repainting - Live divergence detection - Accurate MACD indicator - Includes 10 indicator buffers - EA friendly - Includes useful customizable settings - Decide which buffers to display on the chart and their colors
The MACD Divergence Detector for MT5 is an accurate and useful tool for detecting and displaying MACD divergences and good places to take long and short trades. It includes 10 buffers and customizable settings. This tool does not repaint and ca

MACD with fast and slow EMA. Moving average convergence divergence (MACD) is a trend-following momentum indicator that shows the relationship between two moving averages of a security's price . The MACD is calculated by subtracting the fast-period exponential moving average (EMA) from the slow-period EMA. Setup options: Fast EMA period Slow EMA period Signal EMA period Applied price Indicator window height Color MACD Color Signal Color Histogram

Volatility Vision: Essential for Forex and Stock Markets
Discover Volatility Vision: Your Trading Revolution Perfect for Both Beginners and Expert Traders Easy Start Guide: Learn how to use it effectively with our User Manual .
The Volatility Vision indicator is a powerful tool that maps out precise volatility levels on your charts. This versatile tool is essential for integrating into your trading strategy, compatible across all currency pairs and stock markets. Utilize volatility thresholds

Awesome Oscillator by Bill Williams with the ability to fine-tune and replace the averaging algorithms of the indicator, which significantly expands the possibilities of using this oscillator in algorithmic trading and brings it closer in its properties to such an indicator as the MACD. To reduce price noise, the final indicator is processed with an additional Smooth averaging. The indicator has the ability to give alerts, send mail messages and push signals when the direction of movement of th

Accelerator Oscillator by Bill Williams with the ability to fine-tune and replace the averaging algorithms of the indicator, which significantly expands the possibilities of using this oscillator in algorithmic trading and brings it closer in its properties to such an indicator as MACD.
To reduce price noise, the final indicator is processed with an additional Smooth averaging. The indicator has the ability to give alerts, send mail messages and push signals when the direction of movement

Wink IND is an indicator that tell you: -when MACD is saying buy or sell -when RSI is saying buy or sell -work on multi timeframes MT4 Version
by Wink IND: you don't need to have Knowledge about MACD or RSI don't need to check and compare MACD and RSI respectly don't need to check all of timeframes and compare the resaults don't lose time, save more time for your decisions in trading
Wink IND: multi timeframe indicator multi currency indicator show the positions by graphic shapes, arrows an

This indicator belongs to the family of channel indicators. These channel indicator was created based on the principle that the market will always trade in a swinging like pattern. The swinging like pattern is caused by the existence of both the bulls and bears in a market. This causes a market to trade in a dynamic channel. it is designed to help the buyer to identify the levels at which the bulls are buying and the bear are selling. The bulls are buying when the Market is cheap and the bears a

KT XMaster Formula is a buy & sell signal indicator that works magically on most of the timeframes and currency pairs when used correctly.
The indicator uses calculations based on moving averages, RSI, and MACD. It is usually appropriate for scalping and trend trading - whether you are a novice or an experienced trader, the signals generated by this indicator are simple to understand and implement.
Overview The indicator comprises green and red dots arranged in wavy lines. These dots corre

MACD Scanner provides the multi symbols and multi-timeframes of MACD signals. It is useful for trader to find the trading idea quickly and easily. User-friendly, visually clean, colorful, and readable. Dynamic dashboard display that can be adjusted thru the external input settings. Total Timeframes and Total symbols as well as the desired total rows/panel, so it can maximize the efficiency of using the chart space. The Highlight Stars on the certain matrix boxes line based on the selected Scan M

Divergence indicator 10 different indicators. Finding and displaying classic and hidden divergences.
Indicators in which divergences are searched: MACD MACD Histogram; RSI; Stochastic; CCI; momentum; OBV; VWmacd; Chaikin Money Flow; Money Flow Index. This is a replica of the indicator from the tradingview resource, adapted for the MT5 terminal.
MT4 version available here: https://www.mql5.com/en/market/product/87846
Settings: Bars in history for analysis - number of bars for analysis

Multiple Timeframe MACD indicator. This indicator was built for making multiple timeframe analysis possible in MT5 using MACD Indicator. MACD Indicator traditionally shows two lines and one histogram. MACD Line(Yellow) is calculated by subtracting 12period EMA(fast) from 26period EMA (slow). Signal Line(Blue) is created by a 9period EMA from MACD Line. Histogram is just the difference between MACD and Signal lines. Histogram is colored based on the difference between its value and the previous h
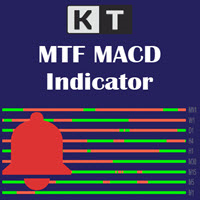
As a trader, monitoring multiple timeframes simultaneously will help you better understand the trend and know when multiple timeframes are in agreement or disagreement. The KT Multiple Time Frame (MTF) MACD displays the overall direction of an instrument in one chart by showing the moving average convergence divergence (MACD) for all time frames. The indicator displays a simple table with the respective MACD trend for each timeframe. You can also see whether MACD is gaining or losing momentum ac
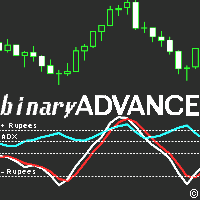
Update 2.2: Added MFI with predictive mod. Updated all indicators to reflect similar values, to combine multiple ones to rest well on overbought/oversold lines.
Update 2.3: Minor bug fixes.
Update 2.4: Removed buggy indicators DeMarker, and MACD, as it was too complicated and not as accurate as the rest due to it's nature. Added Awesome Oscillator. removed spreads, as it bogged the indicator down. Added other features, like indicator value compensators to match each other's levels when combine
What is a Point of Interest? Traders who follow Smart Money Concepts may call this a Liquidity Point, or areas pools of liquidity have been built up by retail traders for for Big Banks to target to create large price movements in the market. As we all know, retail traders that use outdated and unreliable methods of trading like using trendlines, support and resistance, RSI, MACD, and many others to place trades and put their stop losses at keys points in the market. The "Big Banks" know these me

Inspired investing.com Technical Indicators, this indicator provides a comprehensive view of the symbol by synthesizing indicators including: RSI, StochRSI : have 3 level oversold - red, midle (aqua when upper, pink when lower), overbuy – blue Stoch: oversold – red, overbuy- blue, aqua when main line < signal line, pink when main line > signal line MACD: aqua when main line < signal line, pink when main line > signal line ADX: aqua when line plus > line minus, pink when line plus < line minus

This is similar in it's idea as the Binary Advance/Lite indicator, but this is intended to use as a levels indicator, as well as trend reversal and how ranging the market is. It takes several useful indicators and combines them in such a way as to declutter your charts, yet prove even more useful together, than separate. RSI, RVI, DeMarker, MACD are added together then multiplied by ATR and StdDev to reveal multiple factors: How far the price has changed, and as the price slows down and reverses

Type(1EMA,2DEMA,3TEMA) FastPeriod SlowPeriod SignalPeriod PriceApplied ( HIGH(H) LOW(L) OPEN(O) CLOSE(C) MEDIAN(HL) TYPICAL(HLC) WEIGHTED(HLCC) )
Deviate Up Deviate Down Deviate Bar
What Is Moving Average Convergence/Divergence (MACD)? Moving average convergence/divergence (MACD, or MAC-D) is a trend-following momentum indicator that shows the relationship between two exponential moving averages (EMAs) of a security’s price. The MACD line is calculated by subtracting the 26-pe

Macd Ruby , ruby pack flag 2 It has the strategy of the crossing of moving averages, where is the first cross for the rise or for the downside, get into position It serves to catch long trends also in other temporalities, and to scalp at low times, works for forex markets all pairs It works for the synthetic indices markets all pairs! works great on volatility and jumps!

Black Card Pack Indicator 5/2 Macd Divergence Black It has the strategy of the cross of emas and the different lines as well seen in the photo! works for all seasons works for forex markets and synthetic index markets ideal for volatility 75, volatility 100, volatility 25 and volatility 50 pairs for all jumpers! for forex works on all pairs! eur/usd , usd/jpy , eur/aud etc !

The rubdfx divergence indicator is a technical analysis tool that compares a security's price movement. It is used to identify potential changes in the price trend of a security. The indicator can be applied to any type of chart, including bar charts and candlestick charts.
The algorithm is based on MACD, which has been modified to detect multiple positive and negative divergences. Settings
___settings___ * fastEMA * slowEMA * signalSMA *Alerts: True/False
#Indicator Usage
B

Macd Sar! is a gcd indicator combined with the parabolic sar indicator! It has the strategy of breaks, where the gray line crosses above the pink lines, and exchange of parabolic sar points, it is marking purchase for sale is vice versa, works for all seasons! It is good for scalping, and to do lengths suitable for forex markets and synthetic indices! Good profit! World Investor.

Macd diverge! It is a macd indicator where it goes with the divergence indicator and arrows that mark the sale and purchase of the pair! It is very easy to use and at first glance you can see that you don't have to do a lot of analysis since the divergence marks the sail too! It can be used in all seasons! It is used for scalping! works for forex markets for crypto and synthetic index markets too! Good profit! World Investor.

macd rsi It is a macd indicator added to the rsi to capture perfect entries in the average crossovers! As seen in the indicator, it has 2 lines, one of gold color and the other violet line, where the cross of the violet with the gold downwards is a sell signal when it crosses the violet up from the gold it is a buy signal! very good to make shorts works for forex markets and synthetic indices It is used in any temporality! Good profit! World Investor.

MACD (short for M oving A verage C onvergence/ D ivergence) is a popular trading indicator used in technical analysis of securities prices. It is designed to identify changes in the strength, direction, momentum, and duration of a trend in a security's price.
History Gerald Appel created the MACD line in the late 1970s. Thomas Aspray added the histogram feature to Appel's MACD in 1986.
The three major components and their formula 1. The MACD line: First, "PM Colored MACD" employs two

Define your own candlestick pattern and this indicator will show on the screen when this pattern appears You can test it for free in the Strategy Tester and see how many times your candlestick pattern appears on the asset of your choice You can also paint all candles of your pattern or just one This indicator is useful for candlestick analysis, for you to use in price action and with naked trade strategies. It is an indicator that shows the movement you choose
How to Use the Indicators: AC AC[

Macd Neptune! It is a modified macd oscillator where it better captures sales and purchases the indicator clearly marks the crossing of moving averages, In addition to that, it marks the purchase and sale with each color, for sale marks the salmon line in the purchase mark the blue line where it gives you the signal changing color is giving you the entrance! It is used in any temporality, used for forex markets and synthetic indices good profit World Investor

What Is Moving Average Convergence/Divergence (MACD)? Moving average convergence/divergence (MACD, or MAC-D) is a trend-following momentum indicator that shows the relationship between two exponential moving averages (EMAs) of a security’s price. The MACD line is calculated by subtracting the 26-period EMA from the 12-period EMA. The result of that calculation is the MACD line. A nine-day EMA of the MACD line is called the signal line, which is then plotted on top of the MACD line,
This is a simple arrow system based on MACD indicators Main/Base line and MACD Levels. It gives you alerts when MACD's Main Line crosses above/below certain level. Which type of alerts available? 1. It paints on chart Up/Down Arrows. 2. Popup message and sound alert in trading terminal window. 3. Push notification or Alert on your android and ios mobile phones (requires MT4 or MT5 app installed!)
This is a modern MACD indicator based on regular MACD indicator. It also has alert system included. This indicator gives you alerts when base line of MACD indicator crosses above or below Zero level so you can look for Buy or Sell opportunity. Available Alerts: 1. Audible Alerts on Chart / Trading Terminal window. 2. Alerts on your email. 3. Alerts on your mobile phone. Type of Alerts Explained: 1. Audible_Chart_Alerts - Audible alerts and Popup message on your computer’s tr
The MetaTrader Market is a simple and convenient site where developers can sell their trading applications.
We will help you post your product and explain you how to prepare your product description for the Market. All applications on the Market are encryption-protected and can only be run on a buyer's computer. Illegal copying is impossible.
You are missing trading opportunities:
- Free trading apps
- Over 8,000 signals for copying
- Economic news for exploring financial markets
Registration
Log in
If you do not have an account, please register
Allow the use of cookies to log in to the MQL5.com website.
Please enable the necessary setting in your browser, otherwise you will not be able to log in.