Watch the Market tutorial videos on YouTube
How to buy а trading robot or an indicator
Run your EA on
virtual hosting
virtual hosting
Test аn indicator/trading robot before buying
Want to earn in the Market?
How to present a product for a sell-through
Technical Indicators for MetaTrader 5 - 21

Measures the average price and Maximum Stop Loss accepted, adjustable Measures too the projected average price (For Pending entrys), in case you have a open position and pending orders to scale in shows how much it will increase or decrease the average price after fullfilling that pending orders! It shows too the Stop Loss based on the projected average entry, how much it has to be stoped out to fullfill your risk management, after fullfilling that pending orders
FREE

This indicator displays breakouts on Point-And-Figure-like or Kagi-like custom symbol charts, generated by special expert advisers, such as PointFigureKagiCharts . This indicator is applicable only for custom instruments generated in appropriate way (with time-invariant bars which are multiples of a predefined box size). It makes no sense to apply it to other charts. The breakouts in up or down direction are marked by arrows. The breakout price is found at crossing of one of imaginary lines of
FREE

Tick imbalance bars (TIB), described in the book Advances in Financial Machine Learning (2018) by Marcos López de Prado. Indicator that show candlestick bars with an different sampling method than time fixed. Real time data is sourced to the indicator and it may be used as substitute of the default graph. Each bar is formed when a predefined tick balance is exceeded, showing in the graph the OHLC of this cluster of ticks. The input variable is the amount of ticks of each bar. The indicator may
FREE

Financial Indicator SolarTrade Suite: Mercury Market Indicator - Your Reliable Guide in the World of Financial Markets!
It is a moving average that uses special innovative and advanced algorithms to calculate its value and also has a design that is pleasing to the eye.
It is very simple to understand the readings of this indicator: blue color - buy, red color - sell. The brighter the color, the stronger the signal.
Check out our other SolarTrade Suite products at the bottom of the descrip

Hi there! Since I am starting commercial and non-commercial product publishing I would highly appreciate: If you like this product, please rate it. That will help to promote not only this product, but indirectly another ones. So, such promotion will help to make some money from commercial products. Thus, I will have opportunity to fund my another directions of trading researches like bot development using mql4 and mql5 programming languages as well as python written products like crypto bots. If
FREE

The ColorBars Indicator paints bars with different colors depending on the volume changes. If the volume has increased, the color is green, overwise the color is red.
FREE

This creative simple indicator will provide a precise framework for market sentiment within technical analysis of different timeframes. For instance, for traders like me that uses "Mark Fisher" strategy regularly, this is a perfect indicator for having an insight to markets from short term to long term point of view, using Break points of candles' lows and highs and perfect to combine with "Price Action" . For more options and modifications you can also edit the low timeframe candles withi
FREE

The Market Thermometer can be used to help traders identify sleepy or turbulent periods. It helps beginners to check when is the ideal time to enter operations, that is, when the value of the thermometer is below its average for several periods, identifying a peaceful market. When the market is heated, that is, the thermometer is above three times its average, it is time to make profits. The Thermometer measures the extent to which the end of a period, maximum or minimum price, projects out
FREE

ATR Accelerator Indicator informs you about strong price movements based on the ATR Indicator. This Indicator works for all Timeframes and Symbols, the strength of movements can be configured.
Important: Get informed about new Products, join our MQL Channel: https://www.mql5.com/en/channels/etradro
Useage This Indicator works for all Timeframes and Symbols, the strength of movements can be configured. Features works on all timeframes and forex pairs or indices. Alert and Notify function i
FREE

Indicador baseado no ATR (Avarage True Range) que exibe o tamanho em pips ou pontos do ativo. O indicador ATR SIZE ALERT dispara um alerta caso o preço atinja o numero de pips pre definido pelo usuário: Input: Periodo (periodo do indicador ATR) Pips (tamanho do movimento esperado) Alert (alerta sonoro) Além do alerta sonoro, o indicador também possui alerta visual.
FREE

candlestick time it a useful indicator ,it help to keep you alert with the candlestick time ,how far to be completed at the chosen period , it help to keep you patience which is a biggest thing that holds trades down ,try it to improve you way of trading. it work on any broker any time frame and any symbol. you can customize the color on input. it can work on multiple timeframe. Thank you !
FREE

The VWAP Level indicator is a technical analysis tool that calculates the weighted average price for the traded volumes of a specific asset. The VWAP provides traders and investors with the average price of an asset over a specific time frame.
It is commonly used by investors to compare data on "passive" trading operations, such as pension funds and mutual funds, but also by traders who want to check if an asset has been bought or sold at a good market price.
To calculate the VWAP level we
FREE

New candlestick alert, the alert appears according to the timeframe it is placed on. The indicator works on any asset, the alert can be silenced at any time, without the need to remove the indicator from the graph. It's great for those who can't keep an eye on the chart all the time. You can use this tool at work, college or anywhere else. It is also possible to receive signals directly on your cell phone by connecting to the metatrader. Aurélio Machado.
FREE

Indicator that show candlestick bars with an different sampling method than time fixed. Real time data is sourced to the indicator and it may be used as substitute of the default graph. Each bar is formed when a predefined volume of assets was dealt, showing in the graph the OHLC of this clustering. The amount of bars is proportional to the amount of negotiations instead of a sample in a fixed amount of time. If the broker doesn't show the real volume of the trades, this indicator won't work. Th
FREE

this indicator has the finality of show in graph the size of candle in formation to show the force of market in some moments of the day. This indicator is free and based on example disponible on the comunity. I'm disponibilizing here to anyone who don't know about programing. Please enjoy this indicator and leave a coment or a rate to help this indicator to other people who needs.
FREE

Multicurrency and multitimeframe modification of the Commodity Channel Index (CCI) indicator. You can specify any desired currencies and timeframes in the parameters. Also, the panel can send notifications when crossing overbought and oversold levels. By clicking on a cell with a period, this symbol and period will be opened. This is MTF Scanner. The key to hide the dashboard from the chart is "D" by default.
Parameters CCI Period — averaging period.
CCI Applied price — price type.
Clea

The indicator plots a curve of the difference between the values of two trading instruments (currency pairs).
The purpose of the indicator is to observe the processes of divergence and convergence of the values of two trading instruments. The results obtained can be used for trading strategies of statistical arbitrage, pair trading, correlation, and others.
Trading strategy
The indicator is attached to the chart of any trading instrument. In the input parameters, the names of trading i
FREE

This particular moving average adjusts to the average number of highest highs and lowest lows recorded over a defined period, thereby accommodating changes in trend strength. Utilizing this moving average in a crossover system or as dynamic support/resistance can yield compelling outcomes. Configuration: Length: Determines the indicator's period, with larger values delivering smoother outcomes. Application: The Dynamic Trend Adaptive Moving Average functions akin to conventional moving averages,
FREE

Este poderoso indicador analisa o gráfico e mostra zonas de Rejeição de Preços! Isto é, locais onde o preço foi, mas não foi aceito pelo mercado! A visualização desta zona de Rejeição, facilita o entendimento do trader na tomada de decisões de onde operar e como operar!
O indicador é composto por 4 linhas, sendo classificadas em 2 grupos: Linhas Vermelha e Amarela: Denotam os extremos onde o preço conseguiu chegar, mas não foi aceito! Linhas Laranja e Azul: A partir delas, denotam o Início da
FREE

Highly configurable Adx indicator.
Features: Highly customizable alert functions (at levels, crosses, direction changes via email, push, sound, popup) Multi timeframe ability Color customization (at levels, crosses, direction changes) Linear interpolation and histogram mode options Works on strategy tester in multi timeframe mode (at weekend without ticks also) Adjustable Levels Parameters:
ADX Timeframe: You can set the lower/higher timeframes for Adx. ADX Bar Shift: you can set the
FREE

Es un indicador que no se repinta y que muestra la tendencia a corto plazo. contiene lo siguiente: Visual Mode MA Period MA Method MA Price
ATR Period Volatility Factor Offset Factor Use Break Use Envelopes Use Alert
cualquier sugerencia hagamelo saber en los comentarios y también colocar estrellas para postear más contenido, indicadores y advisor actualizadas
FREE

Технический индикатор Trend Moving Average позволяет определить глобальное направление рынка. Данный технический индикатор создан для того, чтобы определить «линию наименьшего сопротивления» рынка и понять в какую сторону направлен тренд. Помимо классического использования МА, индикатор позволяет понять направленность рынка на основе динамики его значений. Так, если значение индикатора демонстрируют переход с нисходящего значения в восходящее (и наоборот) - это является дополнительным торговым с
FREE
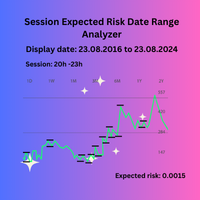
Session Expected Risk Date Range Analyzer: Analyzes price data across specified date ranges to provide detailed insights into financial risk and volatility, using each bar's price metrics for accurate risk assessment.
The Session Expected Risk Date Range Analyzer is a sophisticated tool designed to offer traders and analysts detailed insights into the expected financial risk across specific date ranges. Unlike traditional session-based analysis, this indicator focuses on calculating risk met
FREE

Synthetic Reverse Bar is an evolution of Reverse Bar indicator. It is well-known that candlestick patterns work best at higher timeframes (H1, H4). However, candlesticks at such timeframes may form differently at different brokers due to dissimilarities in the terminal time on the single symbol, while the history of quotes on M1 and M5 remains the same! As a result, successful patterns are often not formed at higher timeframes! Synthetic Reverse Bar solves that problem! The indicator works on M5

The Fibonacci indicator automatically displays the Fibonacci retracement levels, representing significant support and resistance. The range for calculating the indicator can be taken from the previous day, week, month, year or user-specified session.
Levels 100 % (High) of the range from the previous session. 0 % (Low) of the range from the previous session. 76,4 % of the range from the previous session. 61,8 % of the range from the previous session. 50 % of the range from the previo
FREE

The RFOC Mini Chart was created to project a macro view of the market, which the option to select the timeframe of interest other than the main chart, it is possible to include 2 indicators: 1 - Moving average channel On the mini chart, the moving average will be created based on the prices of the selected time frame for the RFOC Mini Chart. The moving average period must be selected in the indicator settings pannel.
2 - Boillinger Band In the mini chart, a boillinger band will be created base
FREE

The most sensitive indicator you've ever seen . . .
POscillator is a sensitive indicator to find each trend direction change in every timeframe. It shows price variations and reveals up or down trends. POscillator makes a price curve based on frequency filters. The procedure makes two price functions by using high-frequency and low-frequency filters separately. Then it adds them together to create a smoothed price curve. The final stage of the indicator converts this smoothed curve to an osci
FREE

The Trail Stops Point indicator shows the deviation from the current price by a certain distance. It has been developed as an additional indicator for Trail Stops by Custom Indicator , to provide a simple trailing of a position stop loss at a specified distance in points.
Indicator Parameters Distance - trailing stop distance in points. Buffer numbers: 0 - Support, 1 - Resistance.
FREE

Индикатор Color служит помощником для начинающего или опытного трейдера для выявления краткосрочного тренда или глобального в зависимости выбранного тайм фрейма, а так же для выявления флетовой зоны, которая очень хорошо видна в местах длинной проторговки в одной зоне индикатора Color. Индикатор не перерисовывается на завершённой свечи , но в моменте появления свечи и образования сигнала, может быть отклонён в прорисовке. Особенности работы индикатора Хорошо определяет тренд на волатильных инстр
FREE

This is my version of Currency Strength Meter.
One of the best indicators for spotting weak and strong currencies. Based on the information obtained, its very simple to decide which currency buy and which sell.
It is very simple to use, but extremely effective.
General rules are: - Buy currencies above level 0
- Sell currencies below level 0
You can also mix the main currencies together -->
EURUSD > 0 and USDJPY < 0 --> BUY on EURJPY
FREE

SSACD - Singular Spectrum Average Convergence/Divergence This is an analogue of the MACD indicator based on the Caterpillar-SSA ( Singular Spectrum Analysis ) method. Limited version of the SSACD Forecast indicator. Limitations include the set of parameters and their range.
Specificity of the method The Caterpillar-SSA is an effective method to handle non-stationary time series with unknown internal structure. The method allows to find the previously unknown periodicities of the series and mak
FREE

The indicator displays the value of ROC (Rate of change) from the selected price or moving average as a histogram. You can plot the moving average ROC values for smoothing indicator.
Displayed Data ExtROC - rate of change ExtMAROC - smoothing line
Parameters You can change the price, on which the indicator is calculated.
Inputs InpMAPeriod - in case you want to calculate the moving average ROC, enter averaging period. Enter 1 for the calculation of the specified prices. InpMAMethod - smoot
FREE

SHADOW vous donne des signaux d'achat et de vente solides avec un risque minimal. Vous pouvez voir dans quelle direction le prix évolue et la force du mouvement. Shadow filtre le bruit du marché et améliore radicalement les performances des traders.
Points forts: Détection visuelle efficace des tendances. Bruit du marché des filtres Ne repeint ni ne recalcule jamais. Signaux strictement sur "fermeture du bar". Fonctionne dans tous les symboles. Pop-up intégré, e-mail, notification push e
FREE

Description The Profit and Loss Indicator by Creative Tech Solutions is a robust and comprehensive tool designed to help traders monitor their trading performance in real-time. This indicator provides detailed metrics on profits and drawdowns, ensuring traders are always informed about their trading activities and performance. With customisable alerts and display settings, this indicator is an essential tool for any serious trader. Features Real-Time Metrics : Monitor profit and drawdown percent
FREE

The Volume Plus indicator for MT5 can be effectively used for detecting imbalances in supply and demand.
The indicator improves on the typical volume histogram by coloring the bars.
Bar colors (colors are customizable):
Neutral - DimGray Wide Spread (Range) Bar on High Volume - MediumBlue Narrow Spread, High Volume - MidnightBlue Wide Spread, Low Volume - ForestGreen Narrow Spread, Low Volume - DarkGreen Very/Ultra Wide Spread, Low Volume - Aqua Narrow Spread, Ultra High Volume - Purple V
FREE

This indicator displays the spread Simple and easy to use and fully customisable: View as Pips or Pipettes Chart symbol can be hidden Text display can be changed Change color and text styles Add or hide a decimal point Spacing options between inputs Default screen positions Screen position inputs
How to use 1. Simply use the default settings; or 2. Choose to show pips or pipettes; 3. Choose to display symbol, text or decimal; 4. Choose where to place it on the screen; 5. Save settings or save
FREE
FREE

This is an OLD indicator which was rather efficient to be paired with MA Cross, Bollinger Bands, Dochian Channel and many other strategies and this provides you with market change of BEAR and BULL trends. Since there isn't much listed in MT5 Market, I would like to share my very own indicator for your usage. Please feel free to comment or criticize for better and improvement of the indicator listed.
FREE

Acceleration Points is a powerful tool for detecting critical points of price movement, based on the idea of calculating the acceleration of price fluctuations.
_________________________________
How to use the indicator signals:
The indicator generates a signal after a new price bar appears. It is recommended to use the generated signal after the price breaks through the critical point in the specified direction. The indicator does not redraw its signals.
______________________________
FREE

What is this indicator? This indicator is the MACD (Moving Average Convergence/Divergence) supporting Virtual Trading mode of Knots Compositor . When the mode is turned on, the indicator will be recalculated based on the displayed candlesticks. When the mode is turned off, the indicator will be recalculated based on the original chart candlesticks.
Types of the applied price - Close - Open - High - Low - Median Price (HL/2) - Typical Price (HLC/3) - Weighted Price (HLCC/4)
KC-Indicators
FREE

Indicator that show candlestick bars with an different sampling method than time fixed. Real time data is sourced to the indicator and it may be used as substitute of the default graph. Each bar is formed when a predefined amount of ticks is received, showing in the graph the OHLC of this clusteri of ticks. The input variable is the amount of ticks of each bar. It's a different approach of sampling, the amount of bars is proportional to the amount of negotiations insted of a sample in a fixed am
FREE

Property of Vertical Capital Edition: Gugol_Quants About USA INDEXES QUANT_INDICATOR: This is a indicator created by math modulation to be used as a trading tool, which was developed in MQL. (MT5) This indicator is for use only with US500(S&P500), NAS100(Nasdaq Composite) and US30(Dow Jones). Signals are activated on "Open" Candle. It’s based on Intraday/Swing Trades whose main timeframe is H1, H2, H3 and H4. However you can use it with other assets by testing with the appropriate settings. *
FREE

Do you already know the Start Midas indicator?
What about the Vwap Standard Deviation indicator?
And I need to speak again in the book MIDAS Technical Analysis ...
The Start Midas SD Channel indicator combines the two in one, bringing the practicality and efficiency of Midas with the statistical calculation of the standard deviation.
All of this with the practicality of the White Trader Start indicators, where you can plot the indicator and move them on the screen using keyboard s

Necessary for traders: tools and indicators Waves automatically calculate indicators, channel trend trading Perfect trend-wave automatic calculation channel calculation , MT4 Perfect trend-wave automatic calculation channel calculation , MT5 Local Trading copying Easy And Fast Copy , MT4 Easy And Fast Copy , MT5 Local Trading copying For DEMO Easy And Fast Copy , MT4 DEMO Easy And Fast Copy , MT5 DEMO
Strongly recommend trend indicators, automatic calculation of wave standard and MT5 ve
FREE

This indicator can identify more than 60 candlestick patterns on the chart, including their bullish and bearish variants. Just choose the pattern you want in the settings.
Available Patterns 2 Crows Gravestone Doji On Neck 3 Black Crows Hammer Piercing 3 Inside Hanging Man Rick Shawman 3 Line Strike Harami Rising and Falling Three Method 3 Outside Harami Cross Separating Lines 3 Stars in South High Wave Shooting Star 3 White Soldiers Hikkake Short Line Abandoned Baby Hikkake Modified Spinning

This indicator efficiently tracks any other timeframe candlesticks which you want to track on same chart 1. Select any higher time frame to load bars on same chart 2. Customize colors, width, background and style of candlesticks and wick width
3. Choose number of bars to draw candlesticks 4. Track higher timeframe complete candles along with wick and body 5. Easy and convenient for those who dont want to switch chart. 6. See candle range { high - low } and change color, font, size 7. Enable / D

Financial Indicator SolarTrade Suite: Pluto Market Indicator - Your Reliable Guide in the World of Financial Markets!
It is a volatility oscillator that uses special innovative and advanced algorithms to calculate its value and also has a nice looking design.
It is very simple to understand the readings of this indicator: green color - low volatility and the best time to open a trade deal, orange color - high volatility and time to think about closing a trading position. The brighter the co
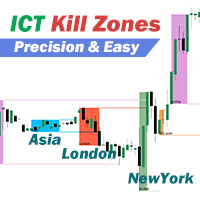
ICT killzones are specific time periods in the market during which trading volume and volatility often increase, In order to help traders have a comprehensive understanding of the market situation and better formulate trading strategies, we have developed a trading session indicator. Identify the five time periods of ICT killzones with different colors, and track the marked price areas within these periods. The high and low pivot reference lines will automatically extend until the pivot price is

When trading using The Strat , it is important to keep an eye on multiple timeframes. This indicator will show the Daily, Weekly, Monthly and Quarterly state of the current candle for each timeframe. A Circle icon shows that the candle on that timeframe is currently an Inside, or Type 1 in TheStrat terminology. An Inside Day candle is consolidating price action, and we are looking for a breakout of the range. A Triangle icon, pointing up or down, is a trending candle, or Type 2 in TheStrat term

The Rubdfx swing indicator is a useful tool for traders looking to identify trend changes in a particular instrument they are trading. It is designed to draw a line on the main chart, and the signals are indicated by color changes with signal alerts. The color green is used to indicate a bullish trend, while the color pink is used to indicate a bearish trend. These colors can be customized to fit the trader's preferences or theme. The Rubdfx swing indicator has the ability to spot both long-te

This indicator detects a flat and paints the found area with a colored rectangle.
The main idea of this indicator is to detect a flat as the price fills a certain area on the chart.
Input parameters:
Color rectangle - color of the rectangle to be shaded.
Bars in rectangle - minimum allowed number of bars in a rectangle.
Density in % - density of the flat, set as a percentage of the rectangle area.
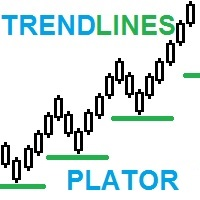
TrendPlator: A Powerful Trend Projection Indicator for Optimized Trading Strategies Discover the power of our new indicator! With the ability to calculate trend lines from larger timeframes and project them directly onto your current timeframe, it provides strategic support that captures the attention of traders. These points become powerful support or resistance levels for your trades, boosting your trading strategy. Imagine having access to an indicator that seamlessly complements your collect

The DR IDR Range Indicator PRO plots ADR, ODR and RDR ranges for a given amount of days in the past. A key feature that appears is that it calculates the success rate of the ranges for the shown days. This indicator is perfect for backtest since it shows ranges for all of the calculated days, not just the most recent sessions. In the PRO version you can now: use fully customizable advanced statistics to base your trades on get an edge via calculating statistics on up to 3 different day period

This multi time frame and multi symbol indicator for MT5 alerts about Heiken Ashi Smoothed color changes. As a bonus it can also scan for Hull Moving Average color (trend) changes. Combined with your own rules and techniques, this indicator will allow you to create (or enhance) your own powerful system. Features
Can monitor all symbols visible in your Market Watch window at the same time. Apply the indicator to just one chart and instantly monitor the entire market. Can monitor every time fram

I recommend you to read the product's blog (manual) from start to end so that it is clear from the beginning what the indicator offers. This multi time frame and multi symbol indicator identifies when the stochastics signal line crosses the stochastics main line. As an alternative it can also alert when stochastics is leaving (without signal line crossing main line) an overbought/oversold area. As a bonus it can also scan for Bollinger bands and RSI overbought/oversold crosses. Combined wi

Free version. Only works on EURUSD Do you want to always know in a quick glance where price is going? Are you tired of looking back and forth between different timeframes to understand that? This indicator might just be what you were looking for. Trend Signal Multitimeframe shows you if the current price is higher or lower than N. candles ago, on the various timeframes. It also displays how many pips higher or lower current price is compared to N. candles ago. Number N. is customizable The data
FREE

Due to Technical and Logical manipulations by Brokerage, I have come a long way to bring this rear indicator that combines numerous strategies that have the following abilities: Market Trend Identification : Understand the overall trend of the market. Reversal Points : Identify potential points where the market may change direction. Entry and Exit Points : Determine optimal times to enter and exit trades. For a comprehensive understanding of how to use this indicator, please watch the accompanyi

Currency strength meter gives you a quick visual guide to which currencies are currently strong, and which ones are weak. The meter measures the strength of all forex cross pairs and applies calculations on them to determine the overall strength for each individual currency.We calculate based the strength of currency based on the trend of 28 pairs.
LIMITED TIME OFFER : Trend CSM Indicator is available for only 50 $. ( Original price 125$ )
By accessing to our MQL5 Blog, you can find all our

The RSI Crossover Alert is a powerful notification system designed specifically for traders who utilize the Relative Strength Index (RSI) in their trading strategies. This indicator focuses on identifying RSI crossovers, which occur when the fast RSI line crosses above or below the slow RSI line. By combining these crossovers, the indicator effectively filters out false signals, allowing traders to make more accurate trading decisions. The RSI Crossover Alert offers several key features

5/10 copies at 30$ ---> next 50$ // MT4 version Forex Vigor is a technical indicator that assesses the momentum strength of the 8 primary currencies (EUR, GBP, AUD, NZD, USD, CAD, CHF, JPY). The indicator relies on mathematical calculations that measure the lack of correlation among 28 currency pairs. To calculate their values, it analyses the percentage difference between the closing prices using the Linear-weighted averaging method (LWMA) plus a statistical system that eliminates values tha

Bollinger Bands % or Bollinger Bands Percentage is one of the indicators used in the Sapphire Strat Maker - EA Builder .
It is calculated using the following formula:
Perc = (CLOSE_PRICE - LOWER_BOLLINGER) / (UPPER_BOLLINGER - LOWER_BOLLINGER) * 100
Thus, by taking the difference between closing price to the lower band and dividing it by the difference of the upper and the lower price levels of a Bollinger Bands indicator, we can calculate this indicator.
It shows how far the price is f
FREE

Simple indicator used in technical strategies to analyze tops, bottoms and reversal or continuation points. Developer information:
Line values and colors:
Buffer 0 : ZigZag line value;
Buffer 1 : ZigZag color value;
Buffer 2 : Median line value;
Buffer 3 : Median color value; Buffer to get the values of each top and bottom. Buffer 4 : Top value;
Buffer 5 : Bottoms value;
Buffer that returns the type of the last direction.
Buffer 9: 0 = Not updated, 1 = High, -1 = Low;
FREE
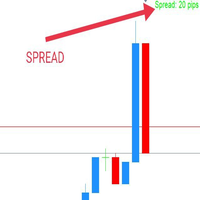
WaSpread MT5 Indicator shows the current spread in pips with color.
* Set the Spread Threshold and the color to identify when the current spread is below or above the Spread Threshold.
* Set X axis and Y axis and chose the Corner and the Anchor to position the Spread Label on the chart.
* Write the font and the font size for more confort.
* Activate alert if the current spread is above the spread threshold.
* For more precision, the user can choose to show the decimal numbers.
* The
FREE

Что такое RSI? Индикатор RSI (Relative Strength Index, индекс относительной силы) — это индикатор, который измеряет соотношение восходящих и нисходящих движений. Расчет ведётся таким образом, что индекс выражается в диапазоне от 0 до 100. Как понять RSI?
Если значение RSI находится равно 70 и больше, считается, что инструмент находится в состоянии перекупленности (ситуация, когда цены выросли выше, нежели того ожидал рынок). Значение RSI на уровне 30 и ниже считается сигналом о том, что инст
FREE

The indicator includes two parts. Part I: Color Candles Show the Major Trend Color candles is to identify the market state by color candlesticks. As shown in the screenshots, if the color is Aqua, the market is in a state when you should place long orders or exit short orders. If the color is Tomato, it is the time to place short orders or exit long orders. If the color is changing, it is better to wait for its completion (until the current bar is closed). Part II: Draw bands The inner bands is

Highly configurable Average True Range (ATR) indicator.
Features: Highly customizable alert functions (at levels, crosses, direction changes via email, push, sound, popup) Multi timeframe ability Color customization (at levels, crosses, direction changes) Linear interpolation and histogram mode options Works on strategy tester in multi timeframe mode (at weekend without ticks also) Adjustable Levels Parameters:
ATR Timeframe: You can set the lower/higher timeframes for ATR. ATR Bar Shift: y
FREE
Ultimate Trend Finder (Multi Pair And Multi Time Frame) : ---LIMITED TIME OFFER: NEXT 25 CLIENTS ONLY ---46% OFF REGULAR PRICE AND 2 FREE BONUSES ---SEE BELOW FOR FULL DETAILS Institutional traders use moving averages more than any other indicator. As moving averages offer a quick
and clear indication of the institutional order flow. And serve as a critical component in the decision making
within numerous institutional trading rooms.
Viewing the market through the same lens as the i

Ultimate Reversal Scanner (Multi Pair And Multi Time Frame) : ---LIMITED TIME OFFER: NEXT 25 CLIENTS ONLY ---46% OFF REGULAR PRICE AND 2 FREE BONUSES ---SEE BELOW FOR FULL DETAILS Reversal patterns are some of the most widely used setups in the institutional trading world.
And the most (statistically) accurate pattern of them all is called the ' Three Line Strike '. According to Thomas Bulkowski ( best selling author and a leading expert on candlestick patterns ),
the ' Three Line Strike '

Introducing the Volatility Doctor RSI, a groundbreaking tool built upon the trusted RSI indicator, designed to elevate your trading experience. Our indicator not only provides real-time RSI readings but also offers a precise forecast of where the RSI reading will be 10 steps into the future on any chosen timeframe and any preferred trading symbol.
Adaptive Intelligence: This tool learns and adjusts itself to any market, seamlessly integrating into your unique trading strategy to enhance your d
FREE

We at Minions Labs always like to defy the stablished systems and beliefs trying new things and new ways of seeing and interpreting the Market Data. And all starts with the following question...
WHAT IF...
You give more relevance and focus on the Wicks/Shadows on the candlesticks? And Why? In volatile markets wicks play an important role on determining who is winning the the fight between Bulls and Bears , and more than that, Higher and lower wicks can present you with a good status of the cu
FREE
MetaTrader Market - trading robots and technical indicators for traders are available right in your trading terminal.
The MQL5.community payment system is available to all registered users of the MQL5.com site for transactions on MetaTrader Services. You can deposit and withdraw money using WebMoney, PayPal or a bank card.
You are missing trading opportunities:
- Free trading apps
- Over 8,000 signals for copying
- Economic news for exploring financial markets
Registration
Log in
If you do not have an account, please register
Allow the use of cookies to log in to the MQL5.com website.
Please enable the necessary setting in your browser, otherwise you will not be able to log in.