Specification
Specifications > FREE ADVERTISEMENT Perk for yourself *TRUST ME, YOUR Contact Info WILL BE GETTING OUT THERE to the MASSES!* My team and I are TERRIFIC ONLINE MARKETERS So, if you DON'T want to get too many jobs, just let me know... I understand some people just want to do this on the side and not really take on a whole bunch of Jobs which is completely understandable ... As well as for Later Versions just incase you can't be reached via MQL5
* Updated
Specifications > Capability for Updates
* Version
* File Size
* Compatibility
Specifications > What systems will be needed to Allow this Indicator to work properly (Color Flashing Capabilities)
* I want the Capability to Give Users Permission and take away Permissions, and see who is using the software via Email Address as ID
Specifications > Who has a Copy = User Email > Email Verification
* ALL RIGHT RESERVED
Specification > Yes
----------------------------------------------------------------------------------------------------------------------------------------------------------------------------------------------------------------------------------------------------------
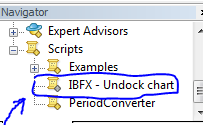
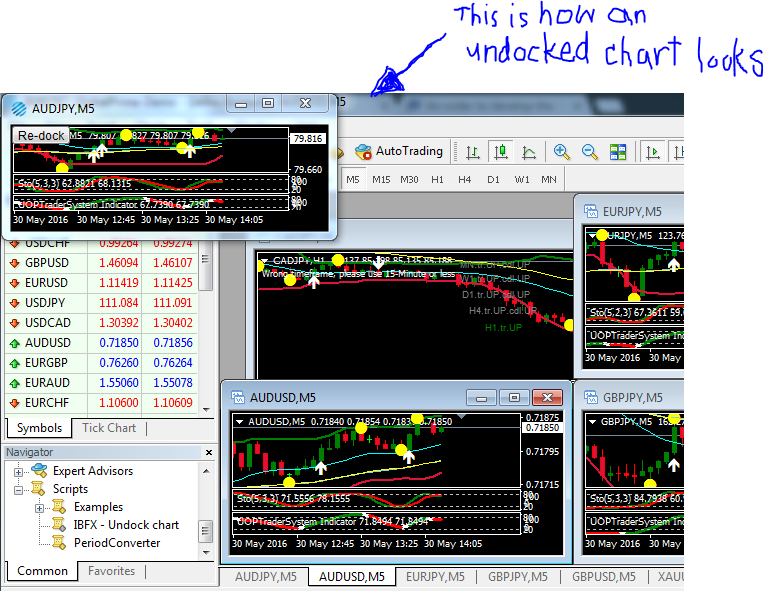
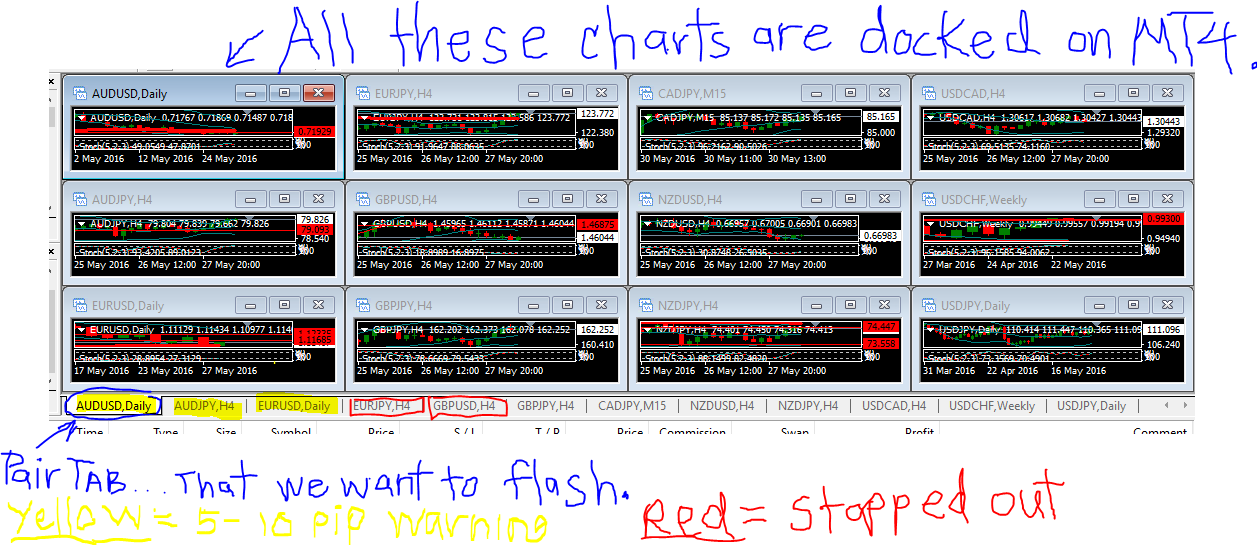
DOCKING & Undocking Charts to and from screens...
We have 4 monitors, not including a laptop But, I don't always use all 4... Sometimes just 2 not including our laptop. We would like to be able to DOCK to 2 of the monitors but, have theOPTION to DOCK to up to 10 monitors, or more.
Also, we would like some different OPTIONS and FEATURES with the DOCKING like:
1.) Platform OPEN and CLOSE MEMORY.... No need to RESET after Opening the Platform after Reloading from a Rebooted Laptop/Desktop
EASY to INTERCHANGE the CHARTS AMONG DOCKING SCREENS... For Example:
When I see a chart that I want to DOCK onto my Left Screen which is Labeled As: DOCK PORT 1 ... OR, If I want to DOCK onto the Right Screen which is Labeled As: DOCK PORT 2... OR, If I want to DOCK a Chart onto my Middle Screen which is Labeled As: DOCK PORT 3, I can simply use the DOCK PORT 3 SCRIPT to send that CHART to that DOCK PORT... and of course the possibility for DOCK PORT 4,5,6,7,8,9,10,11,etc.
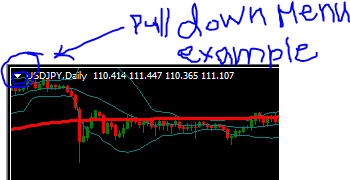
OR, There can be a PULL DOWN MENU ALREADY ON THE CHART which I can just choose which DOCK PORT to send the CHART to.
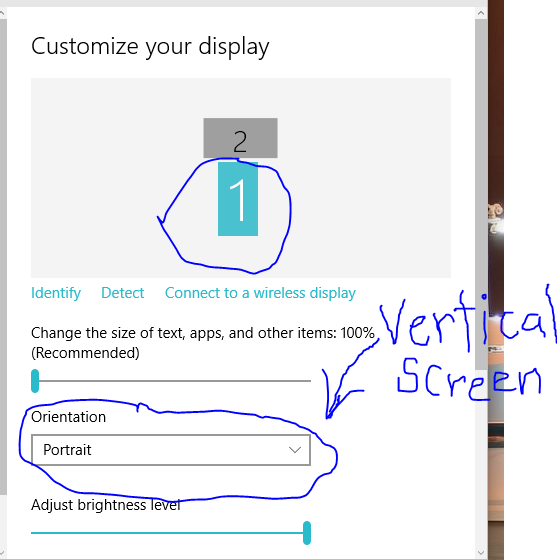
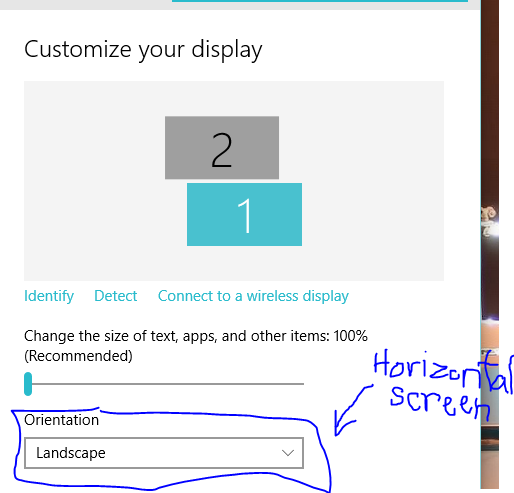
2.) ARRANGE CHARTS TO FIT TO SCREEN (Vertical or Horizontal) for Rectangular Screens OR, a BETTER more specified option for Square Screens
Different size Arrangements for the DOCKED Charts on the same screen... Dock OPTION #1... Bigger Window (More Important)... Dock OPTION #2...Smaller Window (Less Important)1/4 of the Bigger Window Size
--------------------------------------------------------------------------------------------------------------------------------------------------------------------------------------------------------------------------------------------------------------
We use some indicators already and would like to have these indicators work together WITH this newly designed indicator software: INDICATORS: Stochastic 5,2,3 (80/20) | UOP (Bollinger Bands, 14SimpleMovingAverage, 10SimpleMovingAverage, Super Signal, The WORM, 200ExponentialMovingAverage,)... Which I will send upon approval of the job, IF you need it... BUT, I BELIEVE THAT YOU WILL ONLY NEED THE STOCHASTIC, BOLLINGER BANDS, and the CANDLES
First for STARTERS.. we look at ALL Timeframes, as follows:
Monthly, Weekly, Daily, H4, H1, M30, M15, M5
Then, I will repeat this process for the WEEKLY, Daily, H4, H1, M30, M15, M5, M1
... and I would also like for the UP to turn GREEN and for the DOWN to turn RED... Also, for the CANDLE color signal GREEN to turn green... and for the RED candle signal to turn red
... We would like this process AUTOMATED, so we don't have to do this process MANUALLY anymore.
AND,
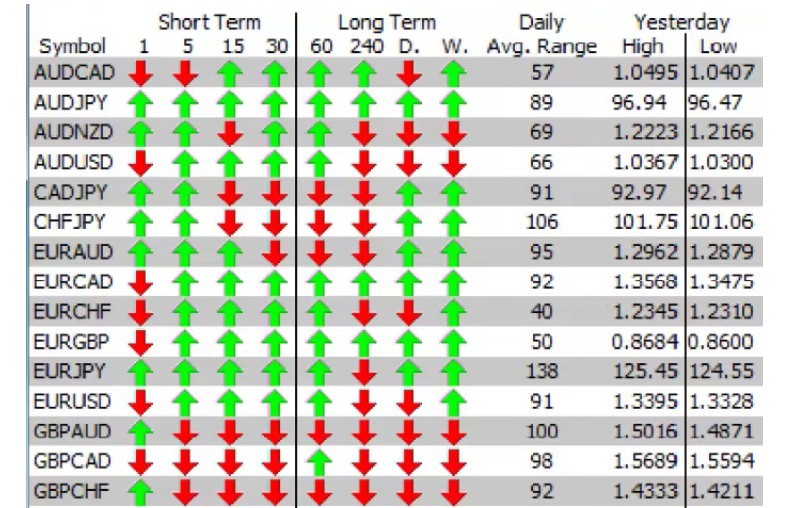
another type of similar system that has ARROWS instead, with a view of ALL PAIRS' CANDLES and TRENDS... FOR EXAMPLE: ||BELOW & IN ATTACHMENTS||
| CANDLES >> M1. (Arrow) M5 (Arrow) M15 (Arrow) M30 (Arrow) H1 (Arrow) H4 (Arrow) D1 (Arrow) W1 (Arrow) MN (Arrow)
| TREND >> M1. (Arrow) M5 (Arrow) M15 (Arrow) M30 (Arrow) H1 (Arrow) H4 (Arrow) D1 (Arrow) W1 (Arrow) MN (Arrow)
I'm not exactly sure how this will be viewed in a SEPARATE WINDOW BUT, I want the ability to DOCK this WINDOW as well. I'll leave that up to your creative magnificent mind to figure out.
AS WELL AS... DAILY AVERAGE RANGE(pips) for EACH PAIR out of a MONTH(20 Candles)
--------------------------------------------------------------------------------------------------------------------------------------------------------------------------------------------------------------------------------
STOCHASTIC ALERT... If a Pair(5 minute or higher) is at the 80 level or HIGHER or, If a Pair(5 minute or higher) is at the 20 level or LOWER the signal will Alert, every 5 minutes.
-------------------------------------------------------------------------------------------------------------------------------------------------------------------------------------------------------------------------------
BOLLINGER BAND ALERT... When the Bollinger Band is being TOUCHED AT THE TOP or, BOTTOM I want to be ALERTED.
... We want the capability to pick which pairs and timeframes we want to be Alerted for this, as well.
.........................................................................................................................................................................................................................
SUPER ALERT! (5 minute timeframe or higher)
.... When the STOCHASTIC is at the 80 or ABOVE level... &... touching the TOP of the BOLLINGER BAND by a CANDLE/Price AT THE SAME TIME.... OR, VICE VERSA
When the STOCHASTIC is at the 20 or LOWER level & touching the BOTTOM of the BOLLINGER BAND by a CANDLE/Price AT THE SAME TIME... not the exact second or minute but, sometime at the same time, ok.
-------------------------------------------------------------------------------------------------------------------------------------------------------------------------------------------------------------------------------------------------------------------
IMPORTANT NEWS ALERT!!!
(1 Hour Prior to NEWS, EVERY 5 MINUTES)
THREE EXCLAMATION NEWS!!! with FXSTREET comes out... OR... A RED FOLDER FROM FOREX FACTORY
-------------------------------------------------------------------------------------------------------------------------------------------
MARKETS OPEN AND CLOSE BELL ALERTS
FOR: Japan, Australia, Europe, Great Britain, Switzerland, New Zealand, Canada, United States,
-------------------------------------------------------------------------------------------------------------------
AUD/JPY AUD/USD EUR/JPY EUR/USD GBP/JPY GBP/USD CAD/JPY NZD/JPY NZD/USD USD/CAD USD/CHF USD/JPY ... OH, and GOLD and SILVER plus OIL.... so actually 15 BUT, if it could have a capability for all that would be even better I suppose.
... I will also put HORIZONTAL LINES for the highest and lowest parts of the WICK(dotted) & for the highest and lowest parts of the BODY of the CANDLE(solid)... keep in mind that this will keep changing, either going higher and higher or, lower and lower thru out the day, so you will need to monitor it and change the HORIZONTAL LINE points, if we were doing it MANUALLY, we would like to also make this process AUTOMATED
Monday = YELLOW ... Tuesday = DEEP PINK ... Wednesday = GREEN ... Thursday = GOLD ... FRIDAY = STEEL BLUE
EVERY WEEK we want ALL of these lines erased and RESTART the process every MONDAY morning for the start of the market.
... We also want the Capability to TURN THESE VERTICAL & HORIZONTAL LINE FEATURE OFF/DISABLE As well
---------------------------------------------------------------------------------------------------------------------------------------------------------------------
BELLS and Whistles!.... Please be honest and just let me know if you can NOT do this!!!
Flashing Signals... I would prefer for the Pair's TAB to Flash RED or, YELLOW... YELLOW if the PAIR is within 5 pips of getting STOPPED OUT... And RED when the PAIR has already gotten STOPPED OUT UNTIL CLICKED. But, if this is not possible, possibly the screen could DOCK to the Main Platform Window and Flash until clicked (IN ARRANGE WINDOW TILE form)
I would also like a the ability to have a SKYPE session for how to use the indicator just incase something is not exactly clear.... Not for regular back and forth chat, just presentation reasons if somethings are not clear here on MQL5.
............................................................................................................................................................................................................................................................................
*Information *
* Developer Name & Contact Info
Specifications > FREE ADVERTISEMENT Perk for yourself, as well as for Later Versions just incase you can't be reached via MQL5
* Updated
Specifications > Capability for Updates
* Version
* File Size
* Compatibility
Specifications > What systems will be needed to Allow this Indicator to work properly (Flashing Color Capabilities)
* I want the Capability to Give Users Permission and take away Permissions, and see who is using the software via Email Address as ID
Specifications > Who has a Copy = User Email > Email Verification
* ALL RIGHT RESERVED
Terms of Agreement...
1.) Give us a report every Tuesday and Friday,
2.) We must Test-out each Feature, to make sure it works well, this may take up to 48 hours.
3.) 5% visual Management will be coordinated from our Marketing Staff. They will be building our website(s), etc. So therefore, they will be giving access to the demographics, etc. o.k..