JOE OLA STRTEGY CUSTOME TEMPLATE!
Description: MT4
I need a
scanner that will have the following onboard!!!
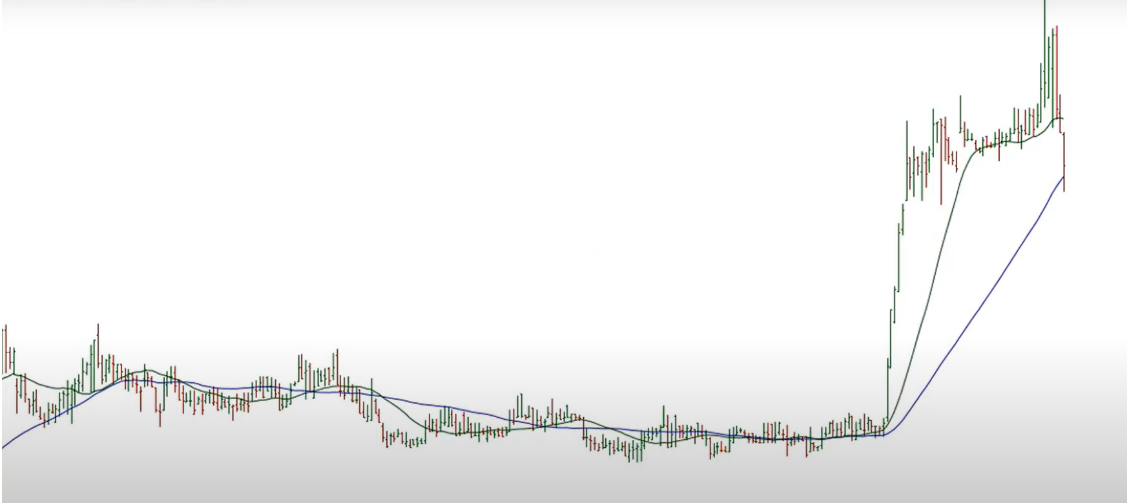
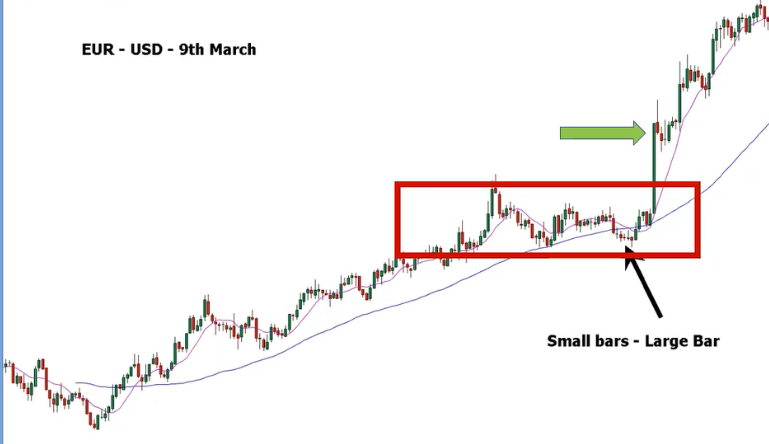
The scanner
will scan the market and look for any pair that is in {consolidation}
***The range of
the consolidation will be measured by loss of {momentum} on MACD Histogram.
***At the exact
range will draw a {rectangular box} on the chart from 5M, 15M, M30, H1, H4, Daily and Weekly.
THE TEMPLATE
***Each chart
will use the MACD below them to measure the range.
***There will be
Moving Average on each chart:
a/ 9 EMA i.e.
Exponential moving average (Colour Orange)
b/ 20 EMA
i.e. Exponential moving average (Colour Blue)
c/ 52 MA i.e.
Simple moving average (Colour Black)
***Chart default
colour will be WhiteSmoke***
NOTE!
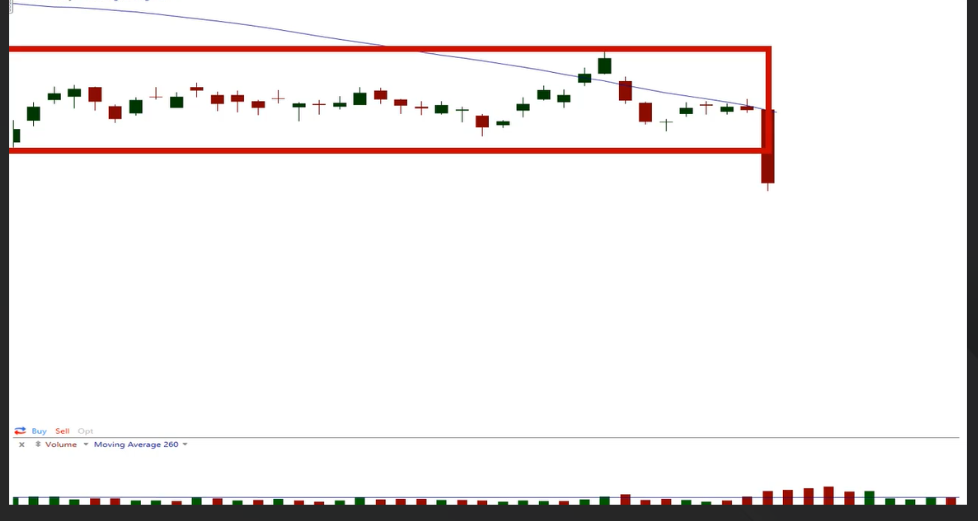
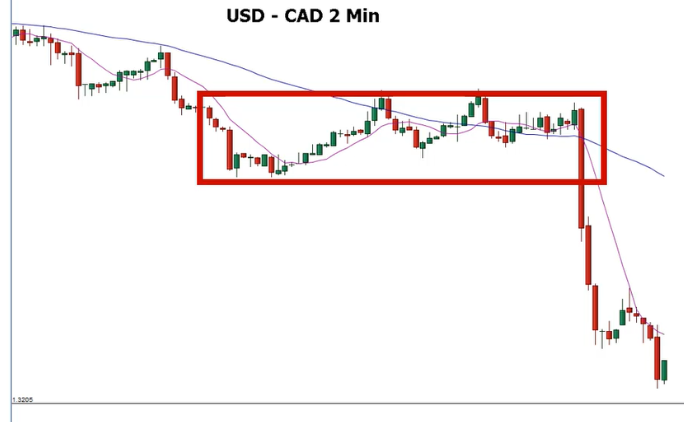
The scanner
will send out a signal immediately Price Breaks the box while the candle is still current. The signal must be out before the candle close.
When the Price
is above 52MA the signal will show the Pair with a little box of Green sign And
When the Price
is below 52MA the signal will show the Pair with a little box of Red sign.
When I click
the signal, I want it to (Open a new chart in Template form with all the above on the chart i.e.
***Each chart
will show what the scan found according to the following:
***There will be
Moving Average on each chart:
a/ 9 EMA i.e.
Exponential moving average (Colour Orange)
b/ 20 EMA
i.e. Exponential moving average (Colour Blue)
c/ 52 MA i.e.
Simple moving average (Colour Black)
And the box
will be shown on the chart
**********Very
Important***********
When Price is
above 52 Simple moving average the rectangular box will show with the colour yellow and when Price is below 52MA the colour will be magenta.
NOTE!!
I want the
scanner to have (Password Enable) function, so when I am done with my experiment, I can give it out to friends and family by password only.
Below are
images examples:
SECOND WORK
I need a
system that will draw a box on H4 candle on H4 Time Frame and project the same range move on H1, 30M, 15M, and 5M at the same time till the H4 candle
end.
And it will do
the same on the next H4 candle continuously from market open to market close 5 days a week
Image example
H4 candle, H4 Time Frame.
Similar orders
1. IF price forms: - Higher highs + higher lows → TREND = BUY - Lower highs + lower lows → TREND = SELL ELSE → NO TRADE 2. IF: - Trend = BUY - Price retraces to support zone - Bullish engulfing candle forms - TDI green crosses above red (optional) THEN: - Execute BUY 3. IF: - Trend = SELL - Price retraces to resistance - Bearish engulfing forms - TDI confirms THEN: - Execute SELL 4. Risk per trade = 1% of account Lot
Apply with a screen of your work . Symbol Specific Logic . Live Chart Optimization Check the Core logic . [back tests as well] Change points to pips . Create buffer for the zone
Looking for a Proven Non-Repainting Gold Indicator (XAUUSD) – High Accuracy & Ready-Made Solutions Only 📌 Project Description: I am looking for a high-quality, non-repainting indicator specifically for XAUUSD (Gold) that is already developed and tested. ⚠️ Important: I am NOT looking for a new indicator to be built from scratch. I want an existing, proven system that you have already created and are confident in. 🎯
Fair Value Gap Expert , Optimize the core logic for live chart . [Filters are working] Lets ace the trailing stop . Change points to pip . Project will start from next week
I hope to acquire a profitable and existing expert advisor (EA) from the gold market, with complete source code, to add to our client portfolio. you can WECHAT: Faca7898 Please note EA when adding friends. It should be clarified that this does not require you to formulate or design new strategies. If you already have a verified, consistent, and production-ready EA, I am willing to purchase it immediately and engage
I want to find a Developer to perform this work and settle payments in this Application. I undertake not to communicate with Applicants anywhere else except this Application, including third-party messengers, personal correspondence or emails. I understand that violators will be banned from publishing Orders in the Freelance service
I’m looking to acquire an existing, profitable Expert Advisor (EA) with full source code to add to our client investment portfolio. To be clear, this is not a request to develop or design a new strategy. If you already have an EA that is proven, consistent, and production-ready, I’m open to reviewing it immediately. Please apply only if you meet all the requirements below. Submissions without a proper introduction or
have the Beatrix Inventor Expert Advisor (EA) that was profitable in the past but has been losing money recently. I need an experienced EA developer/optimizer to study the trade history (especially Stop Loss hits, drawdown periods, SL/TP behavior, win/loss ratio, etc.) and recommend + implement specific tweaks so it becomes consistently profitable again. Your job: 1. Deep analysis of why the EA is no longer
I need a developer to start robot from scratch based on existing EA that is running live. I do not have the source file as my previous coder did not give it to me. What I do have is the investor password which is running the EA from the coder side but not from my end. I like someone to monitor the account and re create the same system for me
Hi, are you able to create a script/indicator on tradingview that displays a chart screener and it allows me to input multiple tickers on the rows. then the colums with be like "premarket high, premarket low, previous day high, previous day low" . When each or both of the levels break, there will pop up a circle on the chart screener, signaling to me what names are above both PM high and previous day high or maybe