Seasonality, Fibonacci, Pattern & Momentum Sugest a Reverse in EGX30 around 8730
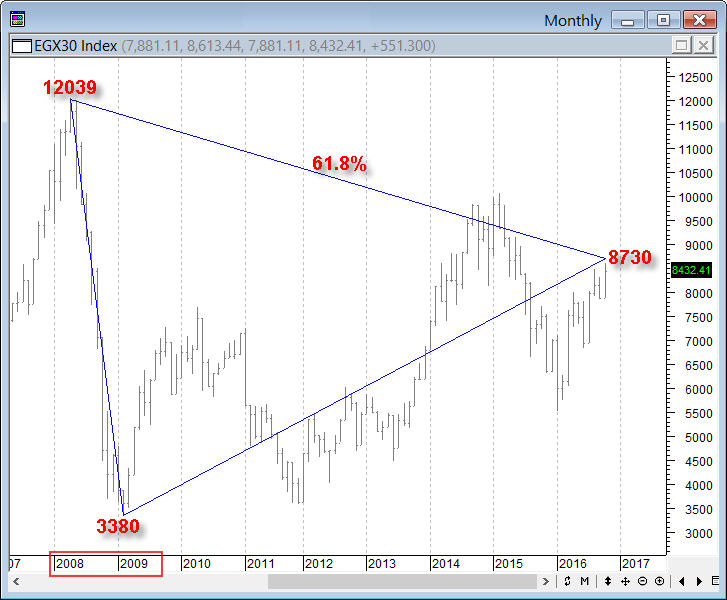
According to EGX30 monthly graph 8730 is Phi (0.618) from the highest high EGX30 ever reached till next low.
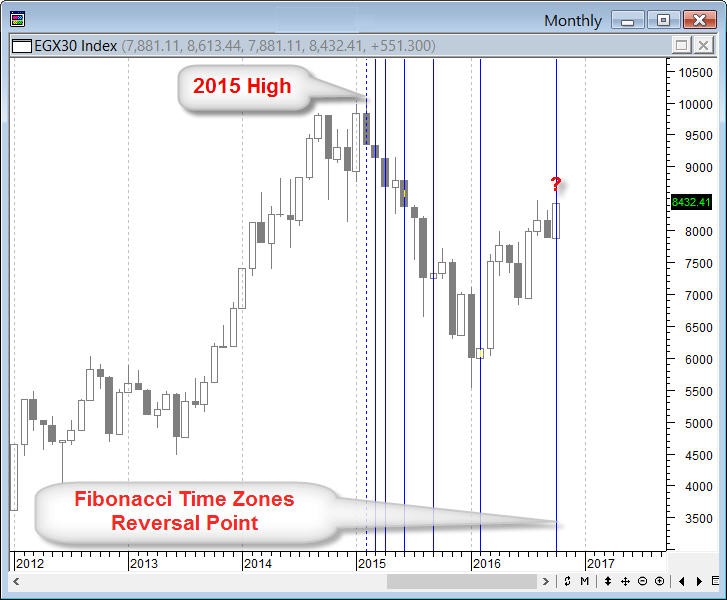
According to EGX30 monthly graph October 2016 is a time reversal point if we calculated Fibonacci Time Zones from 2015 peak until now.
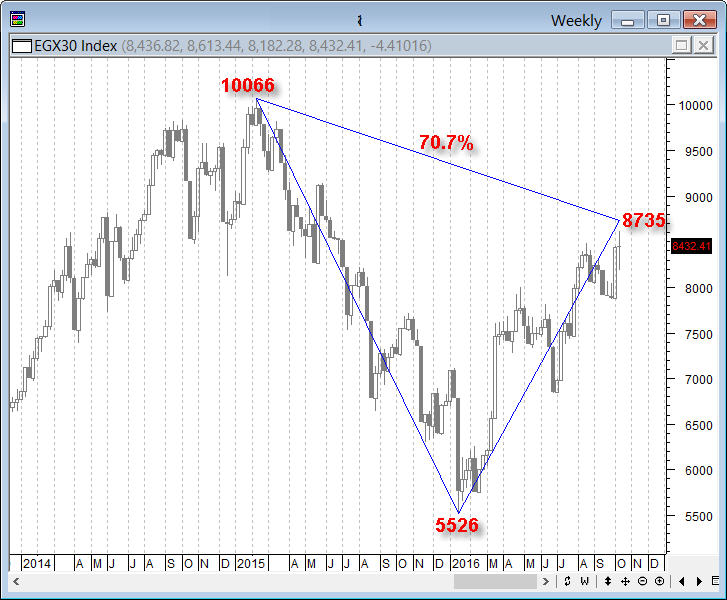
According to EGX30 weekly graph 8735 is 0.707 ( = 1 / square root[2] ) from the highest point in 2015 until the lowest point in 2016.
According to EGX30 daily graph 8712 is 1.618 extension of April - June declining wave.
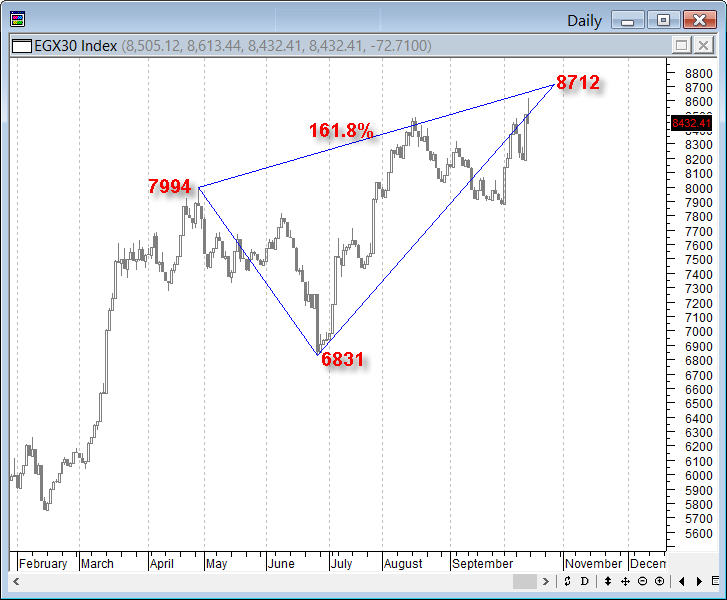
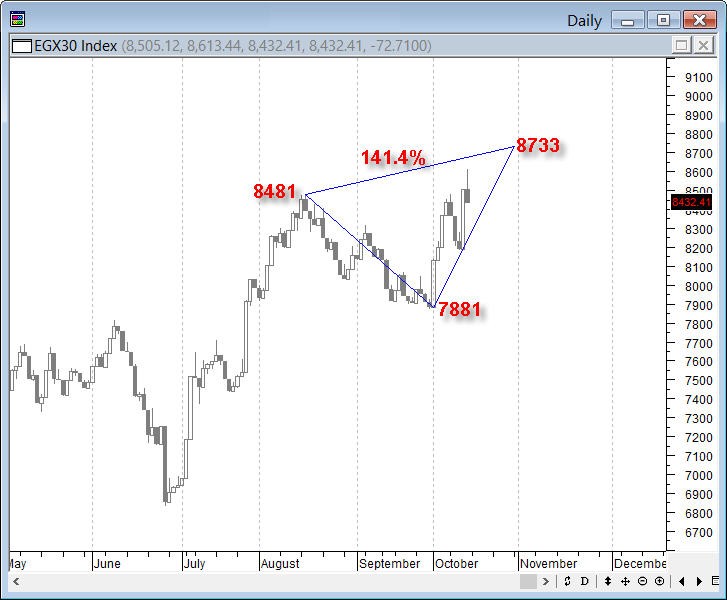
According to EGX30 daily graph 8733 is 1.414 ( = square root[2] ) extension of August - September declining wave.
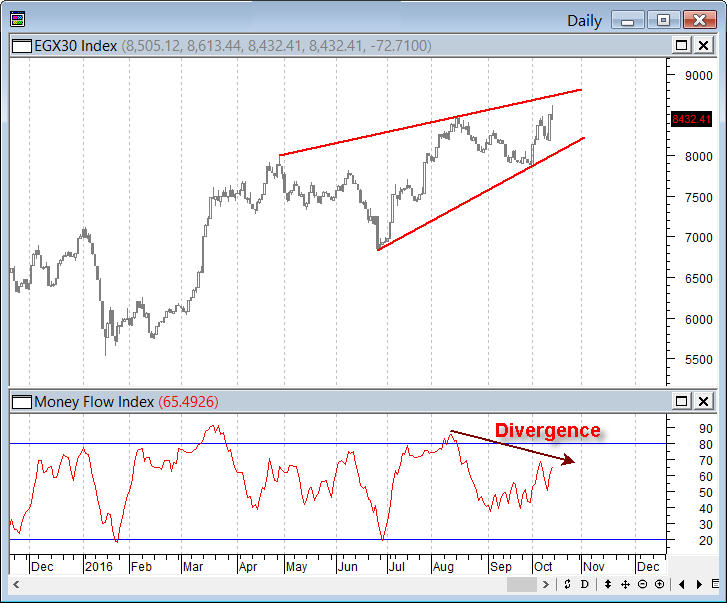
EGX30 is moving inside a Wedge.
There is a divergence between price candles and most momentum oscillators like Money Flow Index.
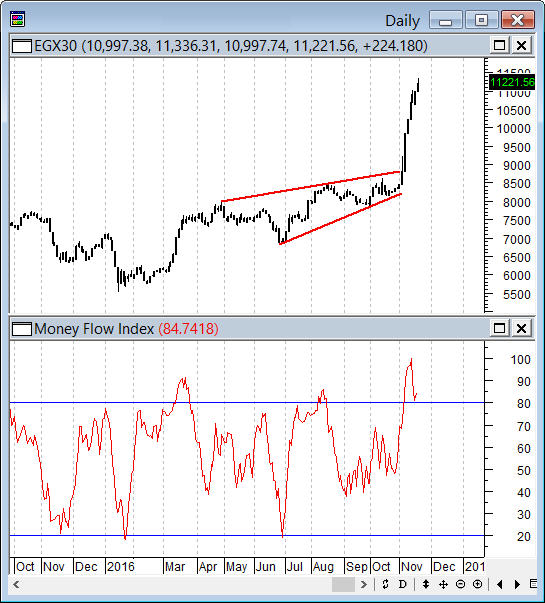
Well it seems that EGX30 moved against technical clues. 8730 was a Price reversal Zone and EGX30 gaped it to the outside and didn't reverse.
- Free trading apps
- Over 8,000 signals for copying
- Economic news for exploring financial markets
You agree to website policy and terms of use
In this topic I will show you why Egyptian EGX30 have a strong resistance around 8730.
So lets begin with Monthly Seasonality Pattern which say that EGX30 on average make a peak at September then fall trough October then a trough at November then begin an upside move in December.
So October is not a favorite month for upside movements according to EX30 Seasonal pattern.