Forecast for Q3'16 - levels for Bovespa Index
Forum on trading, automated trading systems and testing trading strategies
Sergey Golubev, 2016.08.29 19:13
This is interesting indicator which can be very usefull for the technical analysis for example.
Percentage - indicator for MetaTrader 4This is Brent Crude Oil (as we see - the oil price was increased by 13.86% for this month):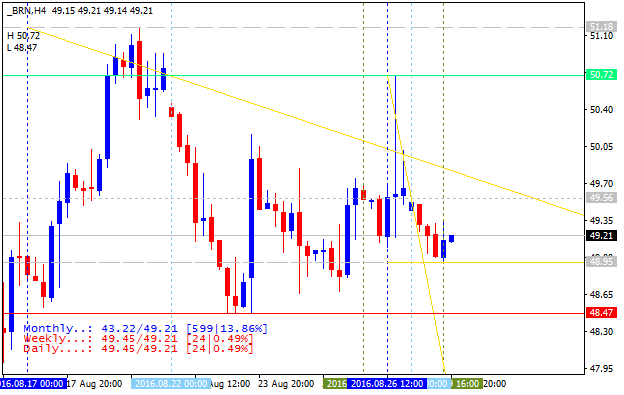
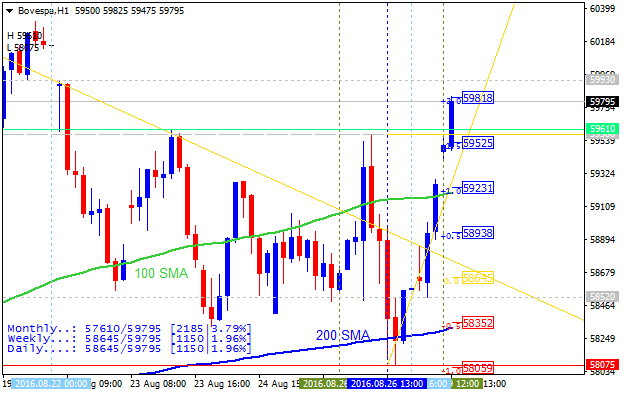
Bovespa Index was increased by 3.79% in a month and by 1.96% for the week:
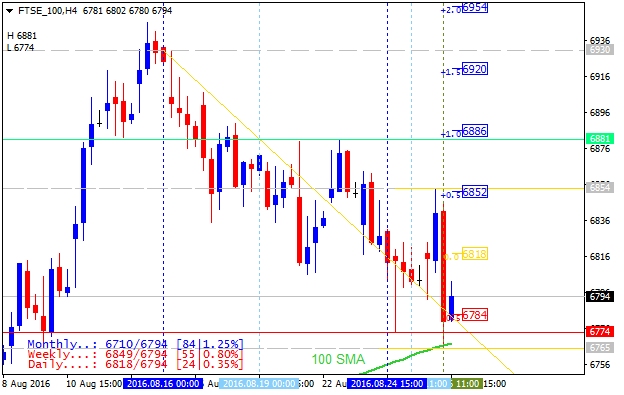
FTSE 100 index :
You are missing trading opportunities:
- Free trading apps
- Over 8,000 signals for copying
- Economic news for exploring financial markets
Registration
Log in
You agree to website policy and terms of use
If you do not have an account, please register
Bovespa Index - Long-Term Forecast: monthly breakout for the long-term bullish
Monthly price is located inside Ichimoku cloud for the breakout with the bullish reversal to be started on open monthly bar for now:
Absolute Strength indicator is estimating the long-term bullish trend in the near future.
SUMMARY : breakout
TREND : possible bullish reversal