Indicators: CCI T3 Tick
Forum on trading, automated trading systems and testing trading strategies
newdigital, 2014.01.02 18:43
Adapted from Backtesting to Find a More Reliable CCI Signal article
- CCI uses overbought and oversold levels to signal buy/sell entries.
- Only taking signals after a more extreme CCI reading could produce more reliable trades.
As traders, we should always be investigating ways to find a new edge or to increase the edge that we already have in our strategies. When I first began trading, this meant attempting to combine multiple indicators together, adjusting parameters for each one, and creating new, more complicated indicators in hopes of turning a profit. But after my first two years of trading, I discovered that often times the simplest strategies are the ones that give me the results I am looking for.
Attempting to Increase Reliability
The CCI bases its signals on prices that reach extreme highs or extreme lows, and looks to take advantage of the inevitable pullback that occurs afterwards. No move will last forever, so CCI helps guide us on when the move will turn back around.
We traditionally look to enter trades when the CCI crosses under +100 or above -100, but what if we also took into account how large the CCI became before crossing the +/-100 level? For example, sometimes the CCI will barely get beyond +/-100 before crossing back. But what about the times when CCI reaches 150, 200 or even 300? Shouldn't that create a more reliable signal for us? Because after all, the more extreme the initial move, the more extreme the pullback could be. The image below shows a CCI oscillator with CCI reaching levels beyond +/-100.
Testing Our Theory
To test this train of thought, we could go to the charts and manually see if there is a correlation between how far the CCI reaches and how successful each trade would have been, but that would take a very long time. Ideally, we want to look at hundreds of trades as efficiently and as quickly as possible.
Here is a summary of all the parameters used in my backtests.
- Test account started with $1,000 and traded 1 microlot (1k) at a time.
- Tested 24 months of price data (Jan. 1st 2011 thru Dec. 31st 2012)
- Tested on EURUSD and AUDJPY.
- CCI based on 4-hour chart data
- No stops or limits. Each trade was closed when an opposing signal was given, opening a trade in the opposite direction.
- The trades were triggered when crossing below +100 or above -100, but were required to reach the Overbought/Oversold Confirmation Level before the trade triggered or else a trade would not be placed. (So in the image above, it required CCI to reach at least +/-150 before crossing back over the +/- 100 for the trade to be placed. With these settings applied, if the CCI only reached +135 and then crossed below the +100, a trade would not be placed.)
- Ran multiple backtests with Confirmation levels starting at the traditional +/- 100 as my base, and increased the Confirmation level used in increments of 10 for each additional backtest (so +/-110, +/-120, +/-130, +/-140, etc, up to +/-300).
- This gave me 21 data points to analyze.
The Results
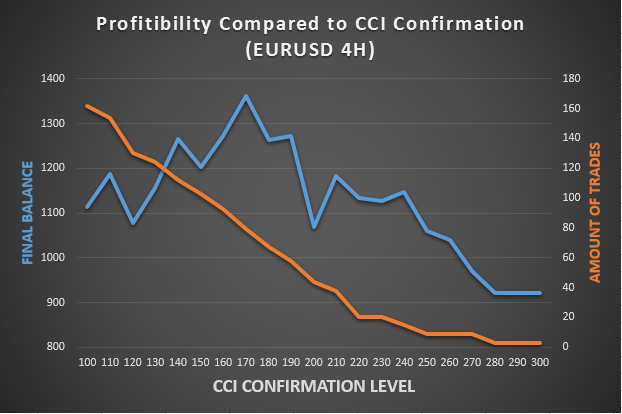
While a traditional CCI (+/- 100) turned a $1,000 account into a $1,114 account, we can clearly see that using a confirmation level of 170 yielded much greater results, posting an ending balance of $1,362. But, requiring larger confirmation levels led to diminishing returns, rendering the strategy unprofitable above a confirmation level of 270. You will also notice that as the confirmation level was increased, the strategy placed less trades overall. This is logical sense the higher levels of CCI are much more rare.
These results indicate that using a CCI confirmation level before placing a trade on a CCI cross could be a viable trading strategy to further research. Now, let's turn to the AUDJPY results.

The traditional CCI turned a $1,000 account into $734. This was a much poorer result than what we saw on the EURUSD. But once again, we saw that the results on average were much higher when we filtered based on a higher Confirmation level. While the 170-180 level was an improvement, better still was using a higher Confirmation between 230-260. At those levels, this strategy would have turned a profit of 10-20% from our initial $1,000 account.
Looking Forward After a Backtest
Historical performance is not indicative of future results. This is something we should all be aware of, but the tests shown today could help lead us to some new ideas that might yield better results as we move into the new year.
- Free trading apps
- Over 8,000 signals for copying
- Economic news for exploring financial markets
You agree to website policy and terms of use
CCI T3 Tick:
The CCI indicator smoothed using Tillson's algorithm.
Author: Alexey Topounov