Indicators: Pivot Point
The weekly period of pivot levels consists of only four days. How to eliminate it?
Please make the lines thinner.
And there is also a wish to add the "start of the day" setting, i.e. from what hour of the day to calculate pivot levels, which may differ from the terminal time.
Thank you in advance
Hi niuniu, thanks for your contribution, it comes in handy considering MT5 laks of this indicator.
I was double checking the math routine on your script to make sure it would correspond to how I would calculate pivot points based on different sources (e.g. Wikipedia, BabyPips, etc), and it seems we have a difference on how you calculate the third support (S3). You have this:
S3 = (2*P)-((2* LastHigh)-LastLow);
I would instead have done it this way:
S3 = (2*P)-((2* LastHigh)+LastLow);
Notice the positive sign for the LastLow variable.
In fact, if MQL5 does proper order of operations --which I believe it does--, you could safely simplify your routine by getting rid of most of the parenthesis, from this:
         P=(LastHigh+LastLow+close[i])/3;
         R1 = (2*P)-LastLow;
         S1 = (2*P)-LastHigh;
         R2 = P+(LastHigh - LastLow);
         S2 = P-(LastHigh - LastLow);
         R3 = (2*P)+(LastHigh-(2*LastLow));
         S3 = (2*P)-((2* LastHigh)+LastLow);
To this:
         P=(LastHigh+LastLow+close[i])/3;
         R1 = 2*P - LastLow;
         S1 = 2*P - LastHigh;
         R2 = P + LastHigh - LastLow;
         S2 = P - LastHigh - LastLow;
         R3 = 2*P + LastHigh - 2*LastLow;
         S3 = 2*P - 2*LastHigh + LastLow;
Please double check the S3 calculation to check if you got ir right, and thanks again for the script!
Forum on trading, automated trading systems and testing trading strategies
Indicators: Pivot Lines TimeZone
newdigital, 2014.01.30 11:06
How to Use Forex Yearly Pivot Points to Forecast Euro Targets (based on dailyfx article)
- Pivot points is a popular and easy way that traders can identify potential support and resistance
- Pivot points are based on a mathematical calculation that uses the previous high, low and close of a specified period; weekly, daily, monthly, yearly
- Yearly pivots can forecast maximum and minimum price extremes for the coming year as well as areas where price can change direction.
While most traders are familiar with daily, weekly, and even monthly pivots which fit their type of trading, yearly pivots can also be used to forecast future potential support and resistance areas. Buying at or near a significant area of support and selling at a key area of resistance is the main focus of any trader no matter what the market or the duration traded. Yearly pivots can be monitored for those key trading opportunities.
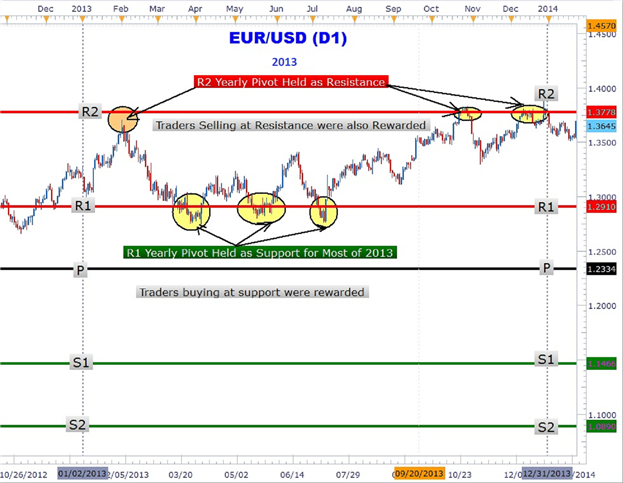
As you can clearly see in the Euro chart above, forex yearly pivots have been plotted. Notice how the Euro rallied up to the R2 pivot and turned around sharply falling over 600 pips in February. Another significant area that can be easily seen showing the power of yearly pivots is the triple touch of the R1 yearly pivot at 1.2910. The third and final touch led to over a 600-pip rally back to the R2 yearly pivot to close out 2013 up over 4%.
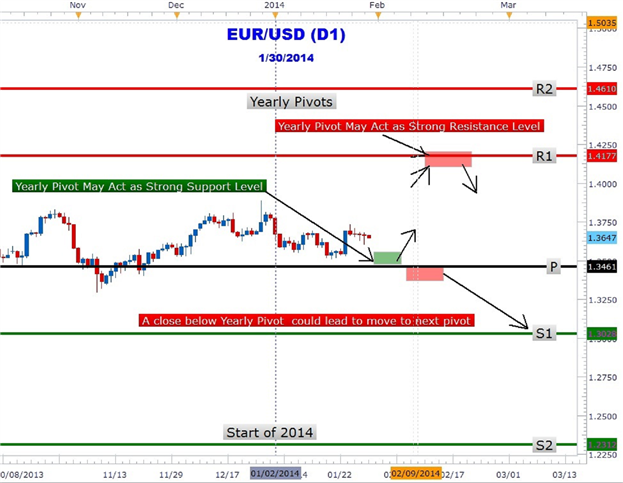
Could forex yearly pivots show traders the next move in the Euro? In the chart above the 2014 yearly pivots are plotted on the EURUSD chart. The year is just getting started and the great thing about yearly pivots is only having to draw them once a year! EURUSD is trapped between the central pivot at 1.3461 and R1 at 1.4177. As at the time of this writing, the Euro has not tested either pivot. However, forex traders may be waiting for a move down to the central pivot (1.3461) for a move back toward the R1 (1.4177) yearly pivot resistance.
Alternative scenario is for the Euro to make an immediate run for it up to the R1 level. At R1 pivot resistance, traders may look to take profit on their longs and/or short the Euro at this level. However, a close above R1 could lead to a move higher to the R2 pivot (1.4610). Traders should also consider the possibility of a close below the central pivot that could lead to a prolonged down push to the S1 (1.3028) level.
Forex traders who scalpers, position or swing traders can make use of yearly pivots to locate key areas of support and resistance. Look for future articles on other currency pairs that lay out the yearly pivot ‘landscape’ to help you navigate the forex market.
Forum on trading, automated trading systems and testing trading strategies
Scripts: Drag and Drop Support and Resistance lines with color differentiation
newdigital, 2014.06.11 14:17
Static Support and Resistance in the Forex Market (based on dailyfx article)
- Traders can use support and resistance to grade market conditions, define trends, and enter positions.
- We discuss ‘static’ methods of support and resistance in the below article.
- We delve into pivot points, and psychological support/resistance analysis
After all, if price has hit a floor with which it may have difficulty breaking through (support) or a ceiling with which it may not be able to rise above (resistance); this can offer a plethora of trade ideas and setups.
Unfortunately, most new traders learn one or two ways of identifying support or resistance; and when they see that it doesn’t work all-of-the-time, they abandon such studies in hopes of finding ‘holy grails’ elsewhere.
Well, holy grails don’t really exist. It often takes the new trader some time to learn this lesson the hard way: There is no strategy or approach or indicator that will allow a trader to always win, no matter how strong the analytical method being employed. Rather, trading is about probabilities and attempting to get them on your side or in your favor as much as humanely possible using this analysis.
Support and resistance has a special role in this analysis. It can be used to grade market conditions, determine trends, identify entry and exit points along with a bevy of other options.
Pivot Points
This is one of the more common mannerisms of identifying support and resistance, and it’s also one of the oldest. Pivot points originated before computers became common in financial markets as floor traders need a quick and easy way to see if prices were ‘cheap’ or ‘expensive.’
So these floor traders developed a short-hand manner of getting support (cheap) and resistance (expensive) levels.
These floor traders would take the previous day’s high, low, and closing prices and would average these
values together to find the ‘pivot’ for the next trading day. Price action trading above this pivot would be ‘bullish’ while prices below would be ‘bearish.’
While this is fine and good, it doesn’t tell us much about support or resistance yet; so to take this a step further, traders would then multiply the pivot by two, and would then subtract the previous day’s low to get the first level of resistance (R1). They can then do the same to find the first level of support (S1), multiplying the pivot value times two and then subtracting the previous day’s high.
After the R1 and S1 values are solved, traders can then move on to the next levels of support and resistance. To find the second level of resistance (R2), traders can add the pivot value to the difference between R1 and S1; and the second level of support could be found by subtracting the difference between R1 and S1 from the pivot value. The full equation is below:
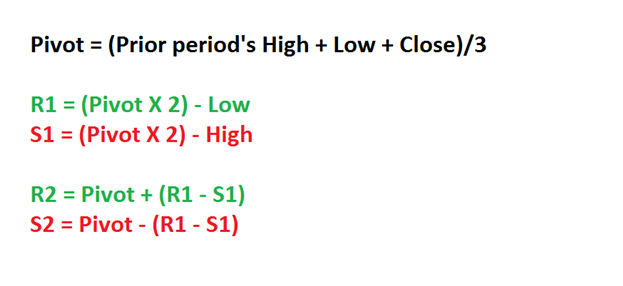
As you can see from the equation, pivot points use very basic math to find potential support and resistance levels. Luckily for traders, most charting packages will automatically do this math for us while plotting the support and resistance levels at appropriate intervals.
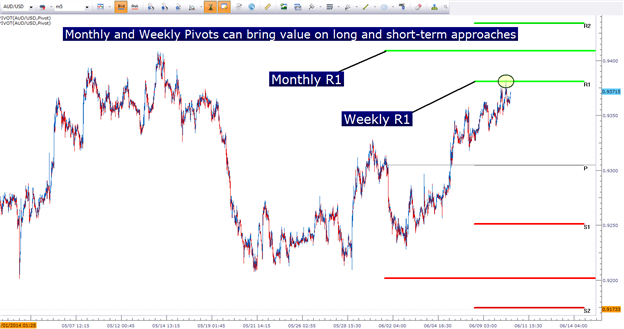
Pivot Points can be generated for a variety of time frames, and the longer-term pivots will often work best as more traders may be seeing and reacting to those levels.
As with most forms of technical analysis, the longer the term being used in the analysis the stronger the response that may be elicited. Pivot points of monthly and weekly flavors will often attract significant interest, and should be followed by traders even if using shorter-term hourly and four-hour charts.
Monthly and Weekly Pivot Points can bring value on long as well as short time frames
Psychological Levels
One of the most alluring aspects of technical analysis is the ability of statistics and mathematics to show patterns in human behavior. Nowhere is this more prominent than in the study of ‘psychological’ levels in financial markets.
Most human beings think in even rounded whole numbers. We can’t help it; our species has evolved to value simplicity. As an example, ask someone how much they paid for their car or their jacket, or even their latte.
They’ll likely round their answer up (or down) to the nearest round number. This type of rounding will often happen in markets as well; as traders place their stops or entry orders at or around these levels in the same way that most human beings will respond when asked how much they paid for their coffee.
GBPUSD Weekly chart with ‘Major,’ and ‘Less Major’ levels identified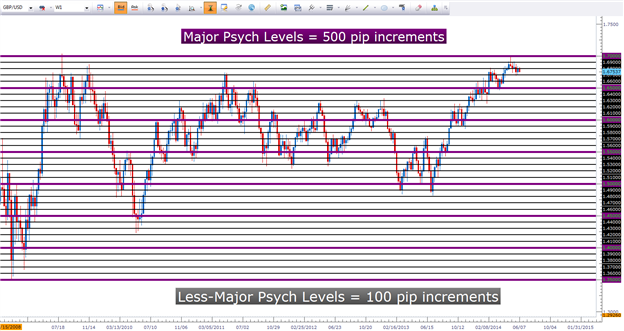
As you can see, these levels can come up quite often in a market, particularly during strong trends as new prices run into fresh resistance levels (or support levels in the case of a down-trend).
This study of support and resistance can be taken a step further with the ‘minor’ prices that are set in 25-pip increments; known as the ‘minor’ psychological levels. In the chart below, we’ve moved down to the hourly chart in the same market looked at above (GBPUSD) with the addition of these more granular ‘minor’ levels:
Hourly GBPUSD with Minor psychological levels added (25-pip increments)
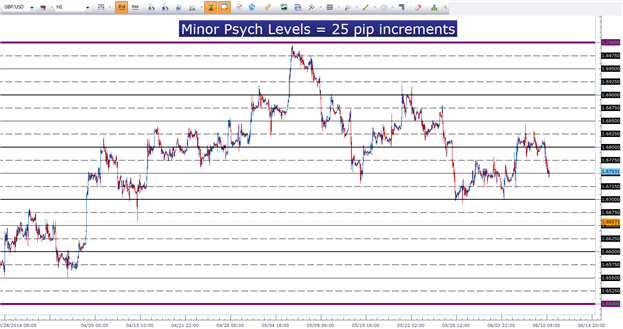
With psychological levels taking place every 25 pips, there are numerous opportunities for traders to ‘catch swings’ in a market.
To put more power behind psychological levels or pivot points, traders can look for confluence amongst these analytical methods; including the dynamic support and resistance mechanisms that we’ll investigate in our next installment.
- Free trading apps
- Over 8,000 signals for copying
- Economic news for exploring financial markets
You agree to website policy and terms of use
Pivot Point:
Classic Pivot Point indicator paints pivot point and three resistance and support levels for all data points.
Calculation period: Day, Week, Month.
Author: niuniu